Yandex DataLens release notes: June 2024
Updates
Viewing linked objects
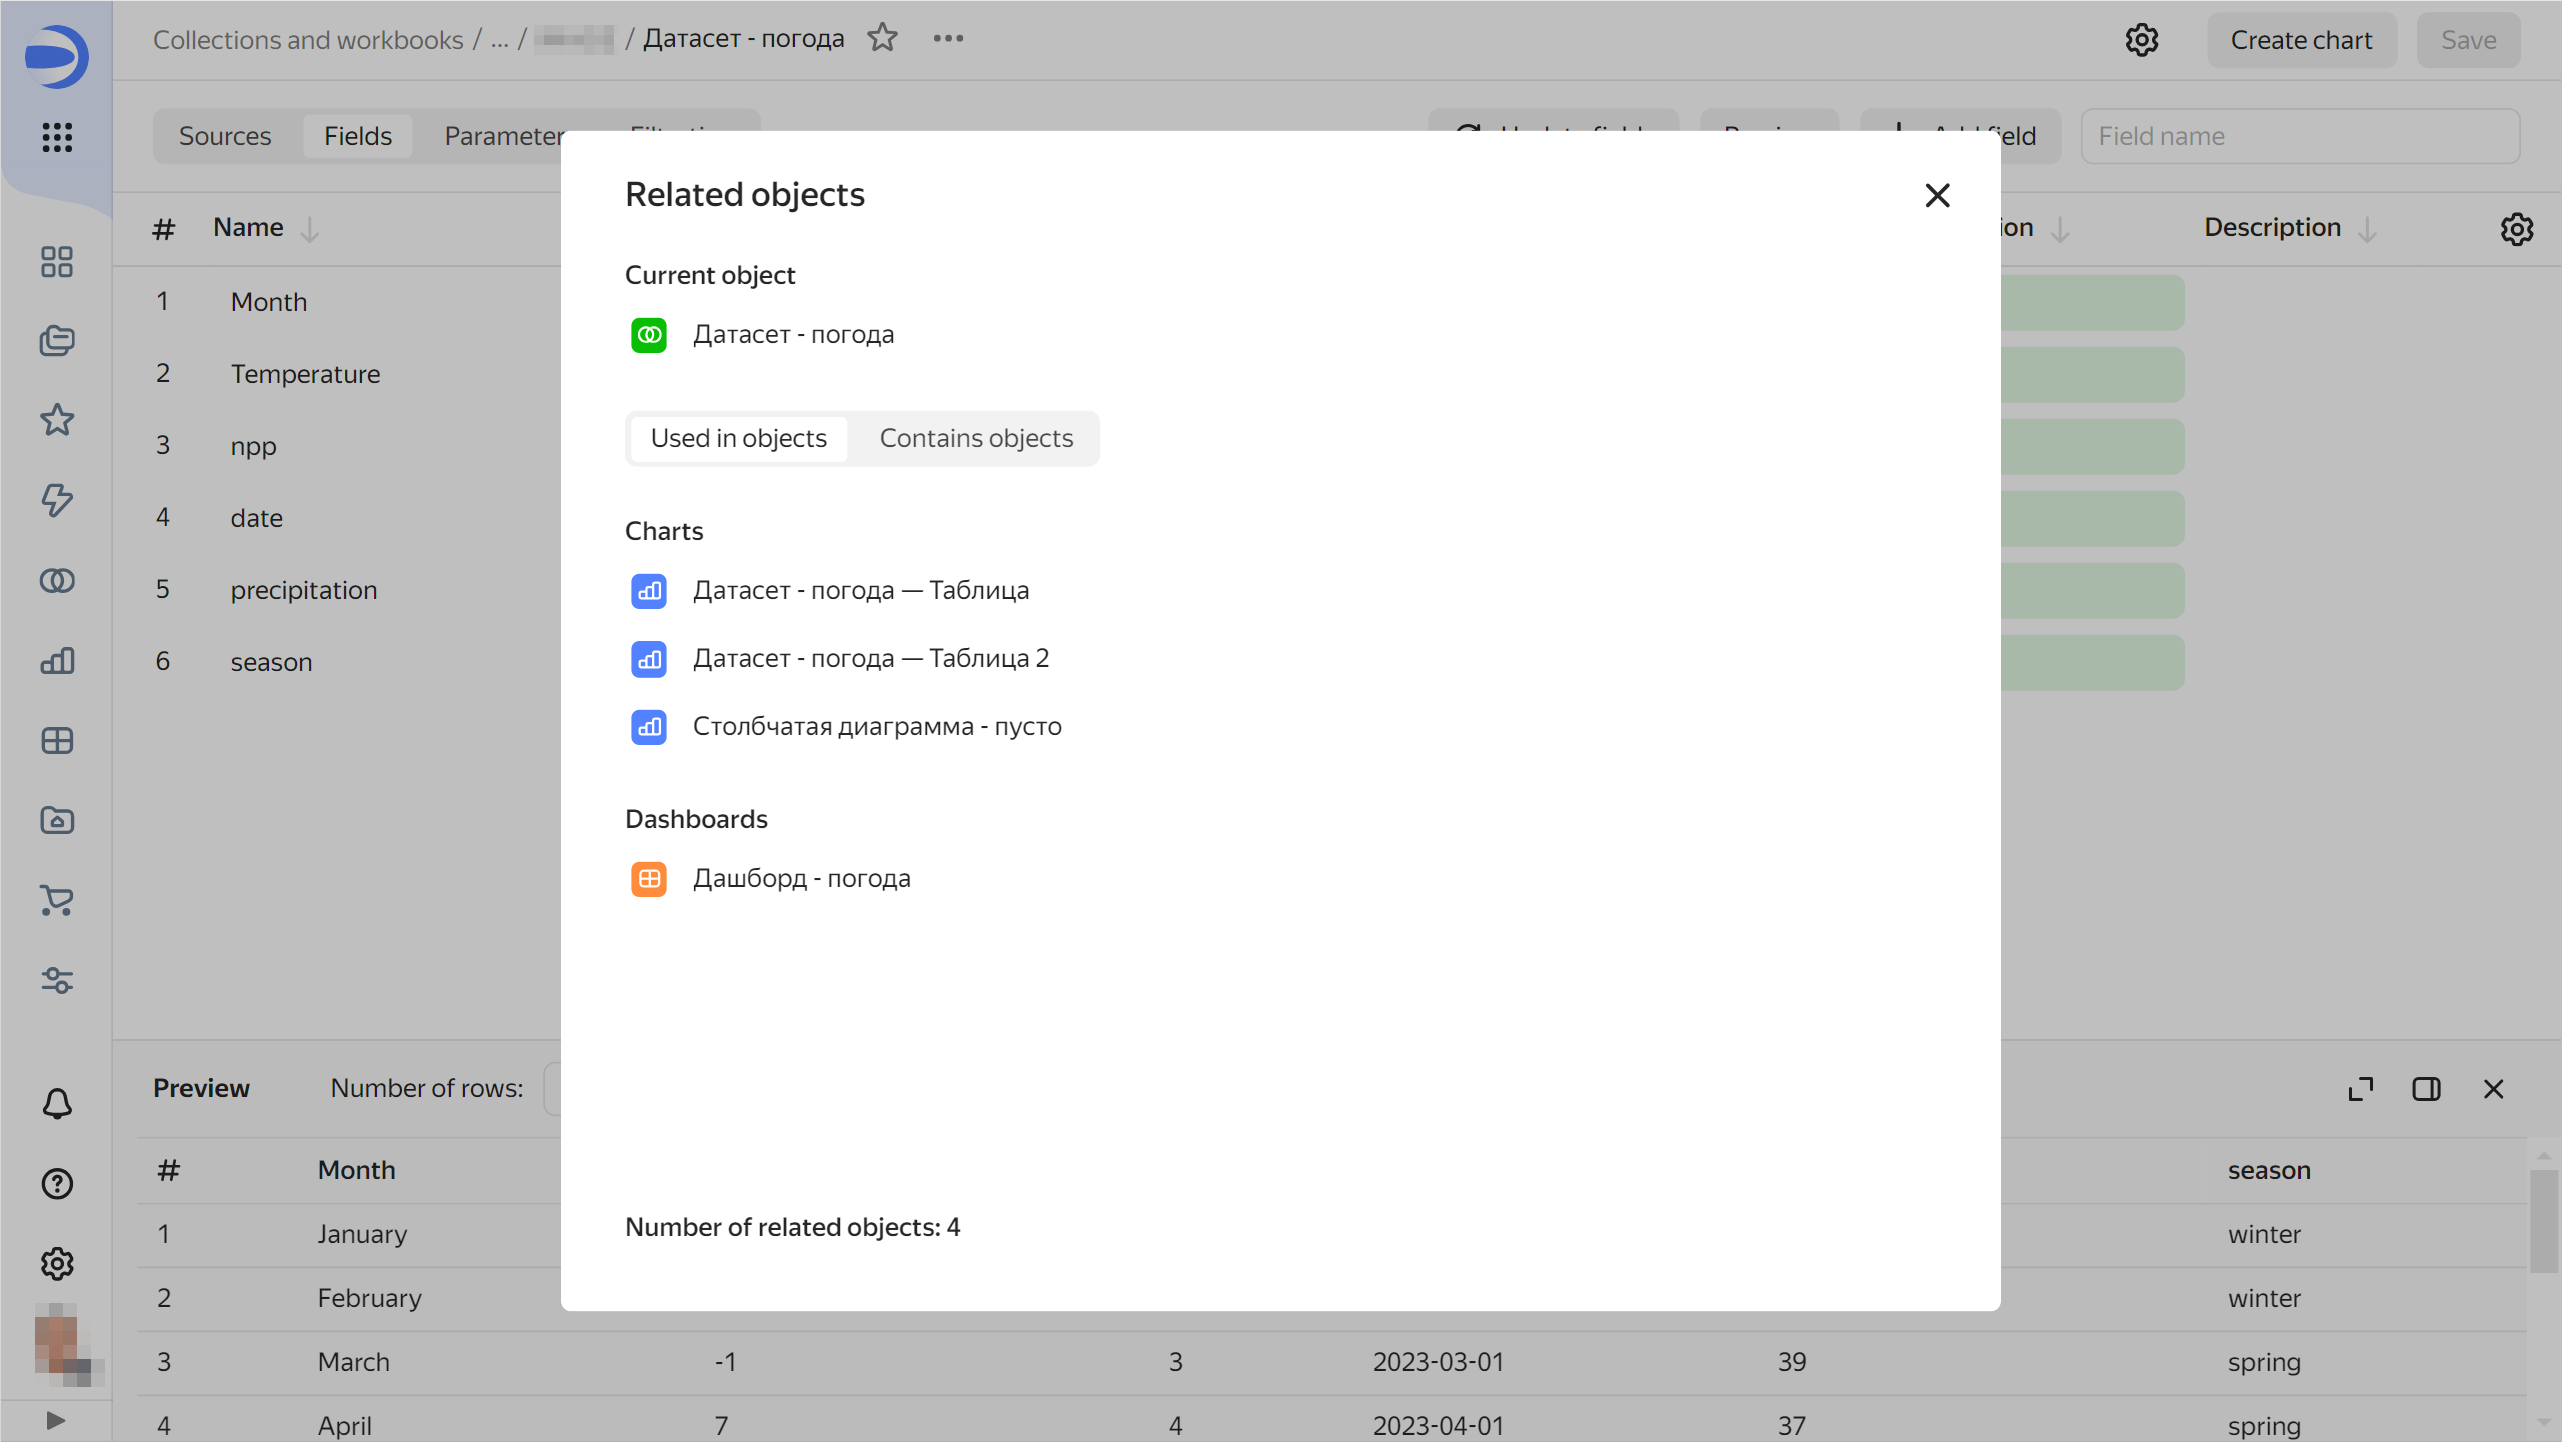
You can now see where an object is used or which objects it is using. To do this, click → Linked objects on the navigation page or object editing window. For example, this can give you a clue as to the sources used to build a dashboard or the charts based on a certain dataset.
Linked object window
Basic background color for widgets
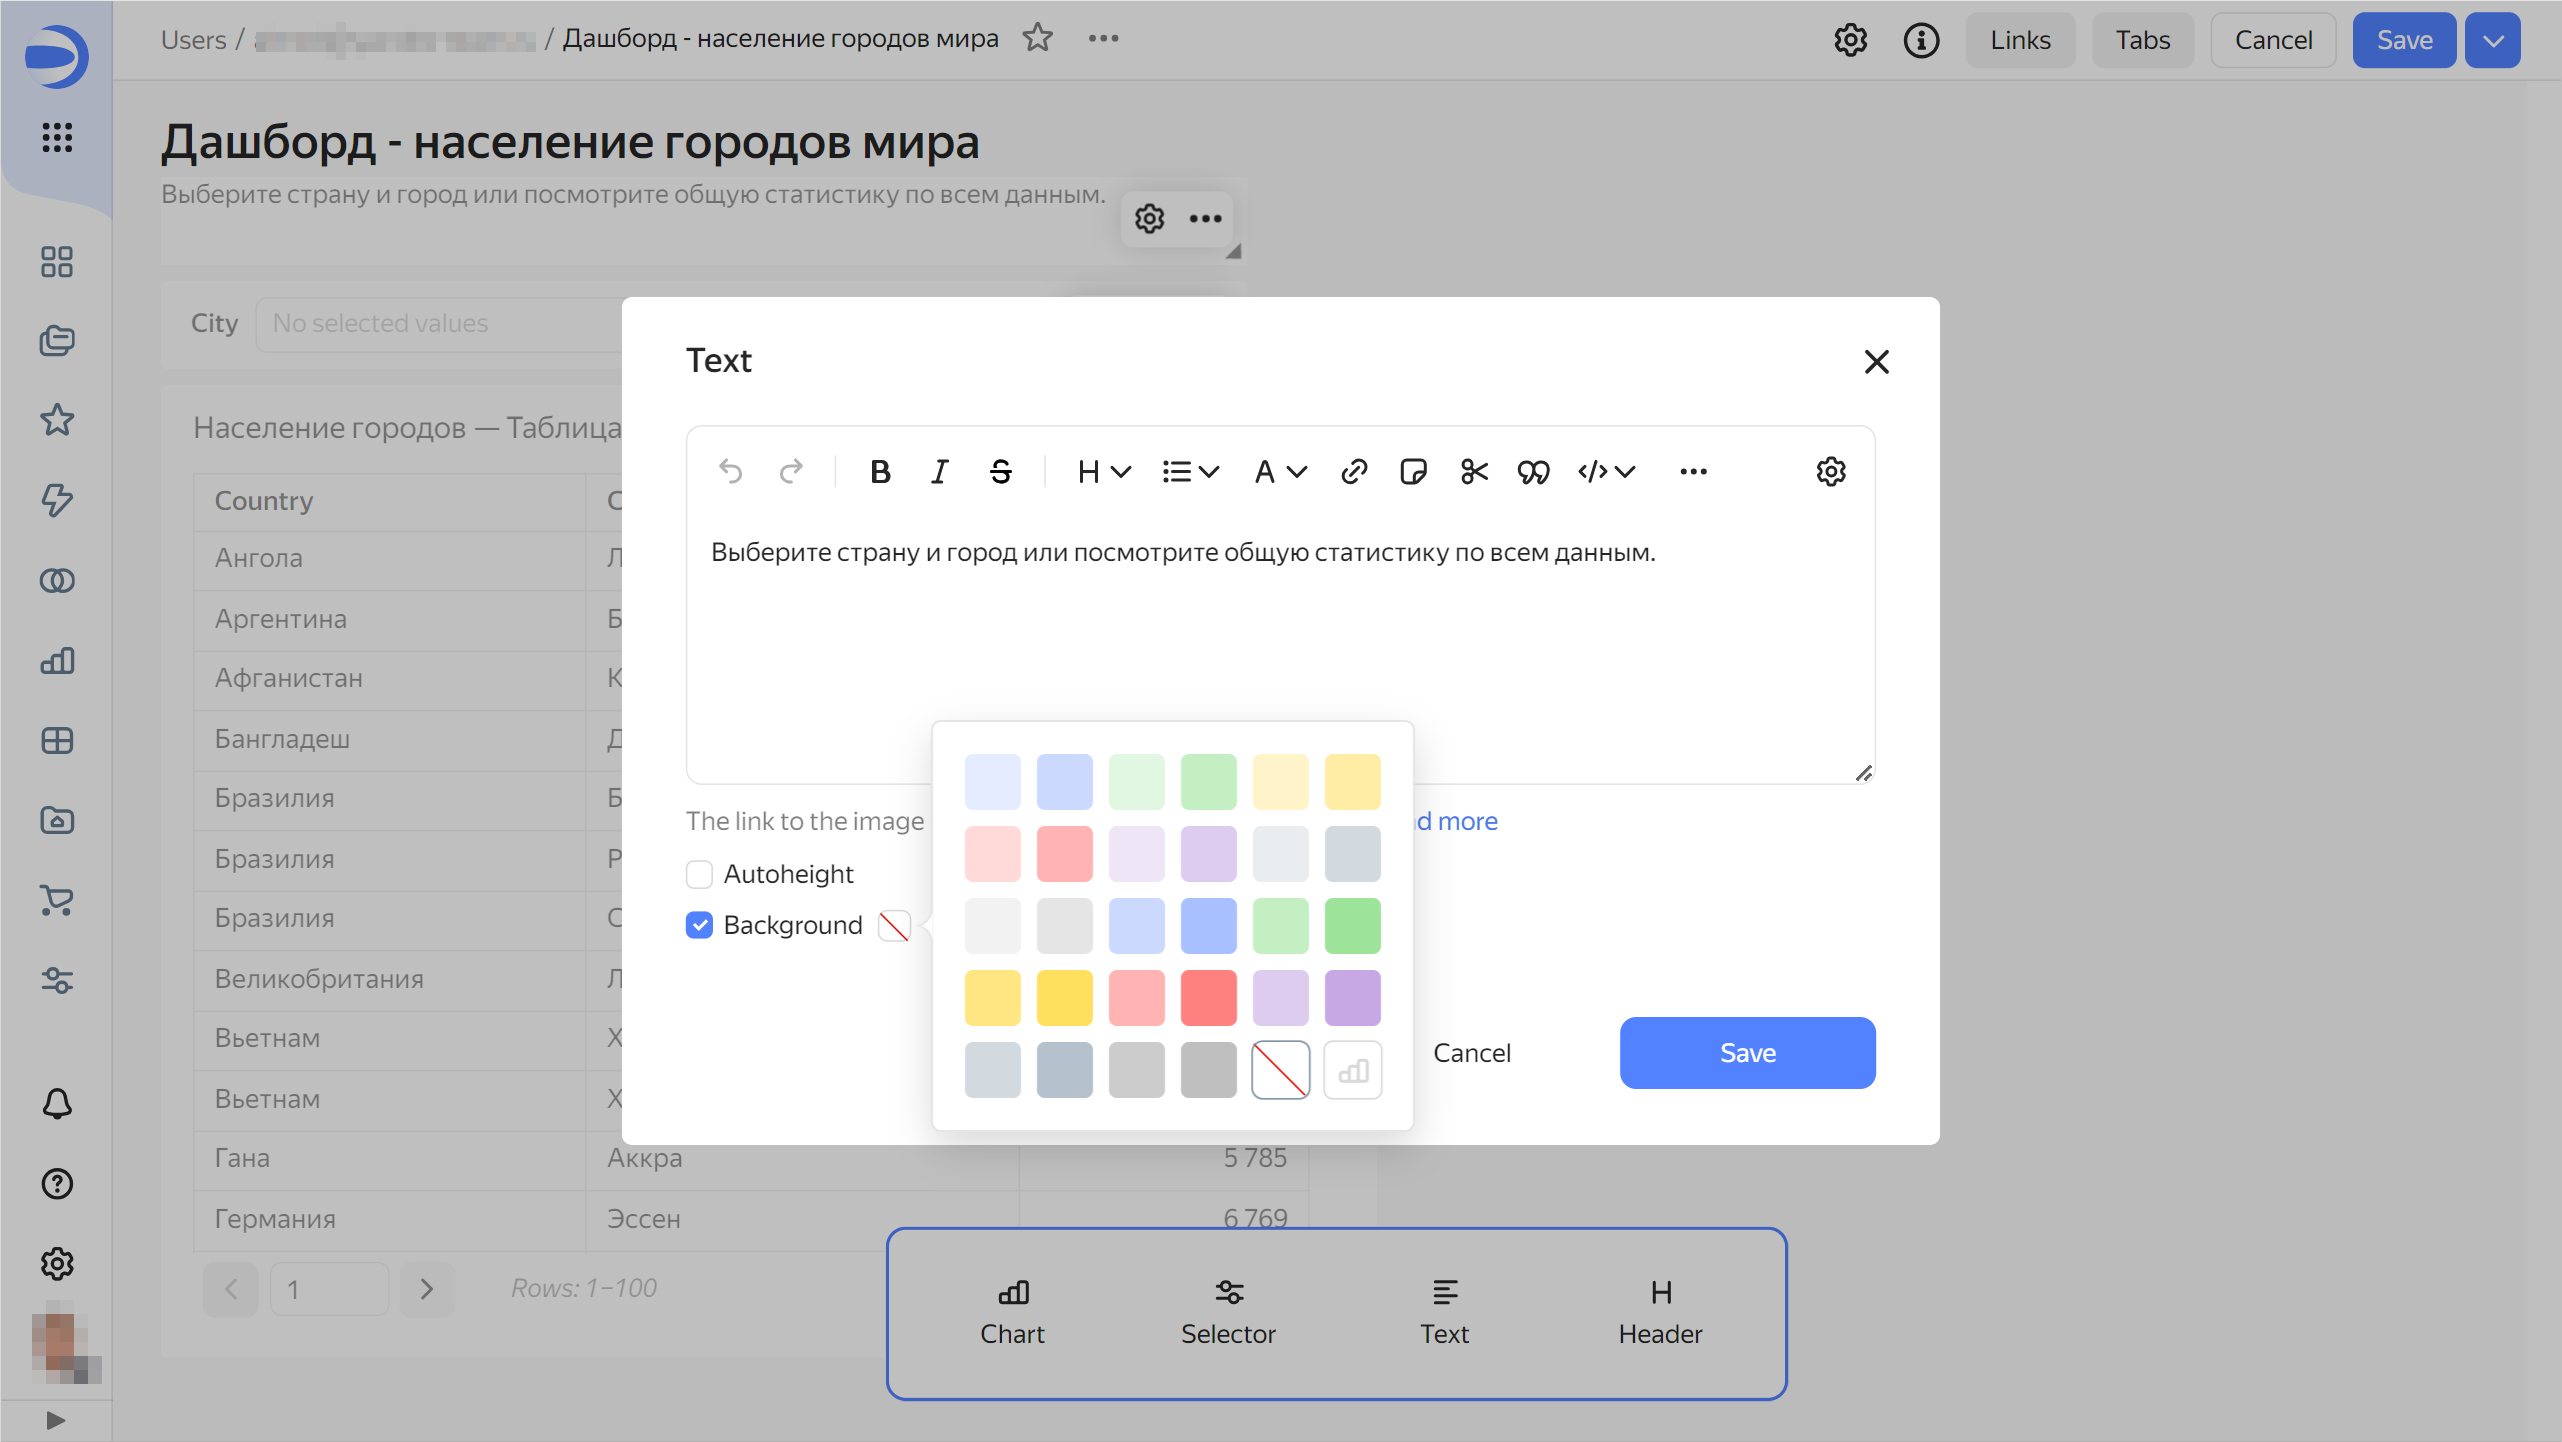
Now you can set the same background color for the Text and Header widgets as for charts and selectors: white for the light interface theme and dark gray for the dark one. To do this, set the background color to Basic in the widget settings window.
Text widget settings window
Disabling default preview in a dataset
Now you can disable default data preview at the dataset level. This is especially useful when editing datasets with large numbers of complex calculated fields.
Displaying a header in the indicator
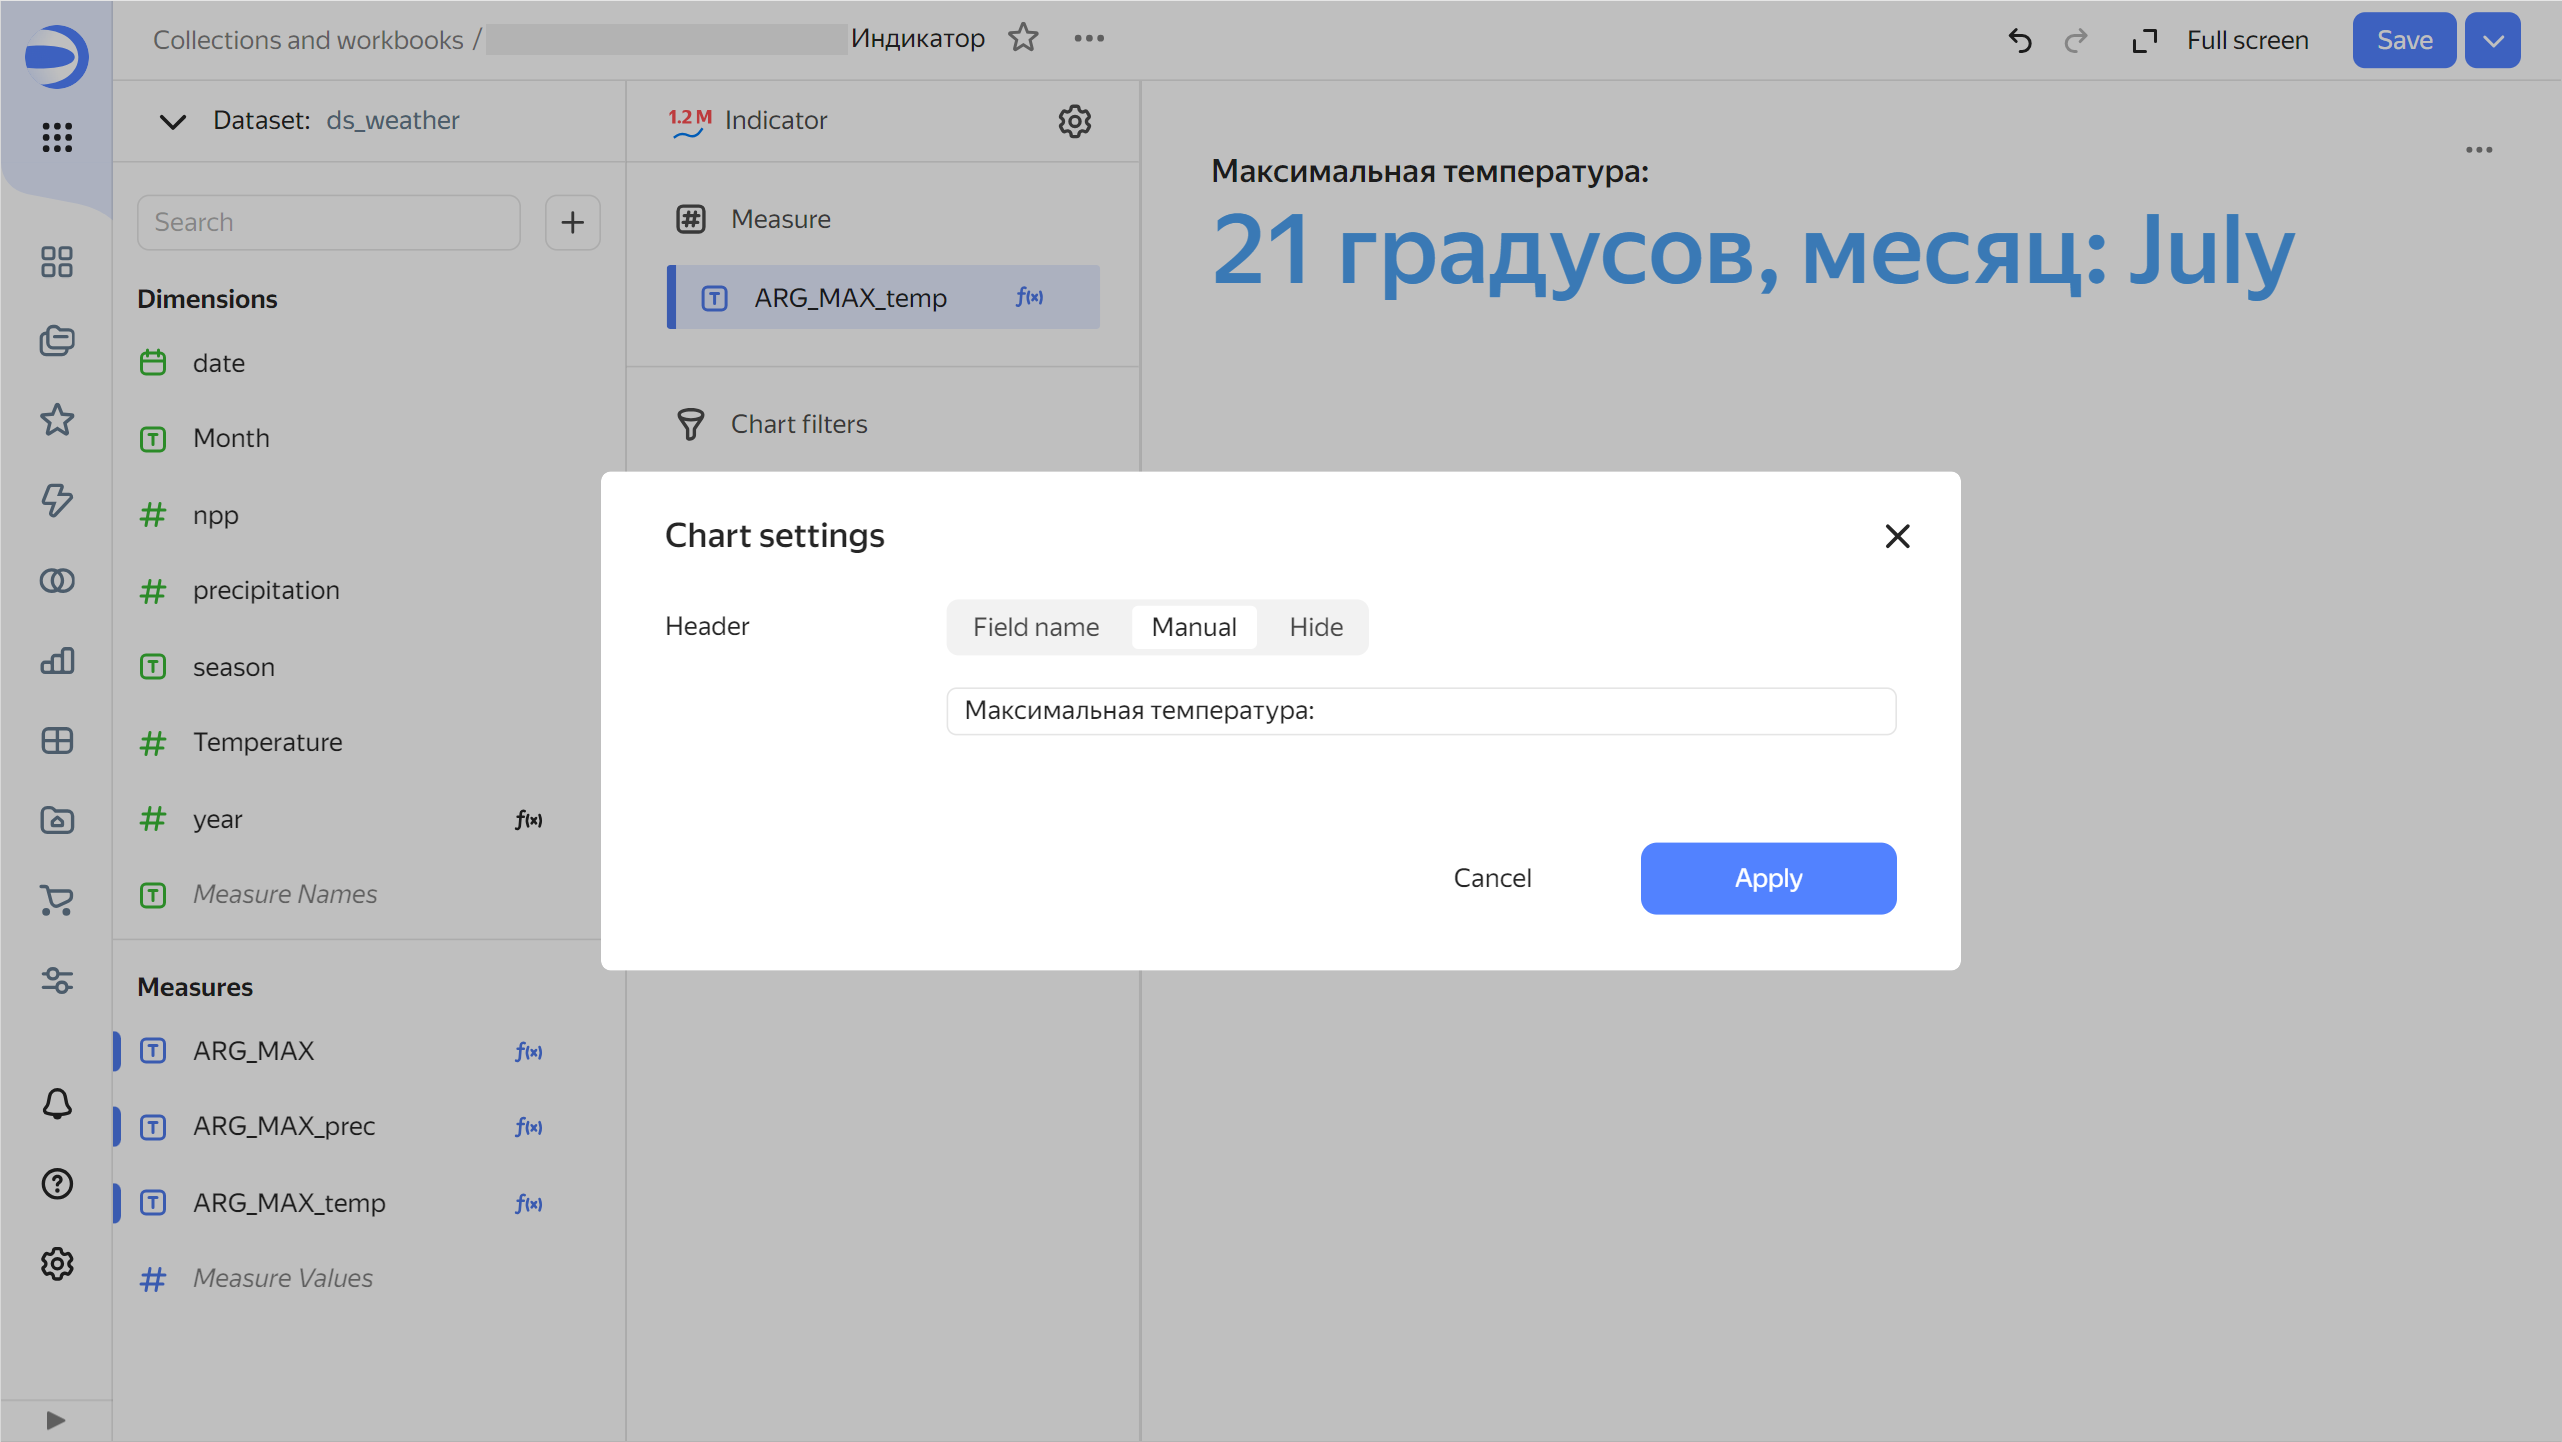
You can now customize header appearance in the Indicator chart's settings:
Field name: Show field name in header.Manually: Rename header.Hide: Hide header.
Indicator chart settings window
QL charts based on Managed Service for YDB
Now you can create QL charts based on a Managed Service for YDB connection.
Undoing and redoing changes in the wizard
When editing a chart, you can now undo/redo any change introduced within the current version:
- To undo changes, click in the top-right corner of the screen or press Ctrl (Cmd) + Z.
- To redo changes, click or press Ctrl (Cmd) + Shift + Z.
Fixes and improvements
Pivot table sorting
Fixed a row sorting issue for the pivot table. The issue occurred after editing a parameter in the calculated field of a column or row.
Date filtering in charts
Fixed the date filtering behavior in charts. Now, dashboard filters use by default the Equals comparison operation instead of Belongs to range for fields of the Date and Date and time types.
Other fixes and improvements
- Increased the number of dashboard tabs whose names are not truncated in the drop-down list.
- Increased the width of the default value setting window for the Calendar type selector.
- Fixed line sorting in descending order for negative values in tooltips.
- Fixed an error where the chart saving option was not available after adding/removing a tooltip to/from a table field in the wizard.
- Fixed a header display issue in Indicator type charts where the chart name was always substituted from the dataset field name.
- Fixed an interface display issue in tables occurring on selecting a palette in a linear indicator.
- Fixed a value loading error for chart color customization.
- Fixed a pagination error in the Pivot table type chart.
- Fixed tooltip display in the Checkbox type selector.
- Fixed incorrect chart rendering when the Empty values (null) parameter is set to
Do not show. - Fixed an issue where empty charts were invisibly overlapping the space below them on the dashboard.
- Fixed an error occurring on duplicating a dashboard from the navigation panel.
- Now, if you change field visibility () in the dataset field editor, an attempt to close the page will prompt an unsaved changes warning.
- Fixed the calculation of the Text widget minimum height with Auto height enabled.
- Fixed display of the tooltip input field in the selector settings window. It is now displayed only if the Tooltip option is enabled.
- Added a panel for migrating legacy dashboard configurations.
- Modified the navigation interface. Now, when you select multiple items from the navigation list for a bulk action, the icon at the top of the window gets hidden.
Mobile version updates
- The new menu at the top of the screen allows you to switch between navigation pages (Charts, Dashboards, and Collections and workbooks), change settings (language, theme), and contact support.
- You can now open a chart preview from the new Charts navigation page.
- Improved the Collections and workbooks navigation page.
- Improved the appearance of pages and windows with bigger font sizes and interface elements.
- Added a table of contents for dashboards.
- Clicking the Share button now opens the link settings window.