Yandex DataLens data types
DataLens uses multiple data sources whose fields may take different data types.
To streamline the data operations, DataLens converts the source data types to its native ones.
This optimizes data operations. Learn more in Database type and internal Yandex DataLens type mapping table.
You can change the field data type both in the dataset interface and in the wizard.
Warning
When you upload a CSV file as a data source, DataLens will try to automatically detect the types of data in its fields.
If DataLens is unable to identify the data type, it will set the String type for the field.
You can use the dataset interface or the wizard to change the field data type.
Geopoint
A geopoint is a coordinate point defined by latitude and longitude. In DataLens, you can set it using the GEOPOINT function.
At input, the function accepts the String and Geopoint data types, or two values of the Fractional number or String type.
If a single string is input, it must contain a list of two numbers in JSON format.
If the source data comes as a string in [55.75222,37.61556] format, you can use the dataset interface or wizard to change the field data type without using any formula.
Note
You can use ready-made geodata sets in DataLens format from Geointellect, our partner.
The archive contains the following data:
- Countries (polygons and points).
- Russian regions (polygons and points).
- Russian cities (points).
- Districts of million-plus cities (polygons).
Examples
GEOPOINT("[55.7912,37.6872]")
GEOPOINT("55.7912","37.6872")
GEOPOINT(55.7912, 37.6872)
Geopolygon
These are multiple coordinate points defining the polygon on the map. In DataLens, you create a geopolygon using the GEOPOLYGON function.
DataLens fills the polygon using the Even-Odd algorithm. This allows creating polygons with cutouts.
At input, the function accepts a string in [[[v1,v1], [v2,v2]], ..., [[vN-1,vN-1], [vN,vN]]] format. If the source data is in this format, you can use the dataset interface or wizard to change the field data type without any formula.
Note
You can use ready-made geodata sets in DataLens format from Geointellect, our partner.
The archive contains the following data:
- Countries (polygons and points).
- Russian regions (polygons and points).
- Russian cities (points).
- Districts of million-plus cities (polygons).
Example notation
/* Polygon without a cutout */
GEOPOLYGON("[[[55.79421,37.65046],[55.79594,37.6513],[55.79642,37.65133],[55.7969, 37.65114],[55.79783, 37.65098],[55.78871,37.75101]]]")

/* Polygons with a cutout */
GEOPOLYGON("[[[55.75,37.52],[55.75,37.68],[55.65,37.60]],[[55.79,37.60],[55.76,37.57],[55.76,37.63]]]")
GEOPOLYGON("[[[55.75,37.50],[55.80,37.60],[55.75,37.70],[55.70,37.70],[55.70,37.50]],[[55.75,37.52],[55.75,37.68],[55.65,37.60]],[[55.79,37.60],[55.76,37.57],[55.76,37.63]]]")
Date
Date without time.
In formulas, use # (hash) for date, e.g., DATETRUNC(#2018-07-12#, "year", 5).
You can convert the source data type to Date using the DATE and DATE_PARSE functions.
Example notation
#2018-01-18#
#2015-01-01#
DATETRUNC(#2018-07-12#, "year", 5)
DATEADD(#2018-01-12#, "day", 6)
Date and time (deprecated)
Date with time specified (time converted to UTC).
In formulas, use # (hash) for date and time, e.g., DATEADD(#2018-01-12 01:02:03#, "second", 6).
You can convert the source data type to Date and time (deprecated) using the DATETIME and DATETIME_PARSE functions.
Example notation
#2018-01-12 01:08:03#
#2018-05-01T#
DATEADD(#2018-01-12 01:02:03#, "second", 6)
DATETRUNC(#2018-07-12 11:07:13#, "month", 4)
Discontinuing the date and time (deprecated)type
-
Starting September 6, 2022, you can use the new Date and time type, without conversion to UTC.
-
October 12, 2022:
- In all datasets, the fields of the
Date and time (deprecated)type will be replaced with fields of theDate and timetype. - Using
#will no longer convert constant values to UTC. - The DATETIME and DATETIME_PARSE functions will no longer convert expressions to UTC.
- In all datasets, the fields of the
Date and time
Date with time specified (without converting time to UTC).
Note
Field selectors with this type are always in line with the time zone of the data source regardless of the field time zone.
In formulas, use ## (double hash) for date and time, e.g., DATEADD(##2018-01-12 01:02:03##, "second", 6).
You can convert the source data type to Date and time using the DATETIME and DATETIME_PARSE functions.
Example notation
##2018-01-12 01:08:03##
##2018-05-01T##
DATEADD(##2018-01-12 01:02:03##, "second", 6)
DATETRUNC(##2018-07-12 11:07:13##, "month", 4)
Floating-point number
This is a decimal number, with a period as a separator.
You can convert the source data type to Floating-point number using the FLOAT function.
Warning
When you convert the decimal type to a Fractional number, you may lose accuracy.
Example notation
1.47113
0.62024
FLOAT("34.567")
Boolean
The boolean type can take one of two possible values: TRUE or FALSE.
You can convert the source data type to Boolean using the BOOL function.
Example notation
FALSE
String
This is a string containing text, enclosed in single or double quotes.
If you enclose your string in one type of quotes, you can use the second quote type inside the string without escaping.
For example, 'Double quoted "example" and one " double quote.'
You can use the following characters inside strings:
\n: Line feed (LF)\r: Carriage return (CR)\t: Tab\": Double quote\': Single quote\\: Backslash
You can convert the source data type to String by using the STR function.
Example notation
"String"
'String with a "substring"'
Integer
This is a number without any fractional part.
You can convert the source data type to Integer by using the INT function.
In DataLens, the maximum size of the Integer type is limited by the maximum integer for the Number JavaScript type: 253 == 9,007,199,254,740,991.
Example notation
42
157
Array
An array is a structure made up of a series of elements of the same type.
DataLens supports processing columns in one-dimensional arrays for ClickHouse® and PostgreSQL. Array elements can have the following types:
IntegerFractional numberString
You can define an array in DataLens using the ARRAY function.
Example notation
[1, 2, 3]
[1.1, 1.2, 1.3]
["Cheese", "Bread"]
Tree of strings
DataLens allows you to create tree hierarchies. To do this, use the Tree of strings field type. The data is stored as an array with a full path for each node. The sequence of array values determines the order the tree is expanded.
Note
A tree can only be used in a Table chart.
Creating a tree
To create a tree, add a calculated field at the dataset or chart level using the TREE(ARRAY([lev_1],[lev_2],[lev_3],[lev_n])) formula, where [lev_1], [lev_2], [lev_3], and [lev_n] are dataset fields defining the tree hierarchy.
Example of creating a tree for a source DB containing no data array
-
Prepare data in the source:
-
Create a table with columns containing hierarchy values.
Example of creating a table in PostgreSQL
CREATE TABLE table_without_tree ( id serial primary key, country text, region text, city text ); -
Add data with a full path for each tree node to the table.
Example of adding data to PostgreSQL
INSERT INTO table_without_tree (country, region, city)
VALUES('Russia', 'Altay', 'Barnaul');

INSERT INTO table_without_tree (country, region, city)
VALUES('Russia', 'Altay', 'Biysk');

INSERT INTO table_without_tree (country, region, city)
VALUES('Russia', 'Altay', 'Aleisk');
-
-
Create the following in the dataset:
-
Array of strings type calculated field describing the tree, e.g., the
positionfield with theARRAY([country], [region], [city])formula. -
Tree of strings type calculated field, e.g., the
hierarchyfield with theTREE([position])formula, wherepositionis an Array of strings type field describing the tree.Tip
You can combine array and tree of strings in the same field with the
TREE(ARRAY([country], [region], [city]))formula.
-
Example of creating a tree for a source DB that contains an array of data
-
Prepare data in the source:
-
Create a table with an array of strings.
Example of creating a table in PostgreSQL
CREATE TABLE table_with_tree ( id serial primary key, position text[] ); -
Add data as an array with a full path for each tree node to the table.
Example of adding data to PostgreSQL
INSERT INTO table_with_tree (position)
VALUES('{"Russia","Altay","Barnaul"}');

INSERT INTO table_with_tree (position)
VALUES('{"Russia","Altay","Biysk"}');

INSERT INTO table_with_tree (position)
VALUES('{"Russia","Altay","Aleisk"}');
-
-
In a dataset, create a Tree of strings type calculated field, e.g., the
hierarchyfield with theTREE([position])formula, wherepositionis an Array of strings type field describing the tree.
Using trees in charts
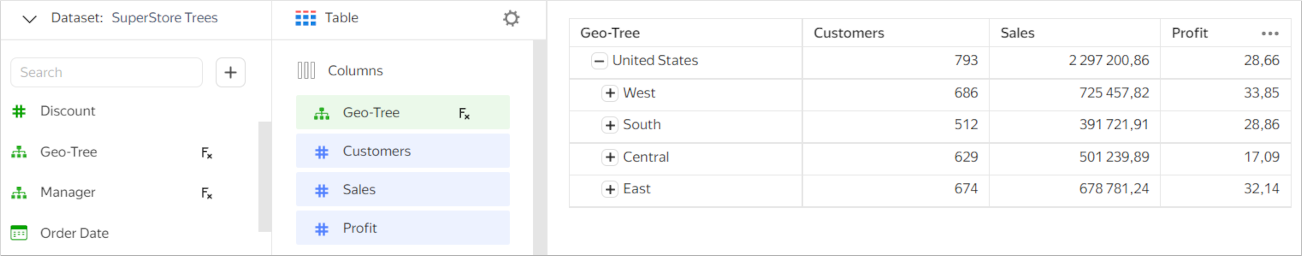
You can use the prepared source data to create a tree in a Table chart:
-
Create a Table chart.
-
Drag a dimension with the Tree of strings type to the Columns section. You will see a tree hierarchy in the visualization area. Expand or collapse the tree using + or -, respectively.
Note
You can only use tree dimensions in the chart.
-
Add the required measures to the Columns section.
Limitations
Currently, tree hierarchies have the following limitations:
- You can use one tree or hierarchy per chart.
- You cannot use the Pagination option and Total row in a tree table.
- The tree expansion state is not remembered.
- Selectors do not support trees.
- The source should store intermediate tree nodes, even those with no data available.
ClickHouse® is a registered trademark of ClickHouse, Inc.