Yandex DataLens release notes: October 2025
Changes in basic features
-
Added connection versioning. You can now view a list of previously saved connection changes and roll back to a previous version.
The following limitations apply:- Versioning is not available for the following connections: Files, Yandex Documents, and Google Sheets.
- Sensitive connection data, such as passwords and tokens, is not versioned.
- Connection versions do not contain the source data changes (rows added, updated, or deleted in the data source).
- You can only get change history for the last three months.
-
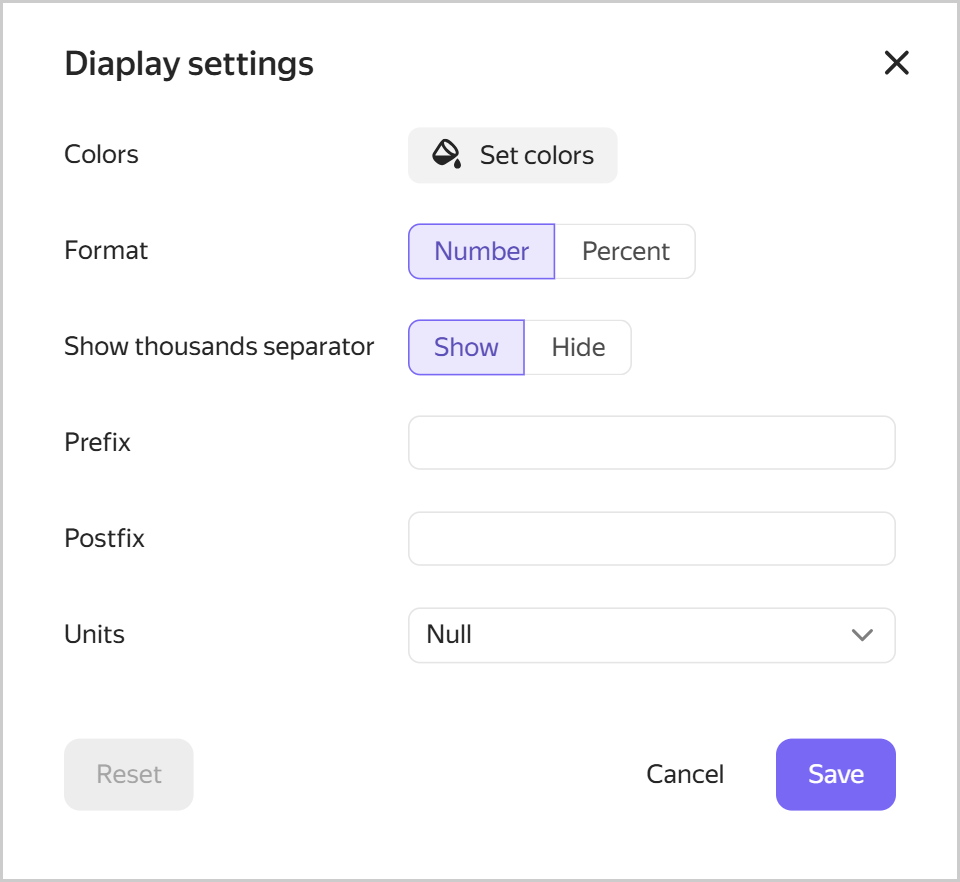
Added the option to set up field display in the dataset. For dimensions, you can choose a color and set a display format for numeric types; for measures, you can only set a display format for numbers. These settings apply when you use these fields in charts built based on this dataset.
Field display settings
-
Added the ability to select a default palette in the chart color settings.
-
The chat with support can now be opened directly from the Yandex DataLens interface. To open the chat, click on the sidebar and select Open chat under Support.
-
New works available in DataLens Gallery. For more information, see the DataLens Telegram chat.
Changes in the interface
-
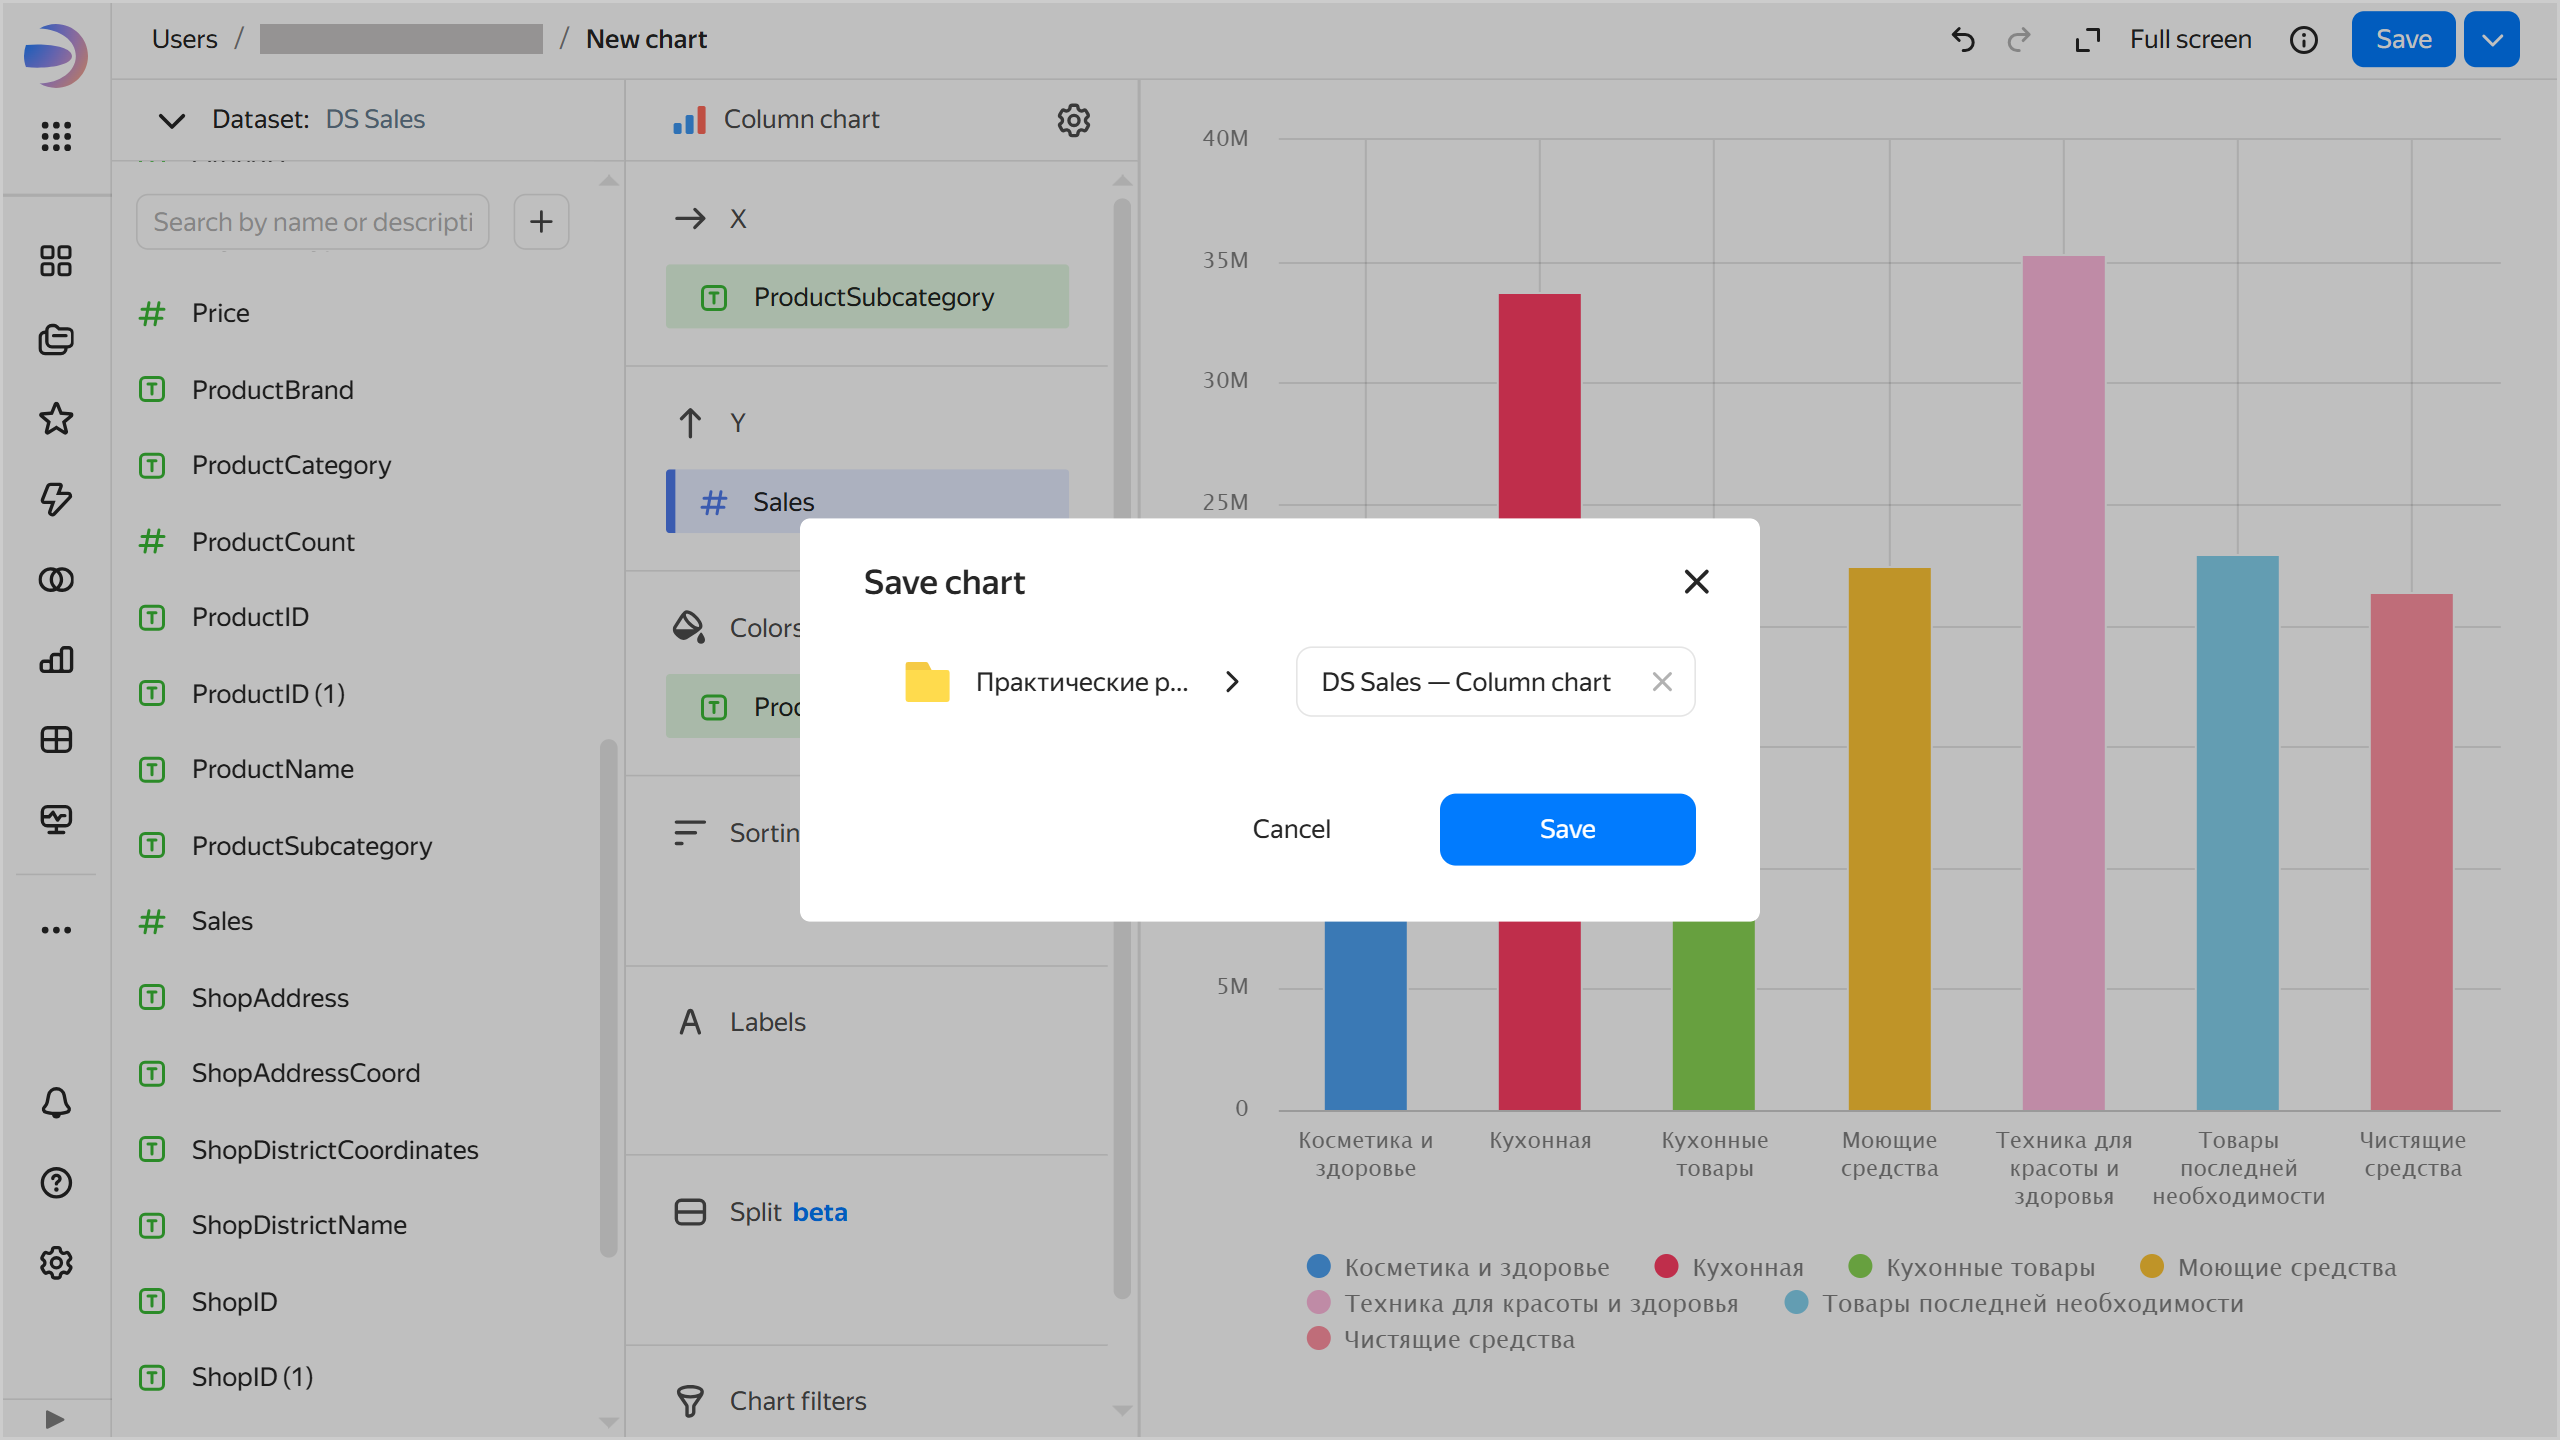
The confirmation button was made more visible in the dialog box for creating, saving, and duplicating entities in folder navigation.
Saving a chart
-
Added contrast to the background color of the dashboard and widget pinning area.
-
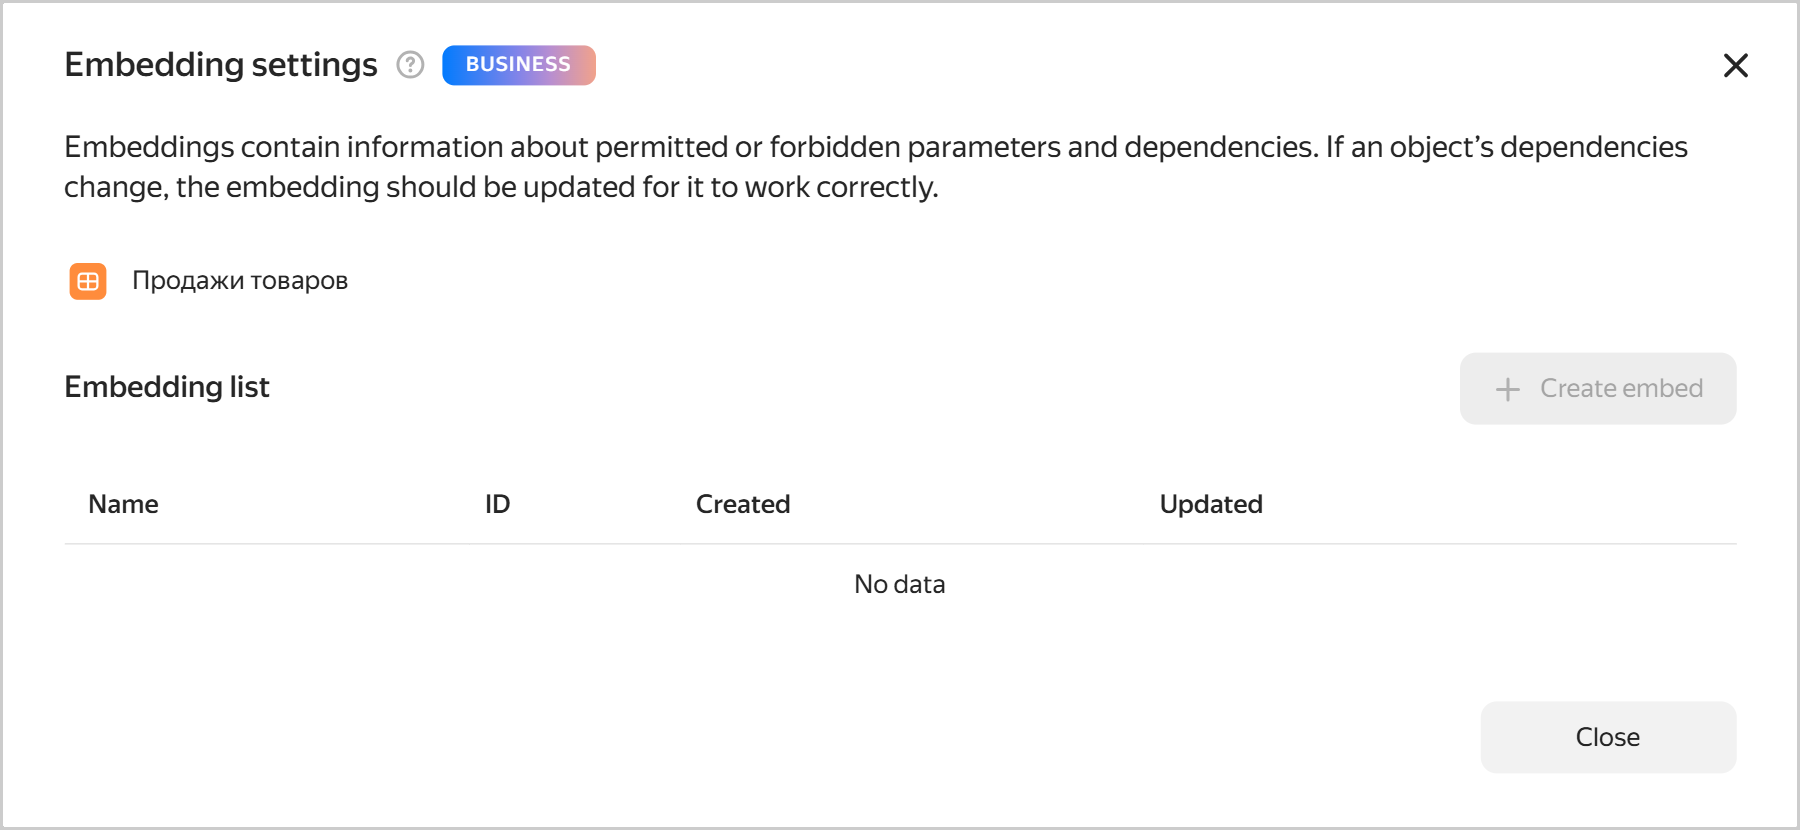
For private object embedding, highlighted the info that the functionality is available in the Business service plan to the settings window.
Embedding settings
Mobile version updates
- Added a widget pinning area to the dashboard.
- Viewing dashboard contents and descriptions, as well as the button, are now available in the panel at the bottom of the screen.
Fixes and improvements
-
Implemented the
_autoupdateparameter for private embedding, which allows you to manage the auto-update of charts and dashboards. -
For charts and dashboards, fixed the issue of opening the embedding settings in the side navigation. To open the settings, click Charts or Dashboards in the sidebar and click → Embedding settings in the row with the object.
-
Fixed the display of totals in the Waterfall chart tooltip (Gravity UI Charts).
-
Fixed an error when exporting data from a chart to an
XLSXfile, where theDate and timecolumn displayed the export date instead of the Total.
Fixes in charts
- Disabled sorting for multi-dataset charts.
- Fixed the undo changes button operation when changing chart type to combined chart.
- In the table and pivot table, fixed the colors of fields with the default palette.
- Fixed the display of an indicator, which uses markup functions along with some other functions.
- In the pivot table, fixed the display of markup functions in the totals.
- For tables with trees, fixed the display of query info in the inspector.
Fixes in workbooks
- Added sorting by creation date and name in the object selection dialog in the workbook, when adding a chart or selector to a dashboard.
- When importing a workbook, the list of workbooks is now updated after you close the progress window.
- Added the option to delete a workbook during its creation (a workbook with the
Importingstatus). In which case the workbook creation page will display an error.
Error handling
-
Fixed the
Minified errorthat occurred when using the dashboard in some browsers. -
Fixed an error that occurred when editing a calculated field formula in a chart with grouping already added.
-
Fixed the display of validation errors when creating a connection.
-
The error when attempting to create a workbook or collection with an existing name is now displayed more clearly and in the language configured by the user.
-
Added a handling action for the error when attempting to deploy a workbook with invalid data from the gallery. Now you get a message with a recommendation to contact support.
Changes available with the Businessservice plan
- Fixed incorrect collapsing of the AI chat in the Safari browser.
Setting up an AI prompt
Now you can set up a custom AI prompt. To do this, follow these steps:
-
Click Settings in the left part of the navigation panel to open the settings.
-
Go to the AI settings tab.
AI settings
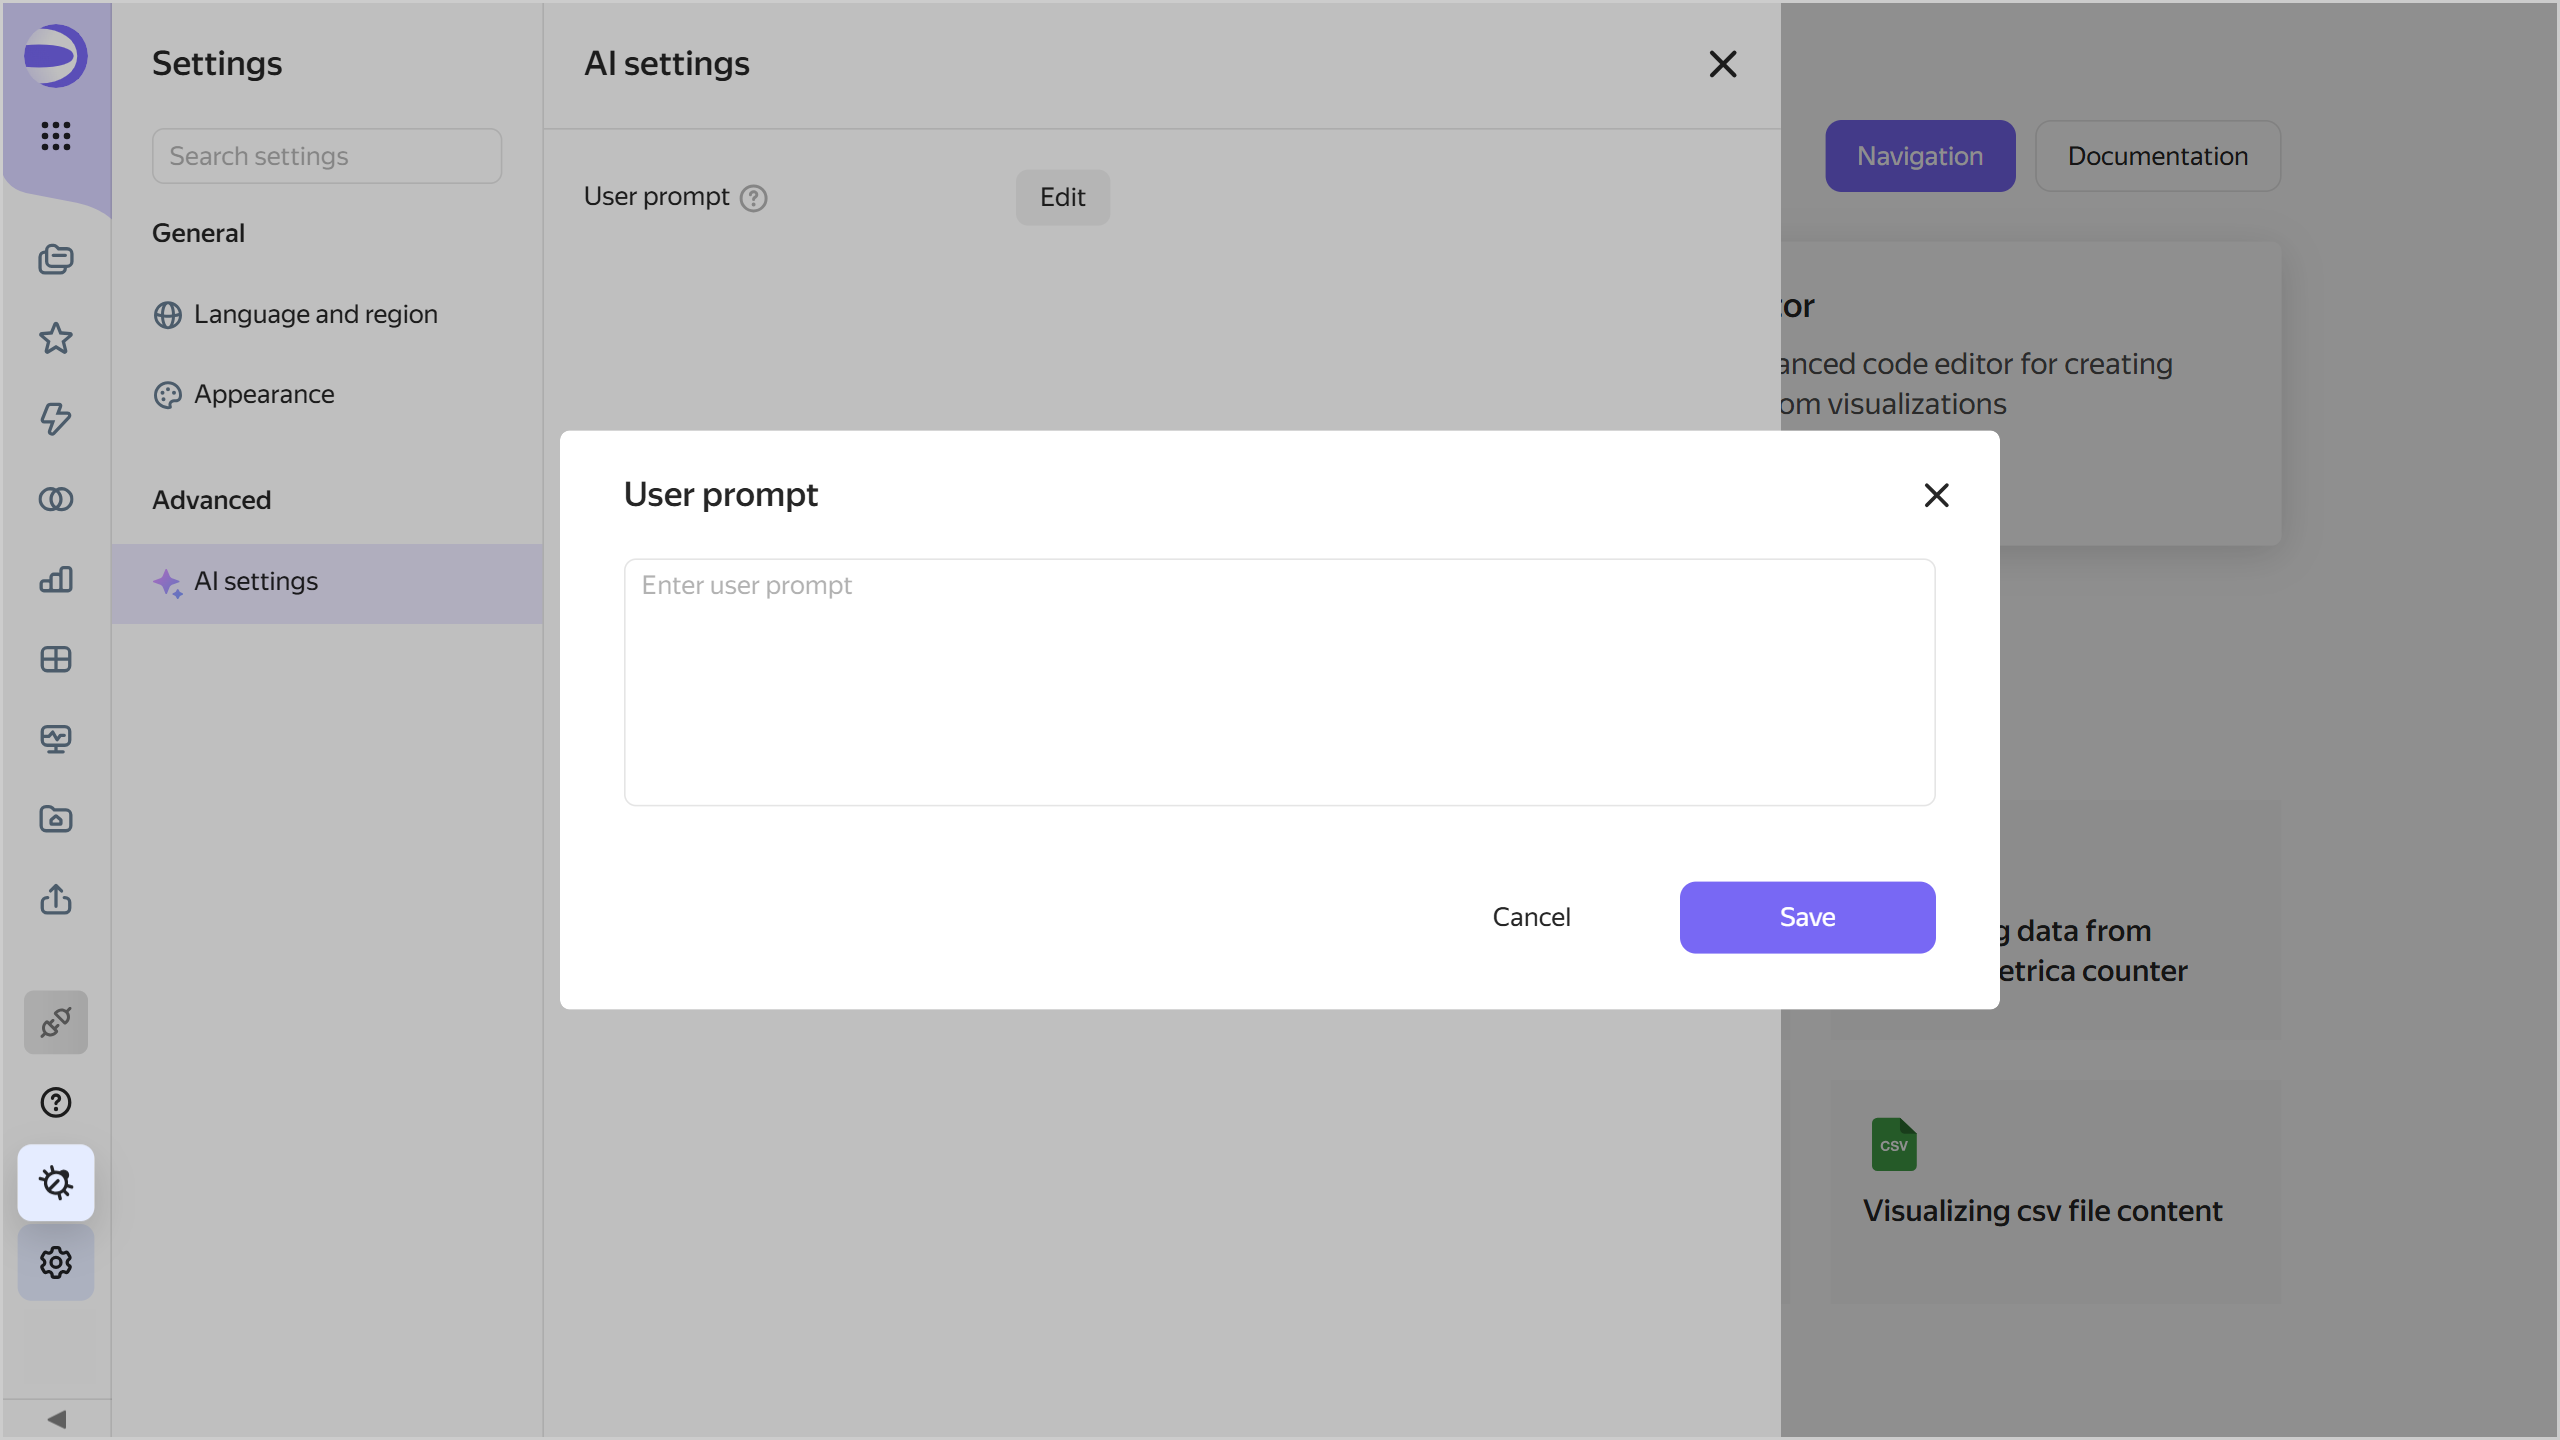
-
Click Edit.
-
Enter a prompt in the text field and click Save. Text length: up to 2,000 characters.
With each request to the AI, the custom prompt will be added to the DataLens system prompt.
Examples of user prompts for the AI
- For the subject area:
Note that this data is related to food production - For the user role:
Answer me as a marketing expert - For interpretation of measures and data:
MAU: Always counted by the number of unique users, not client companies