Yandex DataLens release notes: August 2026

Changes in basic features
-
Updated Neuroanalyst on dashboards. To answer a question, Neuroanalyst uses existing charts from the whole dashboard, and if there are no suitable ones, it analyzes datasets and builds a new chart in the wizard.
Now Neuroanalyst:
- Analyzes all the dashboard charts, including all its tabs and widget tabs. The current dashboard tab is prioritized over others.
- Works in agent mode: it can analyze current charts and build a new chart based on resulting data.
- Does not require you to specify a reference tab.
When using Neuroanalyst, you can:
- Ask it to create a chart of the type you prefer.
- Add the new chart to the dashboard right away.
- In the dashboard settings, specify examples of question you want displayed in the Neuroanalyst chat by default.
-
Updated the Insight widget:
- You can specify up to five charts from the current dashboard tab in one insight. With Neuroanalyst, you can discover data relationships not visible in individual charts.
- There is an action bar at the bottom of the widget. You can use it to evaluate the widget, copy the content of the insight to the clipboard, or refresh Neuroanalyst’s response.
- If you hover over the widget, in the top-right corner, you will see an action menu where you can copy the content of the insight to the clipboard or refresh Neuroanalyst’s response.
-
Added mailing lists for reports in workbooks. You can set up a mailing list for a report. The email will deliver a
.pdffile containing the report pages you specify in the mailing list settings. You can set up the schedule and your mailing list recipients. -
Implemented recovery of deleted objects.
- A user with the Editor role for a workbook can restore its deleted objects, such as connections, datasets, charts, dashboards, reports, or HTML pages.
- An administrator (user with the
datalens.adminrole) can look up the list of deleted objects (connections, datasets, charts, dashboards, reports, and HTML pages) and workbooks in the settings and restore them. - You cannot restore objects deleted from directories.
-
Added the ability to work with input forms directly on the dashboard:
- In API Connector, supported the
PUT,PATCH, andDELETErequests which you can use to add, edit, or delete records. - Added a new action called
dialogfor the Activities tab to overlay the chart with a modal form with text and numeric fields, selects, checkboxes, and radio buttons. Once the form is sent, you can refresh the chart or run the next action with the values you entered.
Now you can:
- Add comments and statuses to data, initiate approvals and other team processes.
- Edits your references and plans without exiting DataLens.
- Set up integration with external systems via any API.
- In API Connector, supported the
-
Updated the role model in DataLens.
For more details, go to a convenient platform:
-
Updated the row-level security (RLS) interface:
-
Now you can configure access to rows from the interface by selecting who to give permission:
Users and groupsto grant access to specified users and groups. You can use search by name, login, or email.All usersto grant access to all users.User IDsto control access at data source level if your RLS logic operates on the source side.
-
You can also set up a configuration in JSON format.
-
-
Added new creations to the Gallery. For more information, see the DataLens chat in Telegram.
Added a creation with a ready-made dashboard that takes issues directly from your queue via API Connector and sorts them into categories. For more about DataLens integration with Yandex Tracker, see this Telegram chat.
Fixes and improvements
-
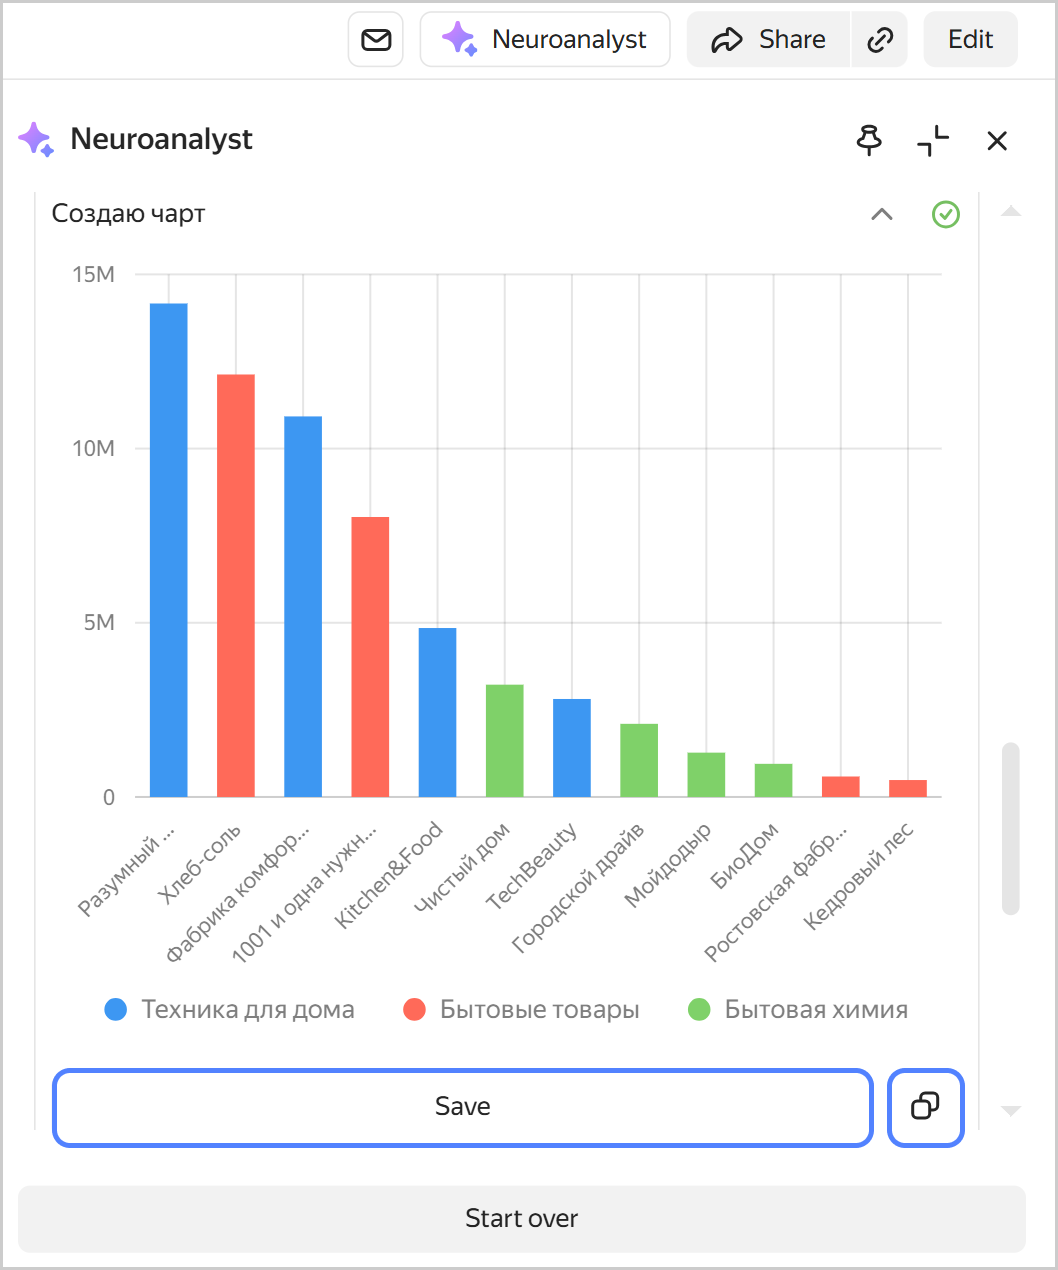
Now, after Neuoranalyst has built a chart, you will see save and copy to clipboard buttons under it:
- You can save the chart in your current workbook.
- You can paste a copied chart into a dashboard or report. Copying is available after you save the chart.
Chart building by Neuroanalyst
Fixes in datasets
- For charts in the wizard and QL charts, fixed the processing of
Date-type dataset fields. Now, dataset parameters of this type are truncated from theDate and timeformat to theDatetype before they reach the source.
Fixes in reports
- Fixed the presentation format report preview error where scrolling did not appear in widgets.
- Hid widget tooltips in document format preview window and when exporting a report to a
.pdffile. - Introduced optional pagination for tables during presentation format preview.
Dashboard fixes
- Fixed the issue where it was impossible to switch to different dashboard tabs on on iPad models.
- In the selector group dialog, fixed the issue where the Selector type field showed a value not matching the selector type on the dashboard.
- Restored the ability to use different selectors based on a single dataset field. Do it by disabling the Apply button in the widget settings; otherwise, only one value will be applied.
Fixes in charts
- In the Funnel chart, fixed incorrect behavior of fields in the Signatures section.
- Fixed incorrect navigation in tables with hierarchy.
- In charts with hierarchy, fixed an error which occured on switching to the
NULLvalue. - Fixed the display of column charts with sorting and grouping by color.
Changes in Editor
- Fixed incorrect display of tables in the Firefox browser.
- Fixed the error of opening a chart for editing from the dashboard with many parameters (more than 20) in the selector.