Yandex Cloud
Search
Discuss with expertTry it for free
  • Customer Stories
  • Documentation
  • Blog
  • All Services
    • Cloud Interconnect
    • Cloud Backup
    • Cloud Registry
    • Yandex AI Studio
    • Compute Cloud
    • Object Storage
    • Managed Service for Kubernetes®
    • Yandex BareMetal
    • Smart Web Security
    • Security Deck
    • Managed Service for PostgreSQL
    • Managed Service for ClickHouse®
    • Monium
    • Cloud CDN
    • Network Load Balancer
    • Virtual Private Cloud
    • Cloud DNS
    • Application Load Balancer
    • Yandex Cloud Video
    • Stackland
    • Yandex Cloud Router
    • Yandex Managed Service for Trino
    • Managed Service for MySQL®
    • Managed Service for Valkey™
    • Managed Service for Apache Spark™
    • Yandex StoreDoc
    • Managed Service for OpenSearch
    • Managed Service for Apache Kafka®
    • Data Transfer
    • Yandex MPP Analytics Engine for PostgreSQL
    • Yandex Managed Service for Apache Airflow®
    • Data Processing
    • Yandex MetaData Hub
    • Managed Service for YDB
    • Managed Service for Sharded PostgreSQL
    • Managed Service for YTsaurus
    • Yandex WebSQL
    • DataLens
    • Yandex Search API
    • SpeechSense
    • SpeechKit
    • DataSphere
    • Vision OCR
    • Translate
    • Yandex Identity Hub
    • Key Management Service
    • Certificate Manager
    • Yandex Lockbox
    • Audit Trails
    • SmartCaptcha
    • Cloud Desktop
    • SourceCraft Code Assistant
    • Container Registry
    • Managed Service for GitLab
    • Managed Service for Prometheus®
    • Cloud Functions
    • API Gateway
    • Yandex Cloud Postbox
    • Message Queue
    • Serverless Integrations
    • IoT Core
    • Data Streams
    • Serverless Containers
    • Cloud Notification Service
    • Yandex Query
    • Identity and Access Management
    • Yandex Cloud Console
    • Resource Manager
    • Yandex Cloud Billing
    • Yandex Cloud Quota Manager
    • Cloud Apps
  • System Status
  • Marketplace
    • Featured
    • Infrastructure & Network
    • Data Platform
    • AI for business
    • Security
    • DevOps tools
    • Serverless
    • Monitoring & Resources
  • All Solutions
    • By industry
    • By use case
    • Economics and Pricing
    • Security
    • Technical Support
    • Start testing with double trial credits
    • Cloud credits to scale your IT product
    • Gateway to Russia
    • Cloud for Startups
    • Center for Technologies and Society
    • Yandex Cloud Partner program
    • Price calculator
    • Pricing plans
  • Customer Stories
  • Documentation
  • Blog
© 2026 Direct Cursus Technology L.L.C.
Yandex DataLens
  • DataLens neuroanalyst
    • Overview
      • Overview
      • Chart settings
      • Measure Values and Measure Names
      • Multi-dataset charts
    • Adding chart info
    • Opening a chart as a table
    • Saving a chart as an image
    • Versioning
    • Exporting data from charts
    • Chart inspector
    • Access management
  • Gallery in DataLens
  • Audit Trails events
  1. Charts
  2. Wizard charts
  3. Overview

Yandex DataLens wizard charts

Written by
Yandex Cloud
Updated at July 17, 2026
View in Markdown

The wizard is a constructor where you create new charts based on data from one or more datasets (for details, see Multi-dataset charts). You can create an unlimited number of charts based on a single dataset.

Note

​To view the text of an SQL query from your chart to the data source, click in the top-right corner of the chart and select Inspector. You can find the query text in Data sources → Query to data source. For more information, see Chart inspector in Yandex DataLens.

Charts allow you to quickly analyze and test hypotheses. You can also save charts and add them to dashboards as widgets.

Warning

DataLens limits the number of data rows displayed in charts. For more information, see Yandex DataLens quotas and limits.

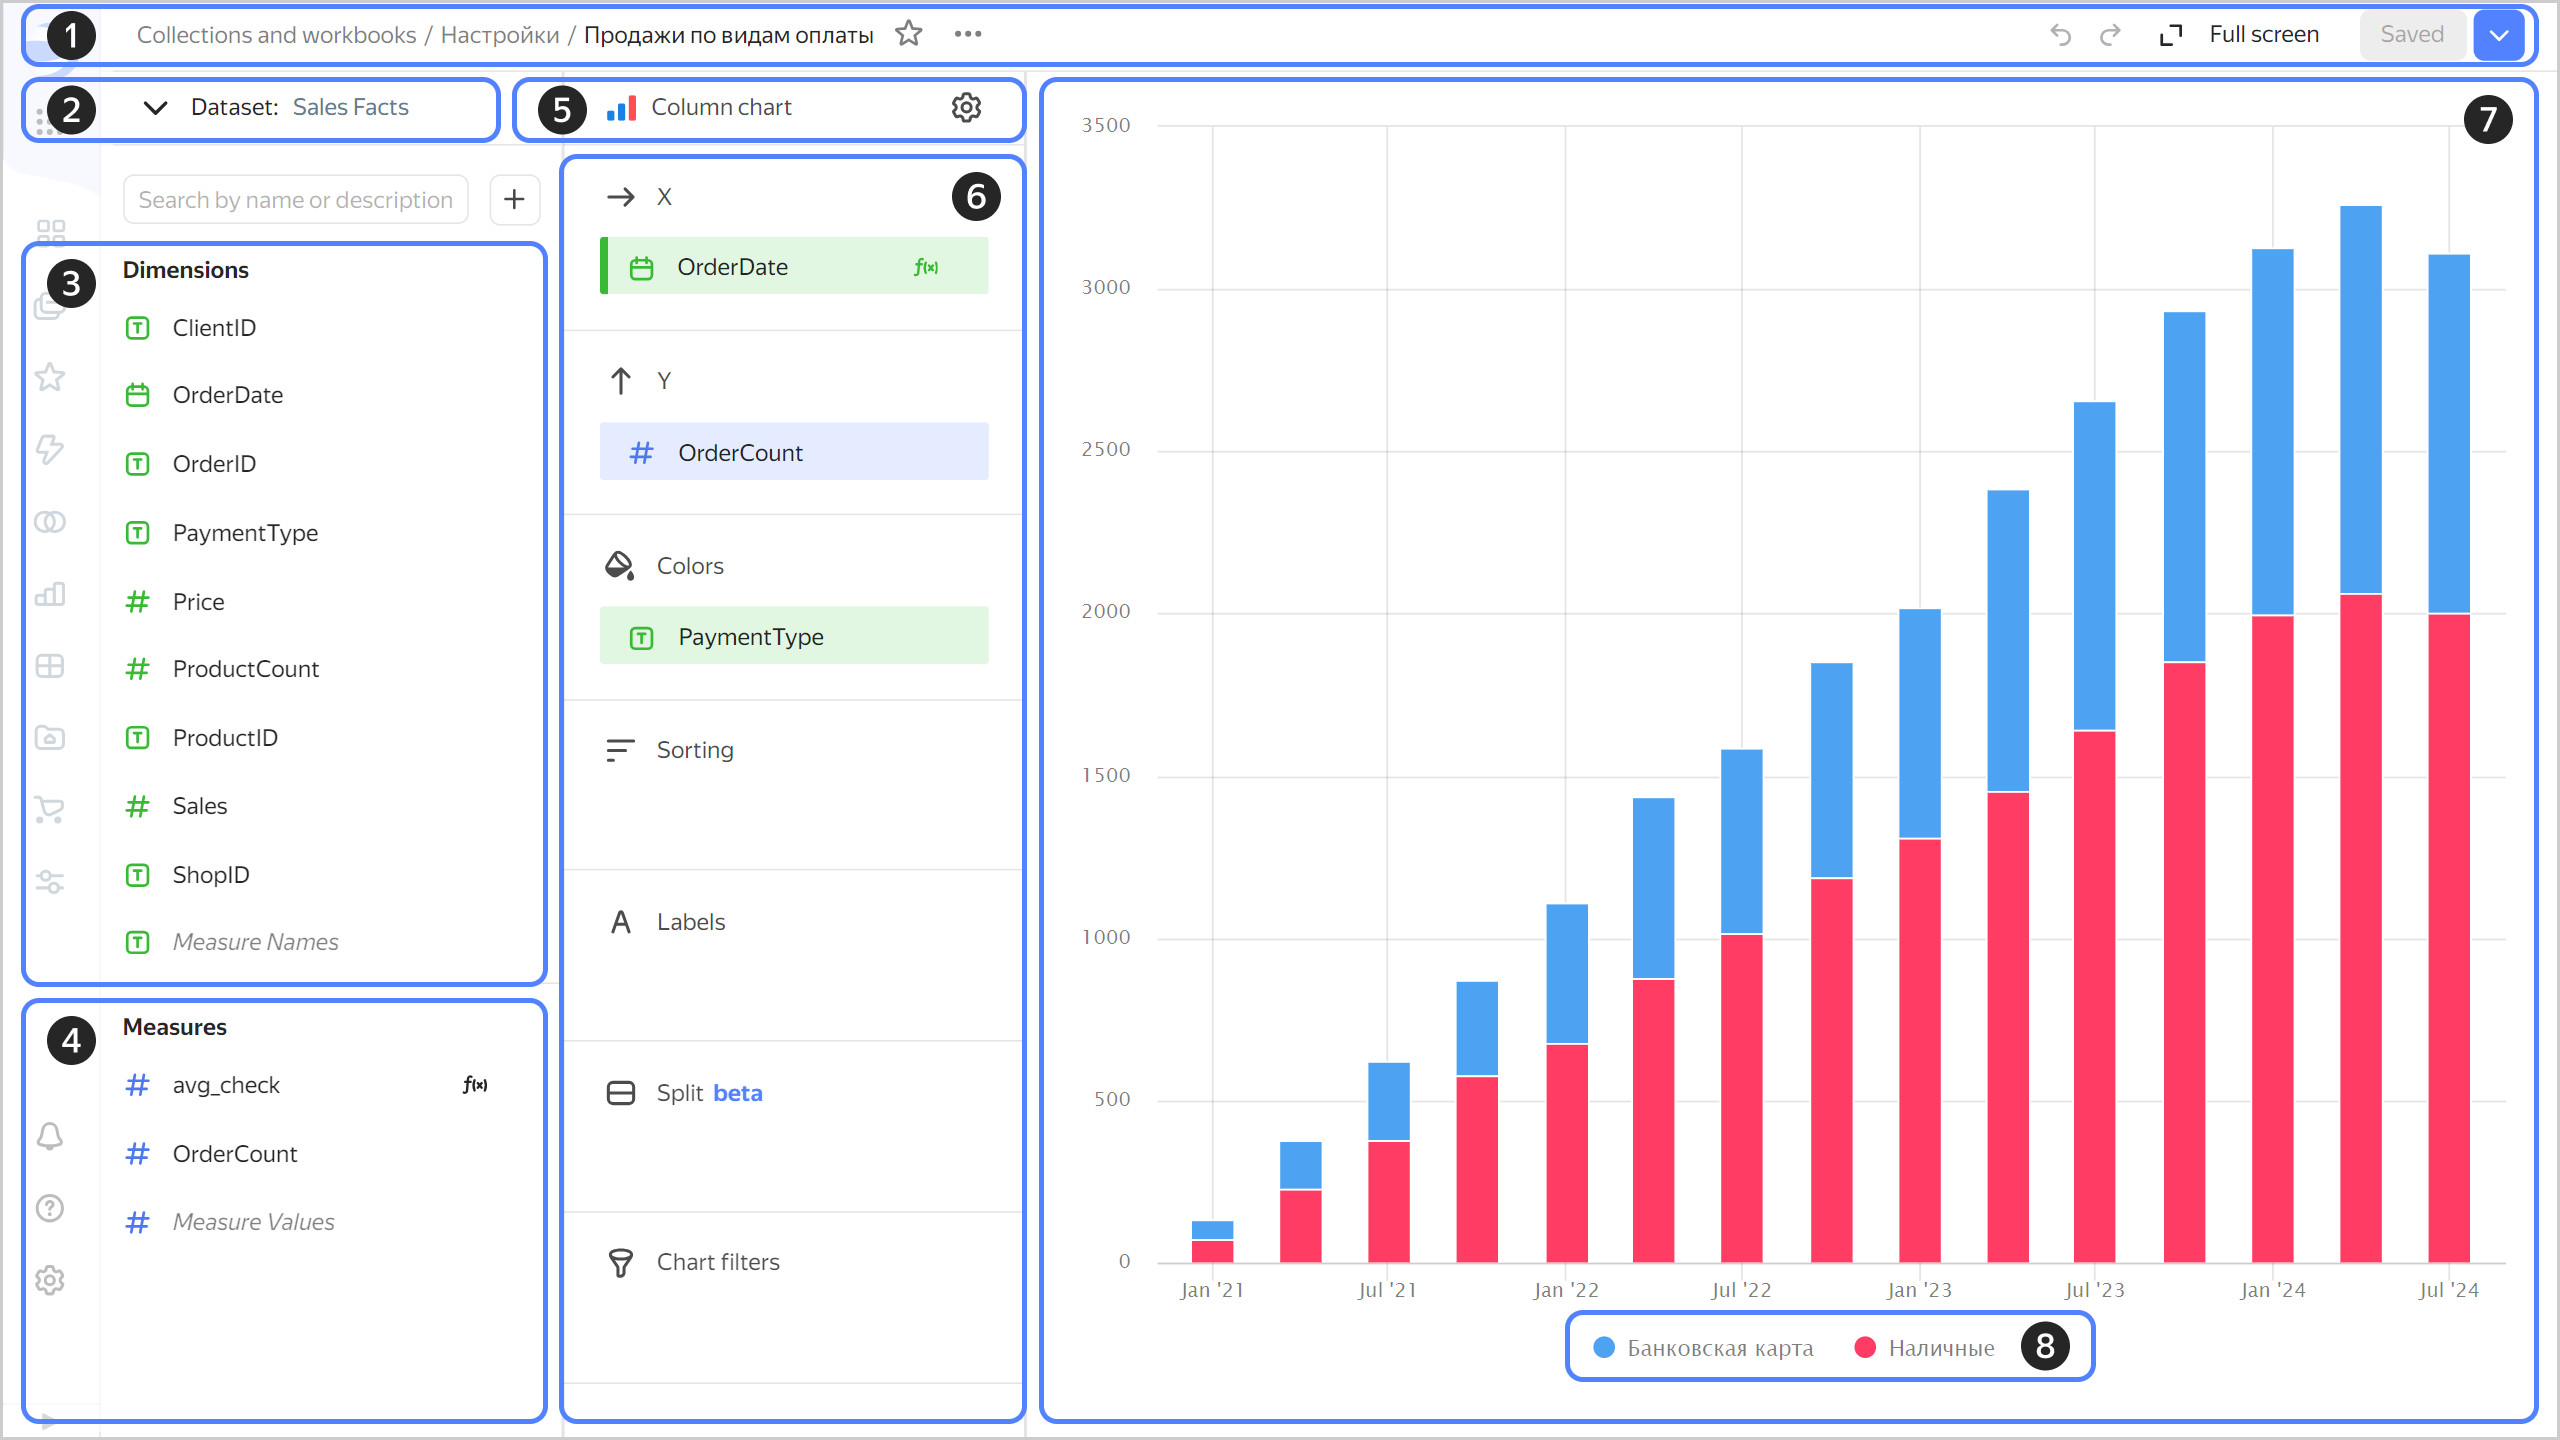
The wizard UI has the following elements:

  1. At the top, you can see general information, such as the chart path and the elements for managing and saving a chart, common for all charts.
  2. At the bottom, you can select a dataset to build a chart from. Once you select a dataset, you will see a list of fields you can use in the chart.
  3. Dataset dimensions you can use to build your chart. You can also add a calculated field to this list.
  4. Dataset measures you can use to build your chart.
  5. Chart type selection button and the icon to open the general settings.
  6. List of sections. The available sections depend on the selected chart type, e.g., X axis, Y axis, filters, etc. You can drag and drop fields in a section.
  7. Preview area where the visualization is displayed. You can select multiple elements to view in graphs and charts by holding the Ctrl key.
  8. Chart legend. The legend maps the chart colors to the field values in the Colors section. By clicking individual legend elements, you can change the data display in the chart. You can select multiple legend elements by pressing and holding Ctrl/Cmd. You can enable and disable the legend in the chart settings.
image

Was the article helpful?

Previous
Overview
Next
Chart settings
© 2026 Direct Cursus Technology L.L.C.