Yandex DataLens release notes: October 2024
- Changes in basic features
- Copying links together with a widget
- Widget size on a dashboard
- Chart tooltips
- Disabling links on a dashboard
- Dashboard auto-scroll
- Fixes in workbooks
- Selector comparison operations
- Displaying X and Y axes in charts
- Line chart improvements
- Point coloring in scatter charts
- Fixes in indicatorQL charts
- Displaying layers in maps
- Fixes in tables
- Disabling row sorting in pivot tables
- Displaying linear indicators
- Displaying combined charts with a hierarchy
- Changes in the text toolbar
- Changes available with the Businessservice plan
Changes in basic features
Copying links together with a widget
Now a widget you copy retains its links if you paste it to the same dashboard tab. This option is not available when adding a selector to a group.
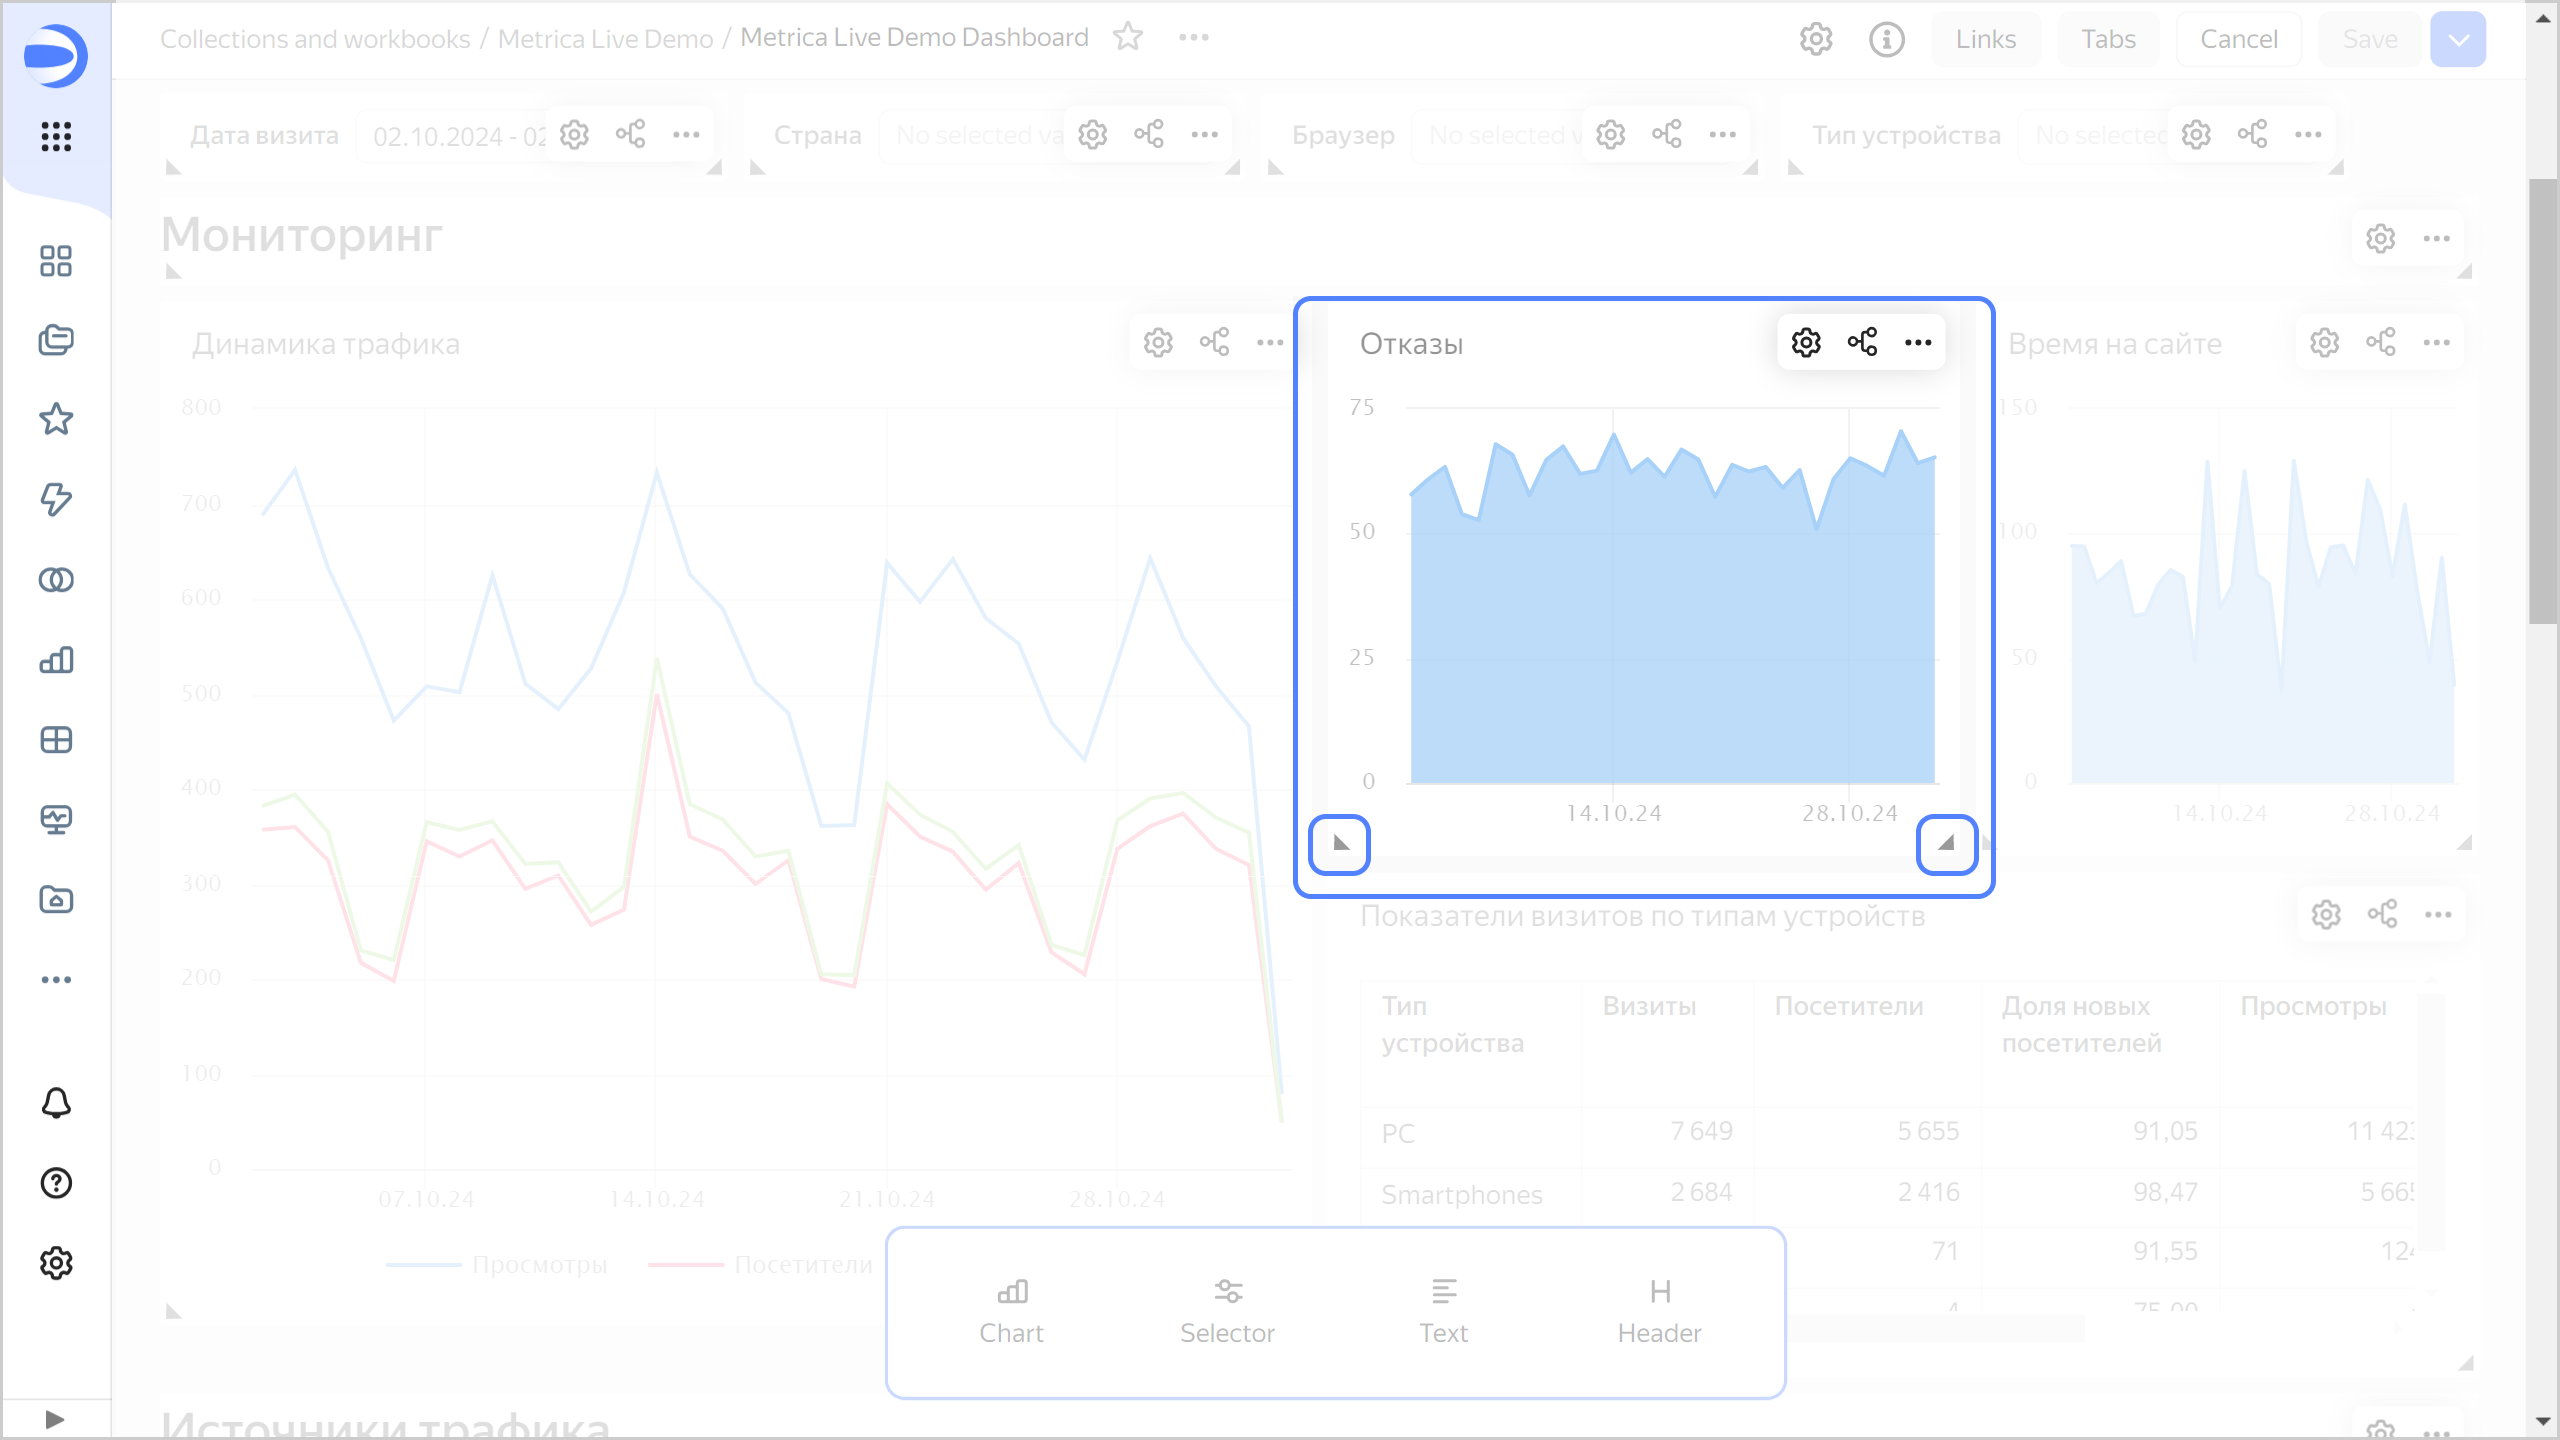
Widget size on a dashboard
You can now resize widgets on a dashboard by dragging their bottom corners.

Chart tooltips
- Added the Tooltip setting in charts which enables and disables on-hover tooltips for chart elements.
- Added settings for customizing tooltip display in maps.
Disabling links on a dashboard
Fixed an issue where clicking Disable → all/charts/selectors would reset link parameters not yet applied.
Dashboard auto-scroll
- Fixed page auto-scroll when dragging dashboard items in edit mode.
- Fixed the dashboard auto-scroll issue in mobile
Safaribrowsers when switching from chart view mode back to the dashboard.
Fixes in workbooks
- Hid the malfunctioning Request permissions button for objects in workbooks the user has no access to.
- Fixed an error where the workbook window displayed connections instead of charts, and vice versa.
Selector comparison operations
Added such comparison operations as Greater than, Less than, Greater than or equal to, and Less than or equal to for the Input field selector that filters by dataset text field.
Displaying X and Y axes in charts
Added the Axis on chart setting enabling users to hide all elements associated with the X and Y axes. This feature is available for wizard charts and QL charts.
Line chart improvements
The following features are now available in line charts:
- Continuous axis.
- Sorting by measure when the Colors section specifies a dimension.
Point coloring in scatter charts
Fixed the issue with point coloring in scatter charts after renaming fields.
Fixes in indicatorQL charts
- Fixed QL chart rendering issues when updating the list of fields.
- Fixed an error where the selection list in the dashboard link creation window showed invalid aliases for QL charts.
Displaying layers in maps
Fixed an error where layers in older or outdated maps were displayed incorrectly.
Fixes in tables
Fixed the following errors in tables:
- Incorrect application of color and gradient fill in null table cells.
- Incorrect rendering of QL chart tables with no data.
- Errors in calculating column width for tables with a large number of rows.
- Errors in calculating column width for cells with markup functions.
- Incorrect sorting of dates with null values.
- Table display errors when pinning more than one column.
- Browser freezing when scrolling a table.
- Duplicate table content when selecting the whole page.
Disabling row sorting in pivot tables
Added the option to disable row sorting in pivot tables.
Displaying linear indicators
Fixed linear indicator display issues:
- In manually scaled tables.
- In tables with column fill.
Displaying combined charts with a hierarchy
Fixed the rendering of combined charts with a hierarchy and continuous axis.
Changes in the text toolbar
In the toolbar of the text editing window:
- Fixed the display of commands when pressing
/. - Restored the display of buttons for adding formulas.
- Added the Mermaid button for
Markdown markupmode.
Changes available with the Businessservice plan
Changes in reports
-
Improved report export:
- Exported report files now have the same names as objects in DataLens.
- Optimized the size of exported
pdffiles. - Pages of exported
pdffiles are now sized to theA3/A4dimensions. - Fixed rendering issues for exported
pdffiles. - Fixed the order of layers in
pdffiles.
-
Added a confirm box when exiting the report editing interface with unsaved changes.
-
Updated the minimum dimensions for the
Imagewidget. -
Report and dashboard options are now listed next to each other in the object creation menu on a workbook page.
-
Added the option to migrate a report to a workbook.
-
Fixed an error where the preview area did not display chart background changes.
-
Fixed the text in the report creation menu.
Changes in private embeddings
- Improved readability of token and dependent object error messages in private embeddings. They now describe the possible causes of the error.
Outdated embedding settingserror message is now displayed correctly for widgets in private embeddings of dashboards.- Fixed an error on mobile devices where embedded dashboard selector values were reset after clicking a chart.