Yandex DataLens release notes: September 2024
- Changes in basic features
- Special FQDNs in connections
- Integration with Connection Manager
- Pinning widgets
- Freezing table columns
- New bulk operations with fields
- Support for markup functions in charts
- Using Markdown in chart and map tooltip labels
- Configuring RLS for user groups
- Filtering charts by other charts for maps
- Field tooltips in a chart
- Dataset access denied error
- Displaying charts as tables
- Fixes in tables
- Heat mapchart display
- Dashboard link settings
- Changes available with the Businessservice plan
Changes in basic features
Special FQDNs in connections
In connections to ClickHouse®, PostgreSQL, MySQL®, or Greenplum®, now you can select a special FQDN that points to the current master host or the least lagging replica.
For standard FQDNs, now you can specify multiple hosts for connection.
Integration with Connection Manager
Added integration with Connection Manager for the following connections:
Pinning widgets
Now you can pin (i.e., lock the position of) a widget in dedicated lock areas at the top of the dashboard. These areas stay locked as you scroll the page, and the widgets pinned on them keep their position.
Freezing table columns
Added the ability to freeze one or more columns in regular and pivot tables. Once frozen, these columns stay in place as you scroll horizontally.
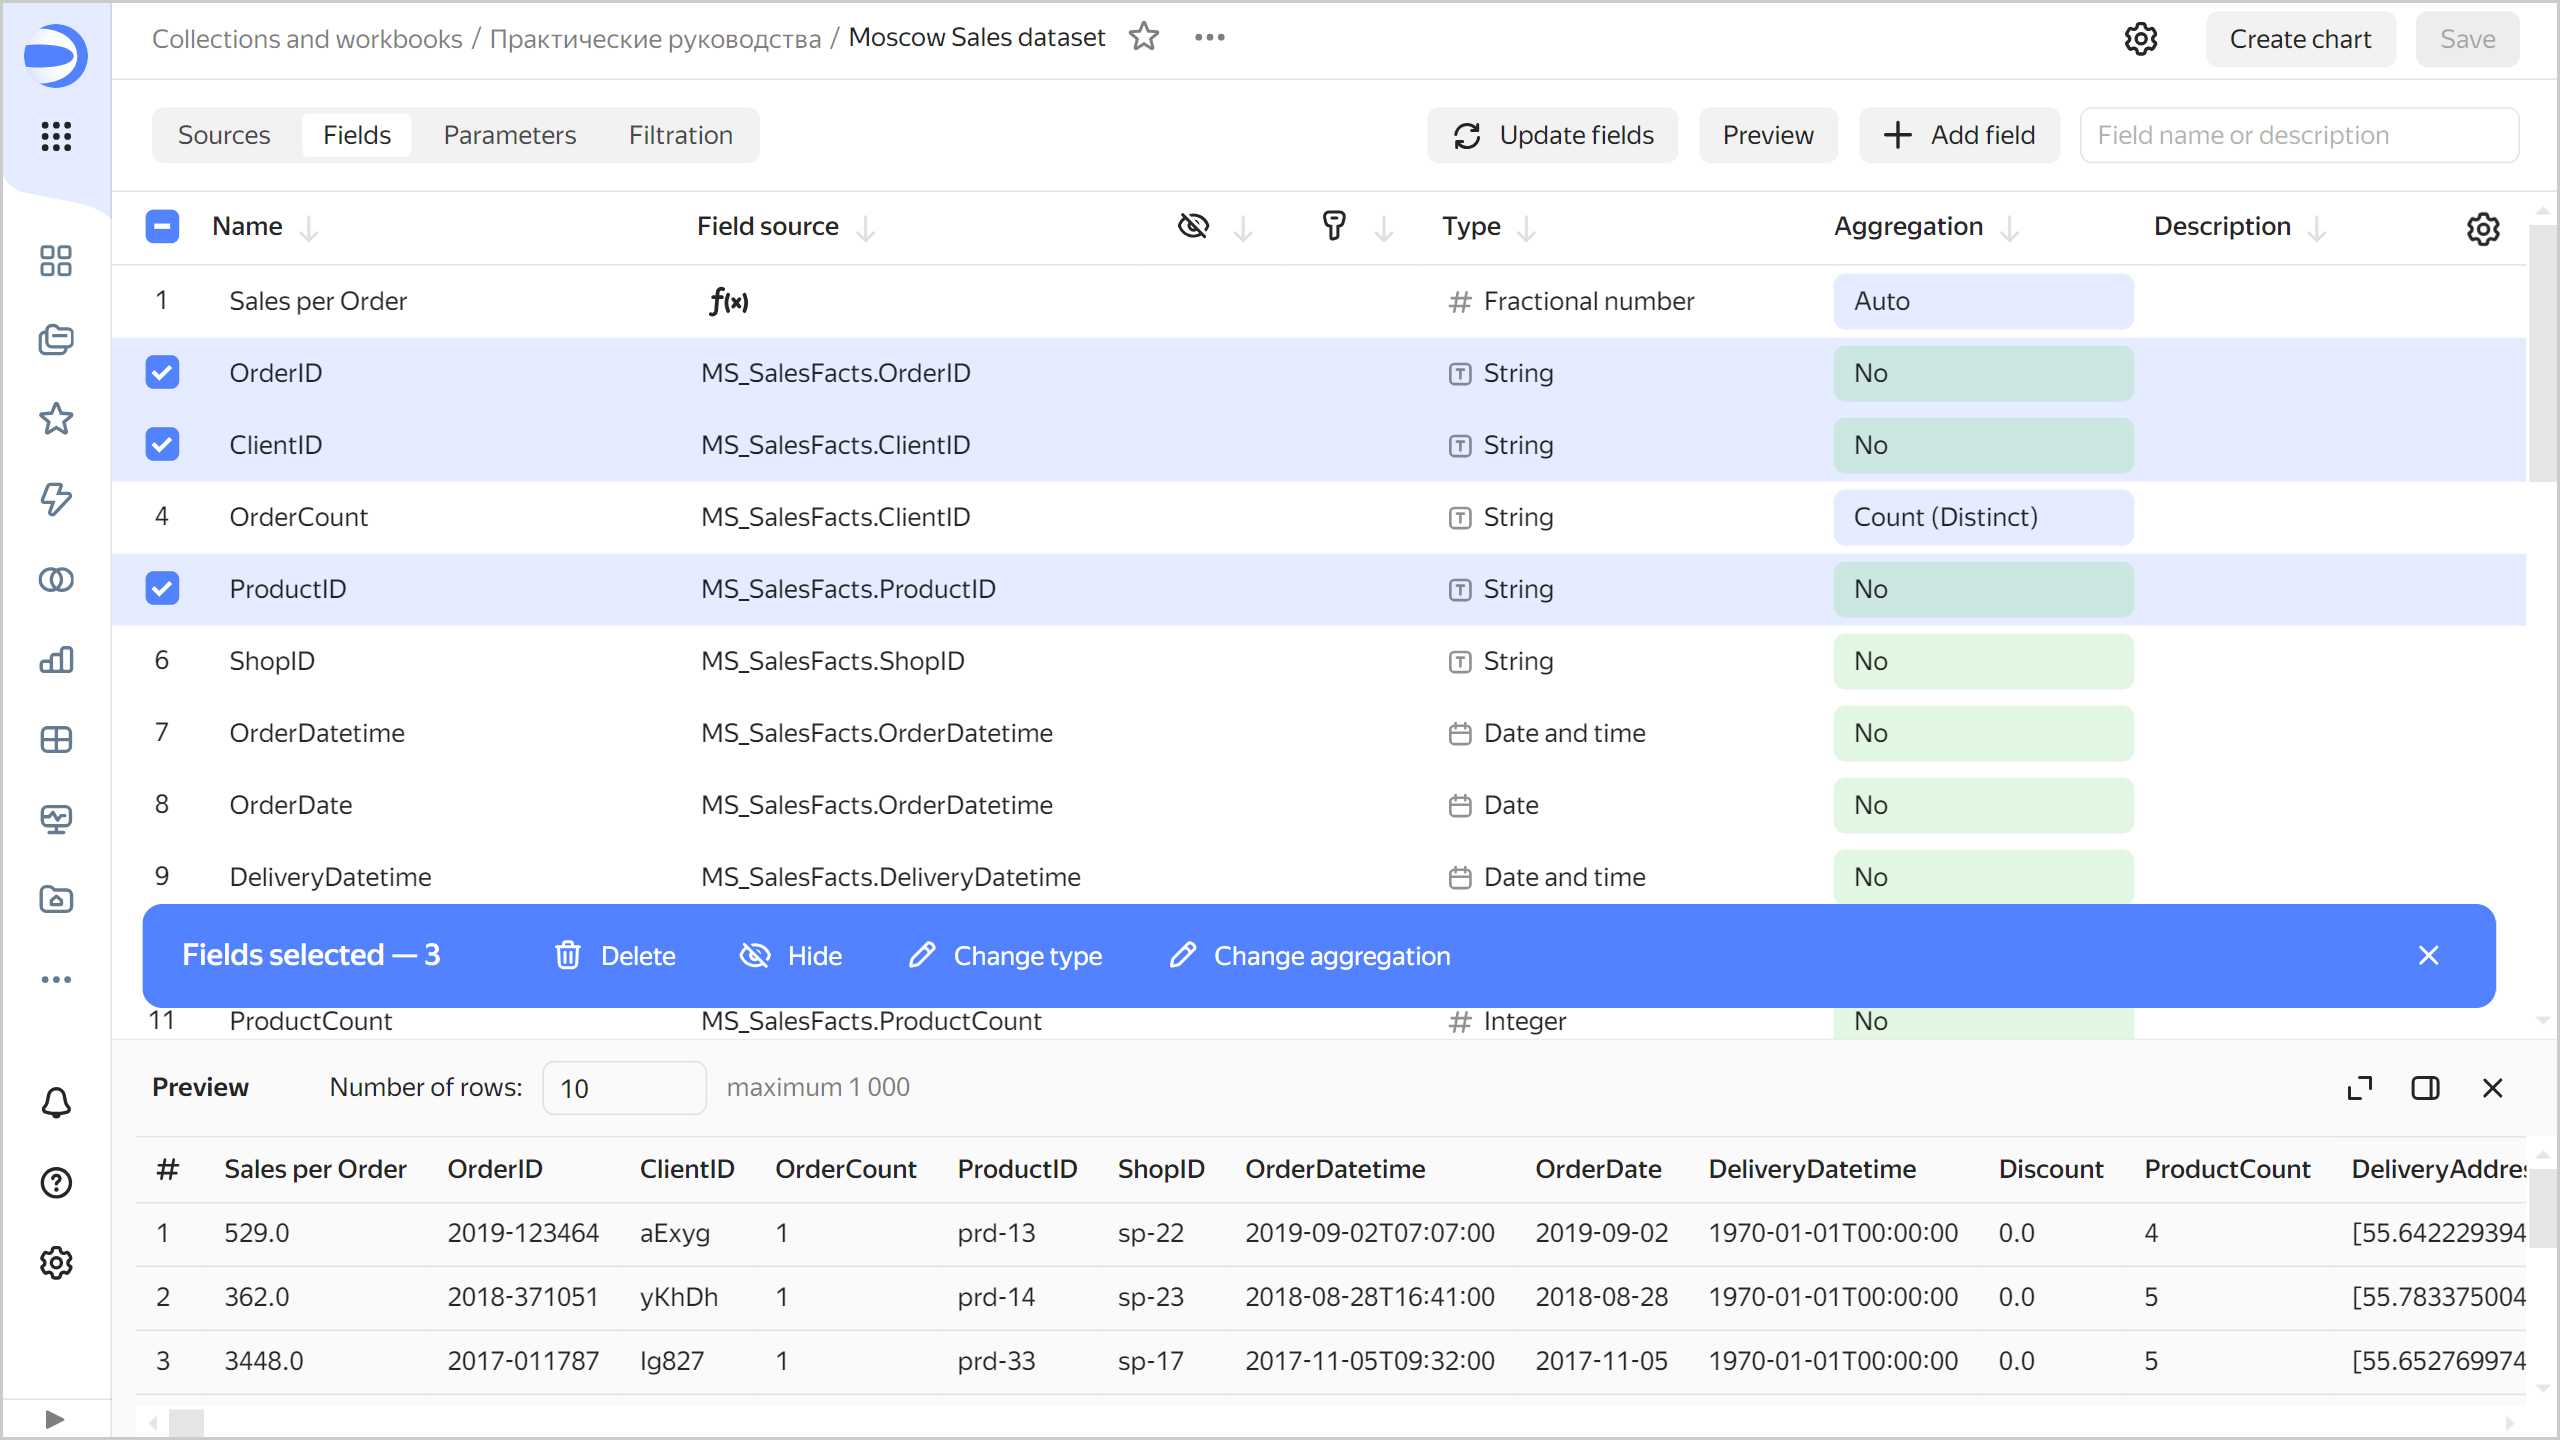
New bulk operations with fields
Added new bulk operations with marked fields in a dataset. Now you can change their types or aggregation.
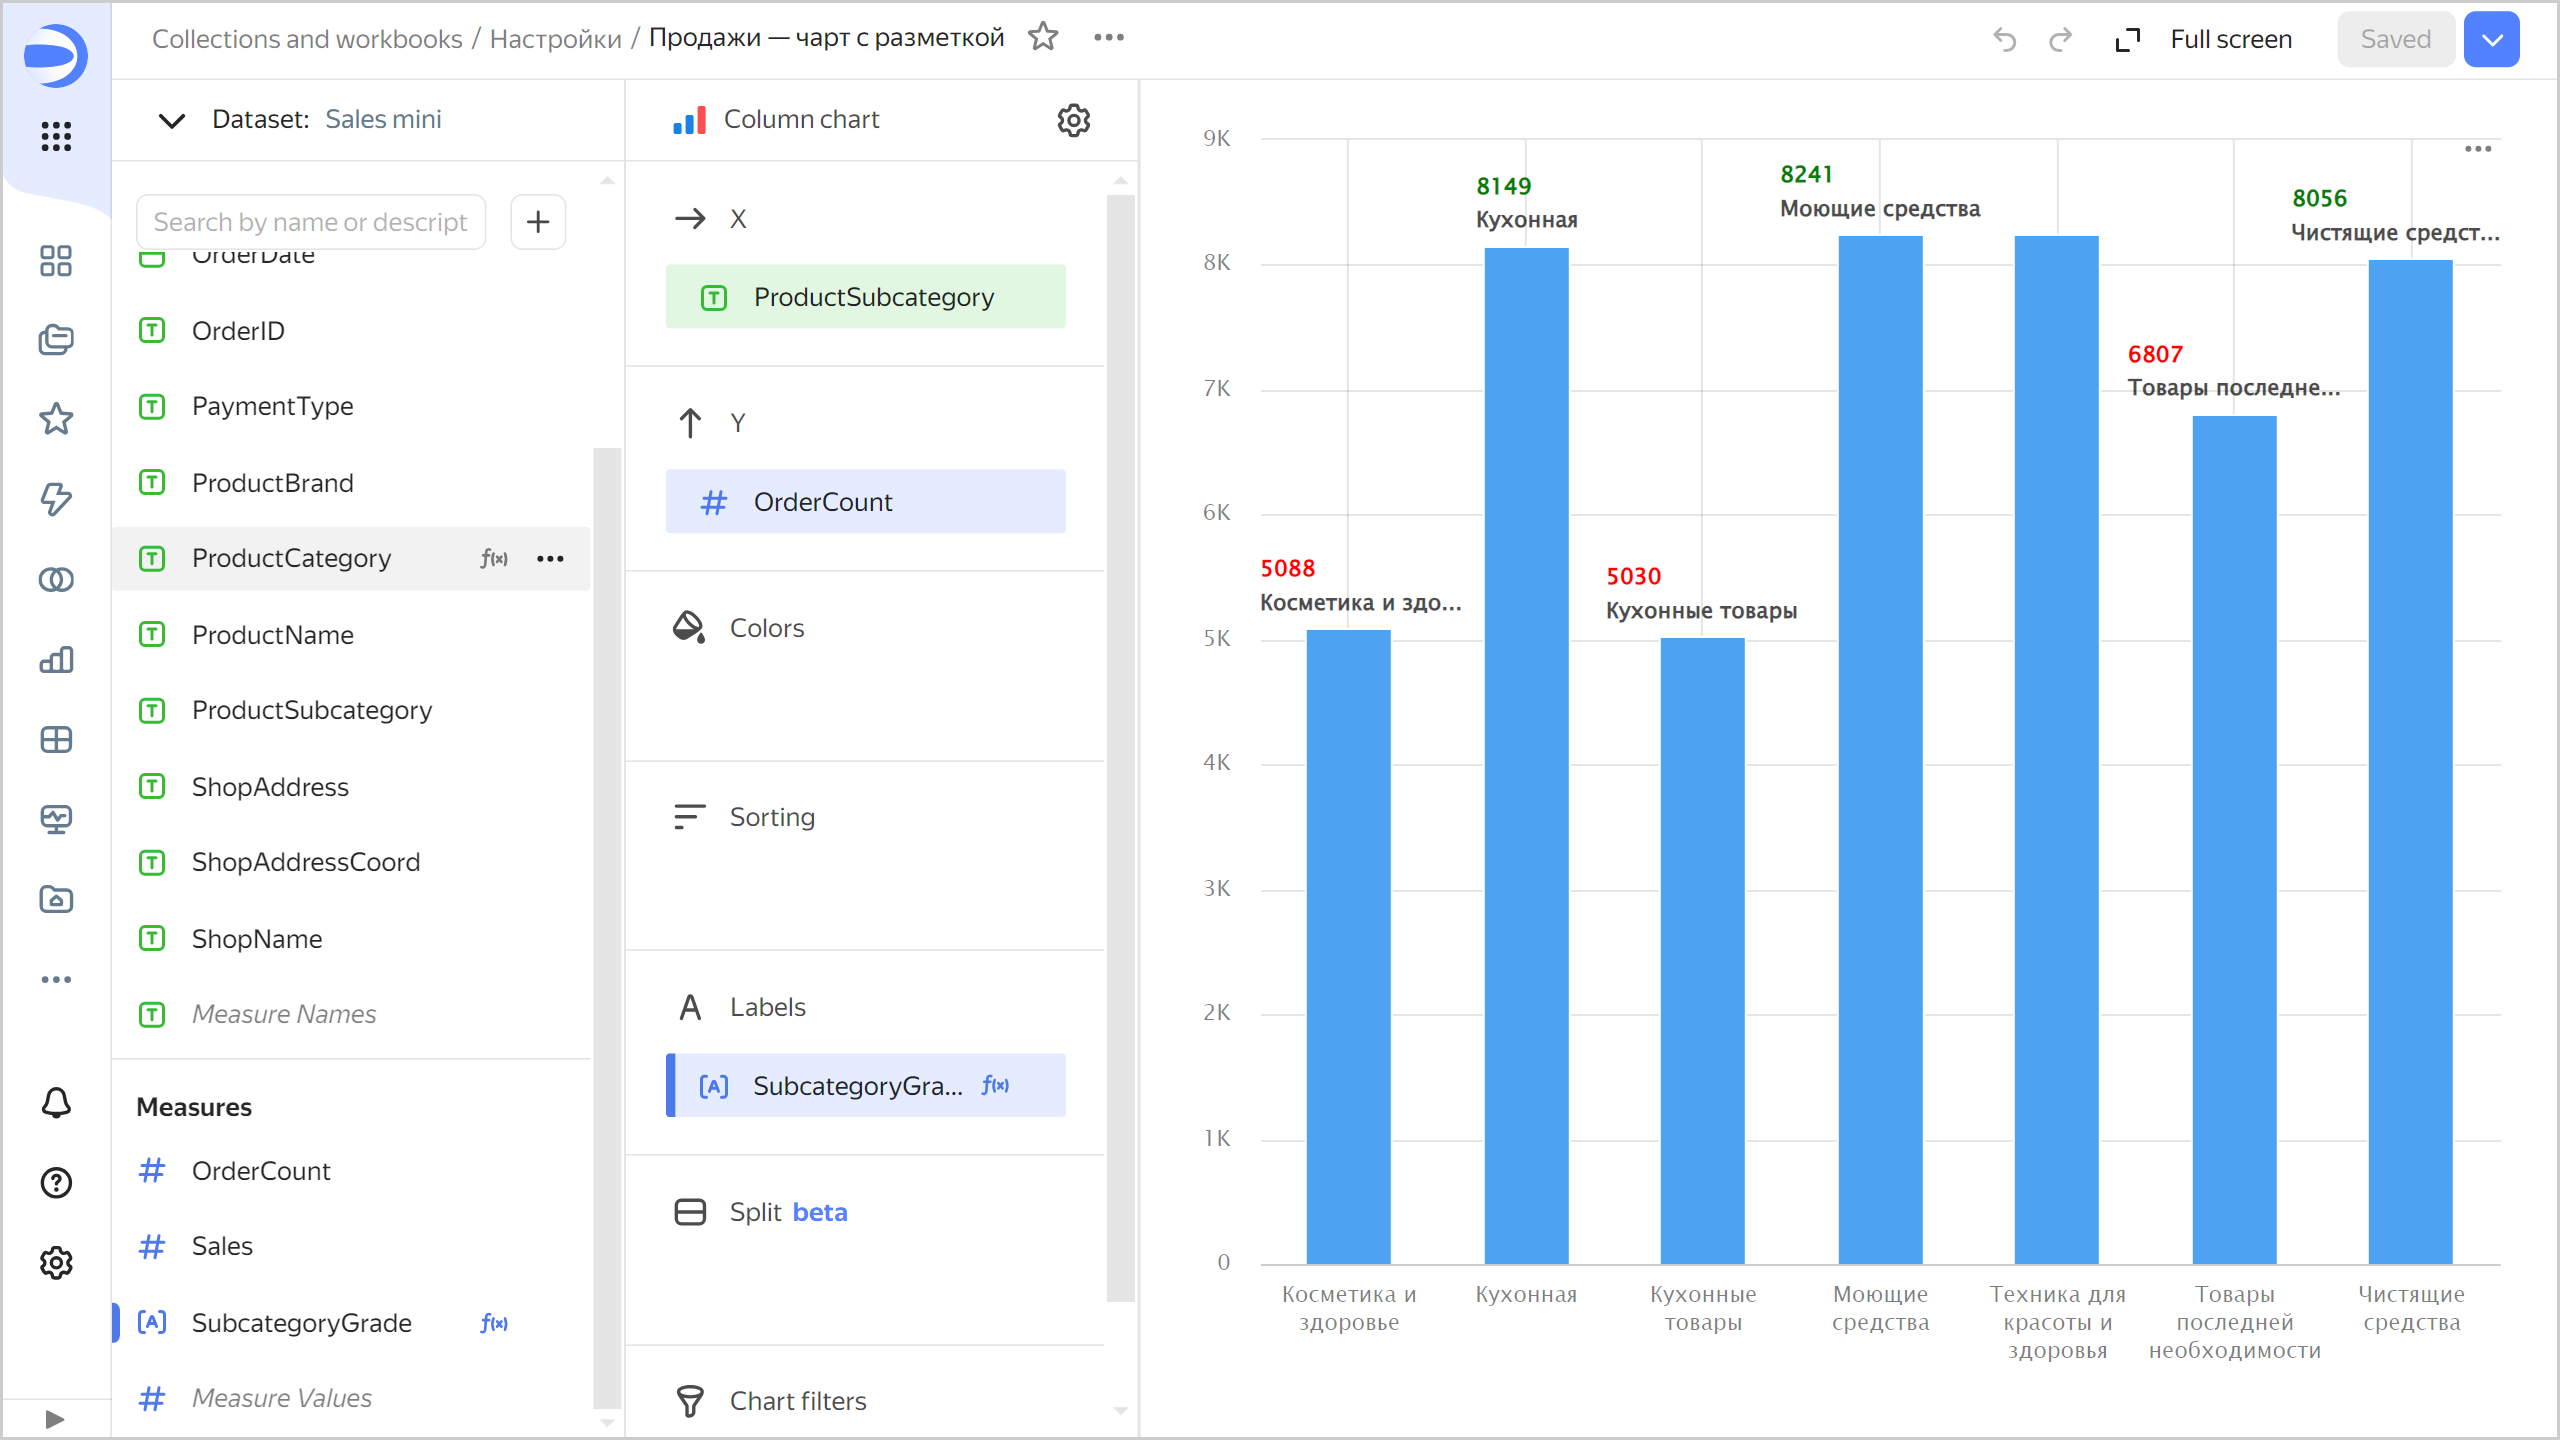
Support for markup functions in charts
In charts, now you can use markup functions in labels.
For example, under Labels, you can add a field with this formula:
MARKUP(
    COLOR(STR([OrderCount]), IF ([OrderCount] < 7000) THEN 'red' ELSE 'green' END),
    BR(),
    IF(LEN([ProductSubcategory]) > 15) THEN LEFT([ProductSubcategory],15) +'...' ELSE [ProductSubcategory] END
)
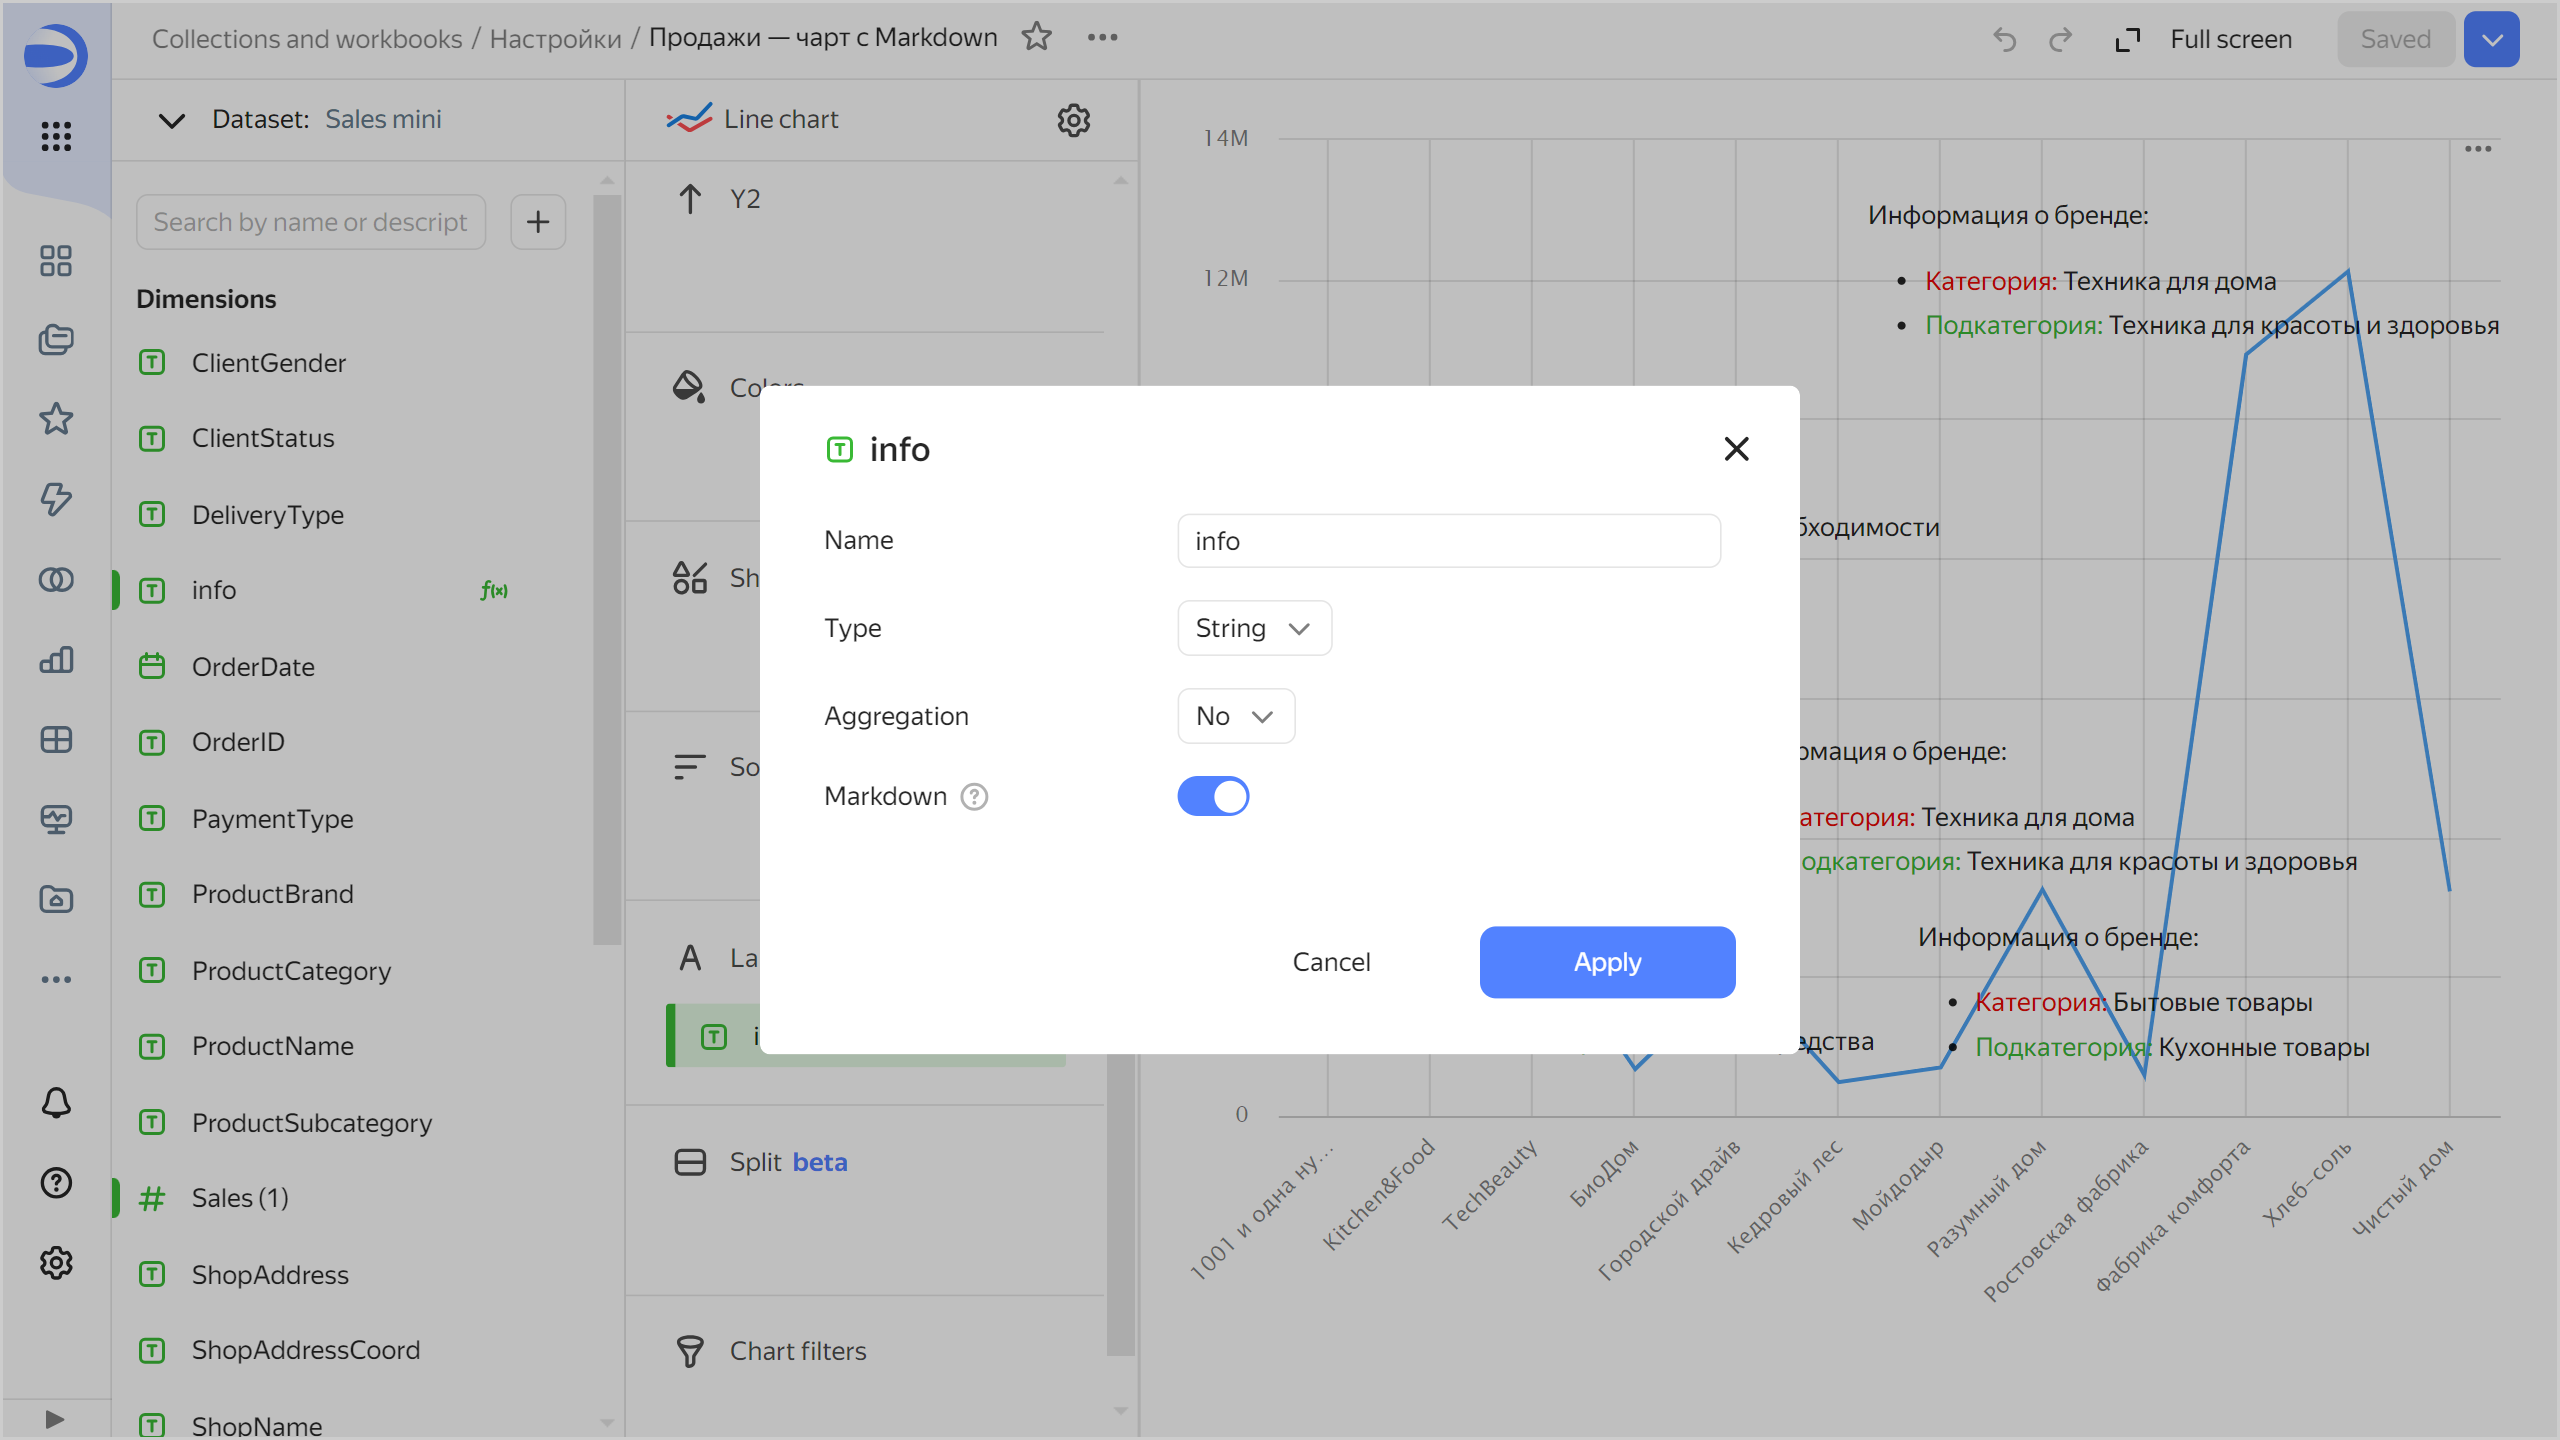
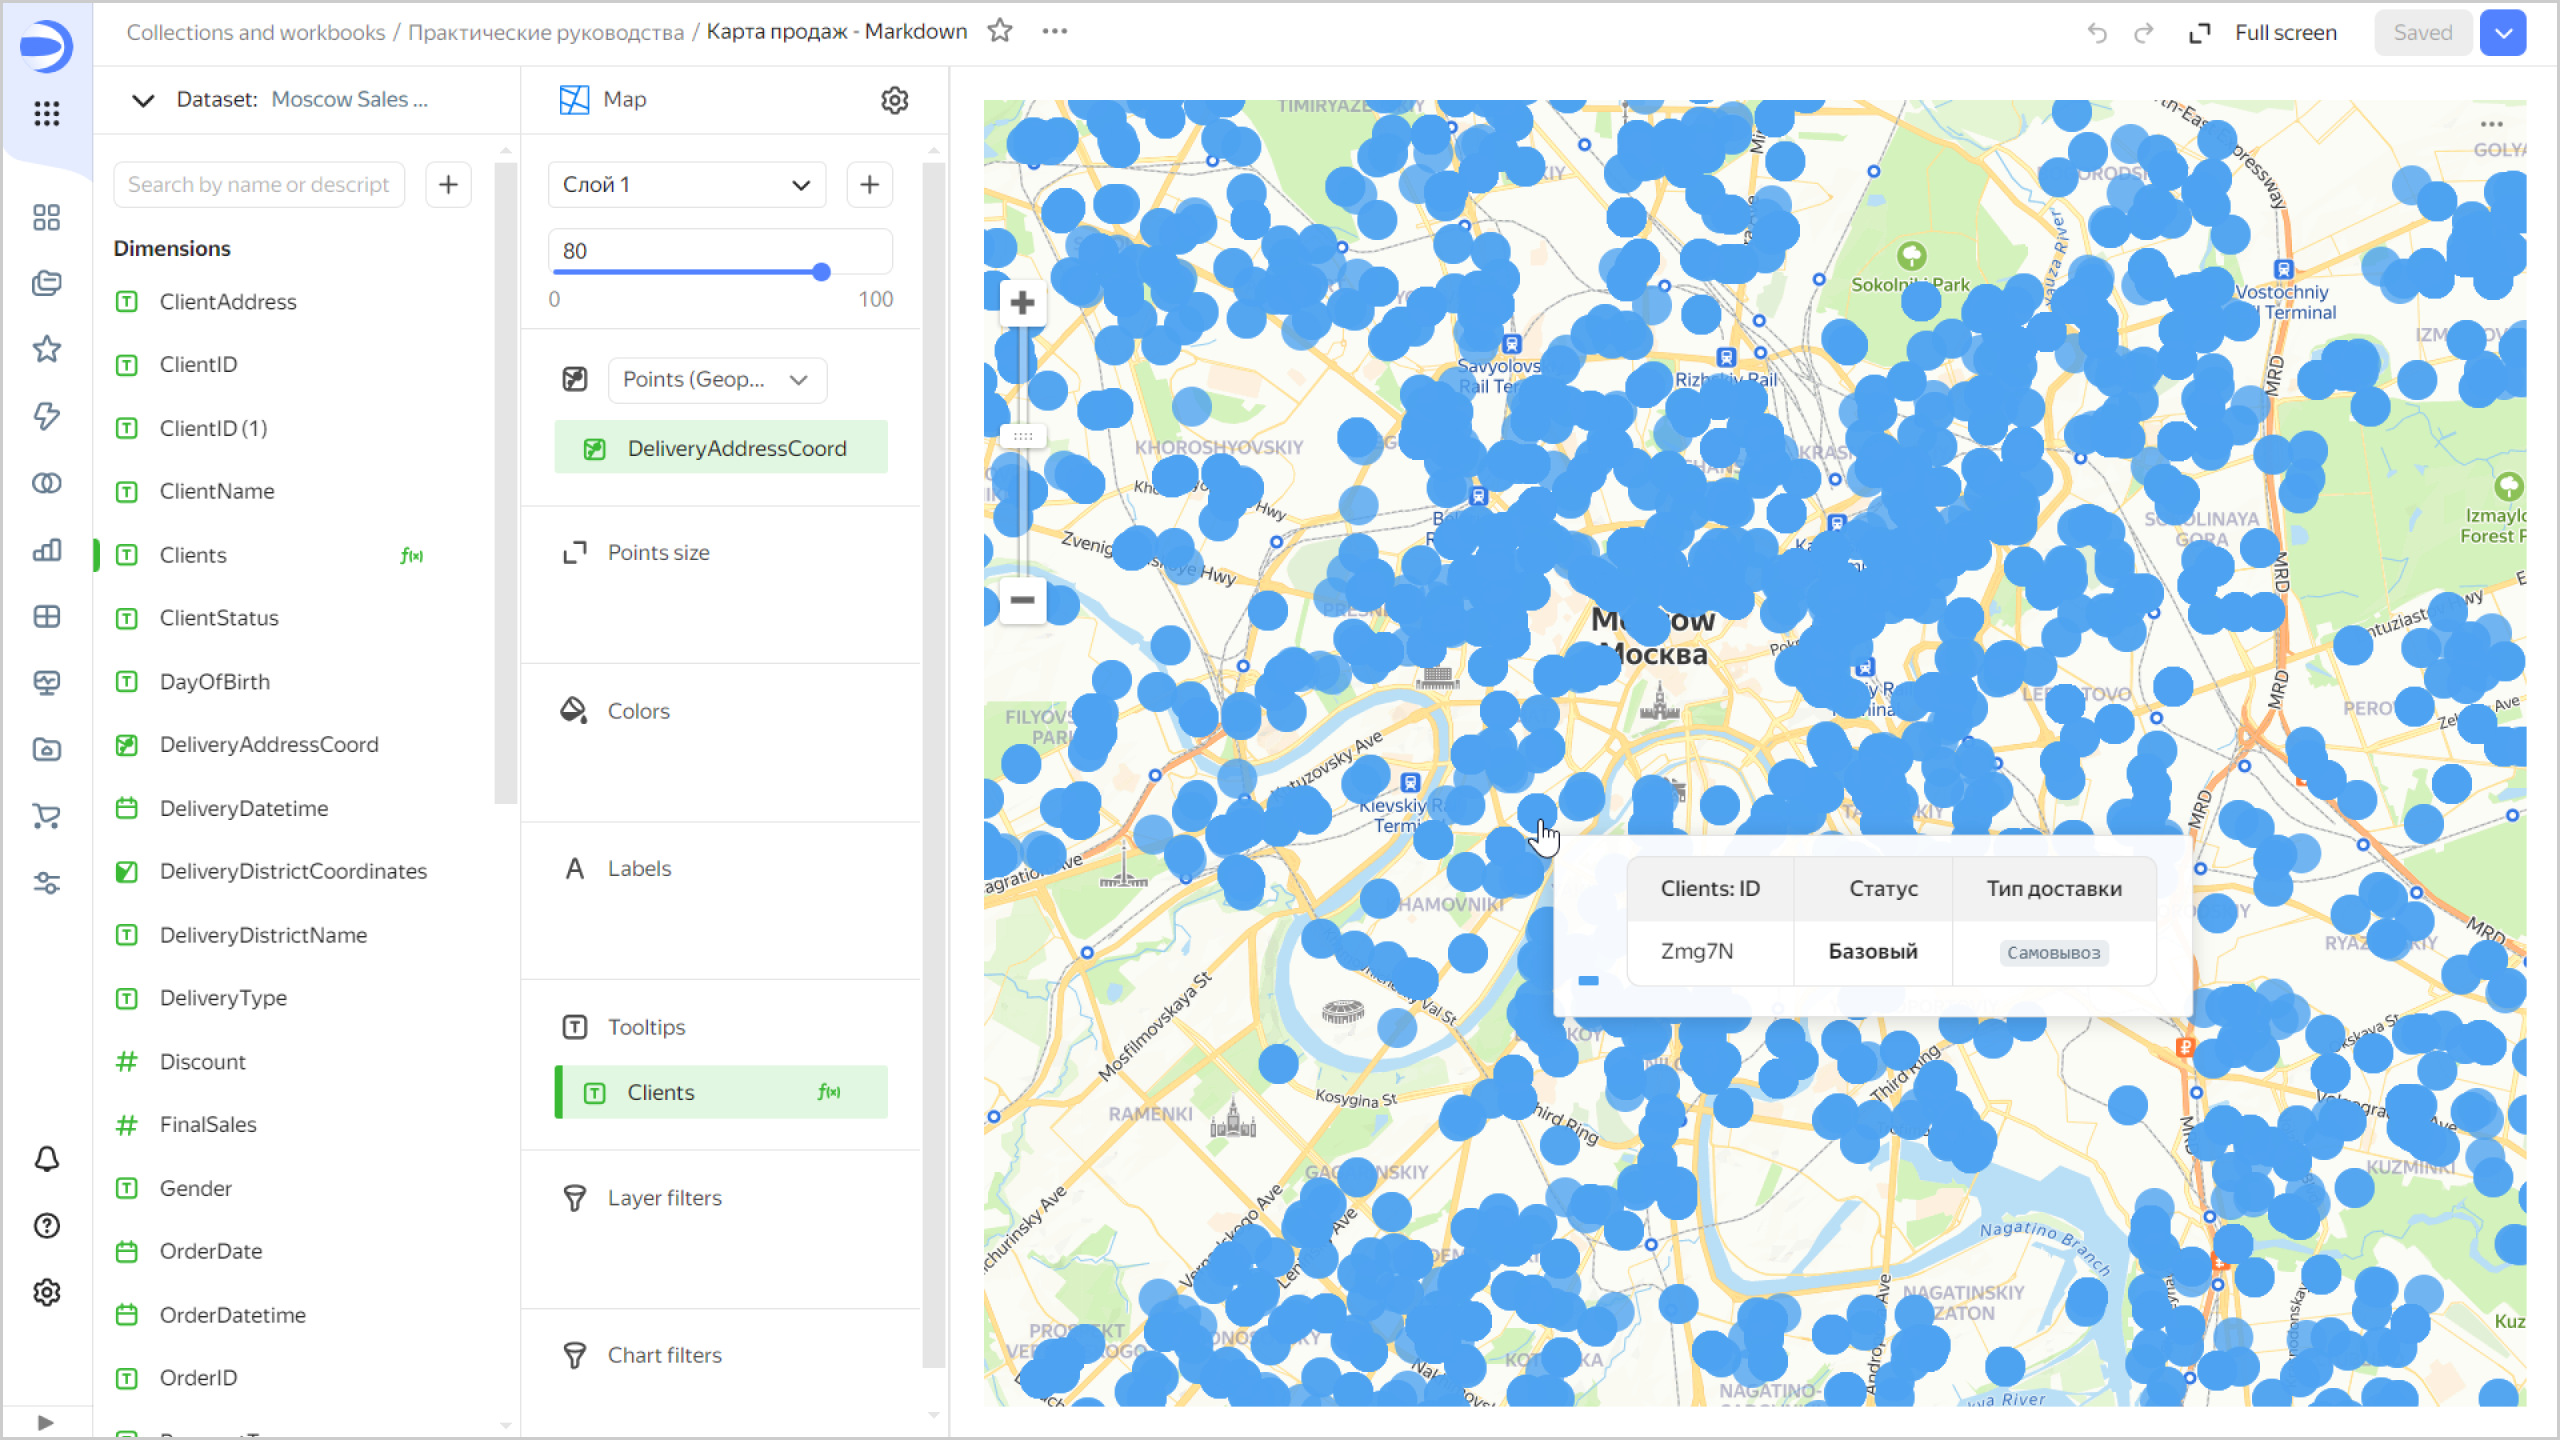
Using Markdown in chart and map tooltip labels
In chart and map tooltip labels, now you can configure the formatting for the String type fields using the basic Markdown syntax. To do this, click the icon before the field name and enable Markdown.
Markdown in chart labels
Markdown in map tooltips
Configuring RLS for user groups
Added the ability to configure RLS for user groups in a dataset.
Filtering charts by other charts for maps
Now you can filter charts by other charts in maps. Clicking a map element applies filtering by all the dimensions used in the chart except the coordinates themselves.
Field tooltips in a chart
Fixed the error that caused field tooltips to disappear after changing a dataset in a chart.
Dataset access denied error
Fixed the issue where an incorrect error type was displayed instead of the dataset access denied message.
Displaying charts as tables
Fixed the display of charts as tables. To open your chart as a table, click → Open as a table in the top-right corner of the chart.
Fixes in tables
Fixed these table related errors:
- Old dates were displayed incorreclty.
- Colors failed to apply to a table correctly after updating filters.
- Totals row was displayed incorrectly.
- In a table with a hierarchy and enabled pagination, only the first rows were displayed and there was no navigator to move through the pages.
Heat mapchart display
Fixed the display of Heat map chart in the wizard.
Dashboard link settings
When configuring an access link for a dashboard, now you can save the state of selectors and share the link with the federation:
-
At the top of your dashboard, click and select Share.
-
In the window that opens:
- Set the language, theme, and menu display.
- (Optional) Save the selector values.
- (Optional) If you set up an identity federation, save the federation to share your link with the federation users.
-
Copy the link with the selected appearance settings by clicking Copy and close.
Changes available with the Businessservice plan
Reports
Now DataLens support reports, i.e., multi-page documents that you can export to PDF and print. You can add charts, text blocks, headers, and images to the pages of the report.
Restrictions on embedding private objects
Now you cannot create a private embedding for an object if it has dependent objects that based on the following connections:
Embedding settings
Now you can edit embeddings for private objects. To open the settings, in the row with the object in your workbook, click and select Embedding settings.