Charts in Editor
Written by

Updated at August 31, 2026
Editor is a JavaScript-based data and selector visualization tool. With Editor, you can upload data from one or multiple sources, manage chart parameters, and configure visualizations. You can use datasets and connections as data sources.
Interface
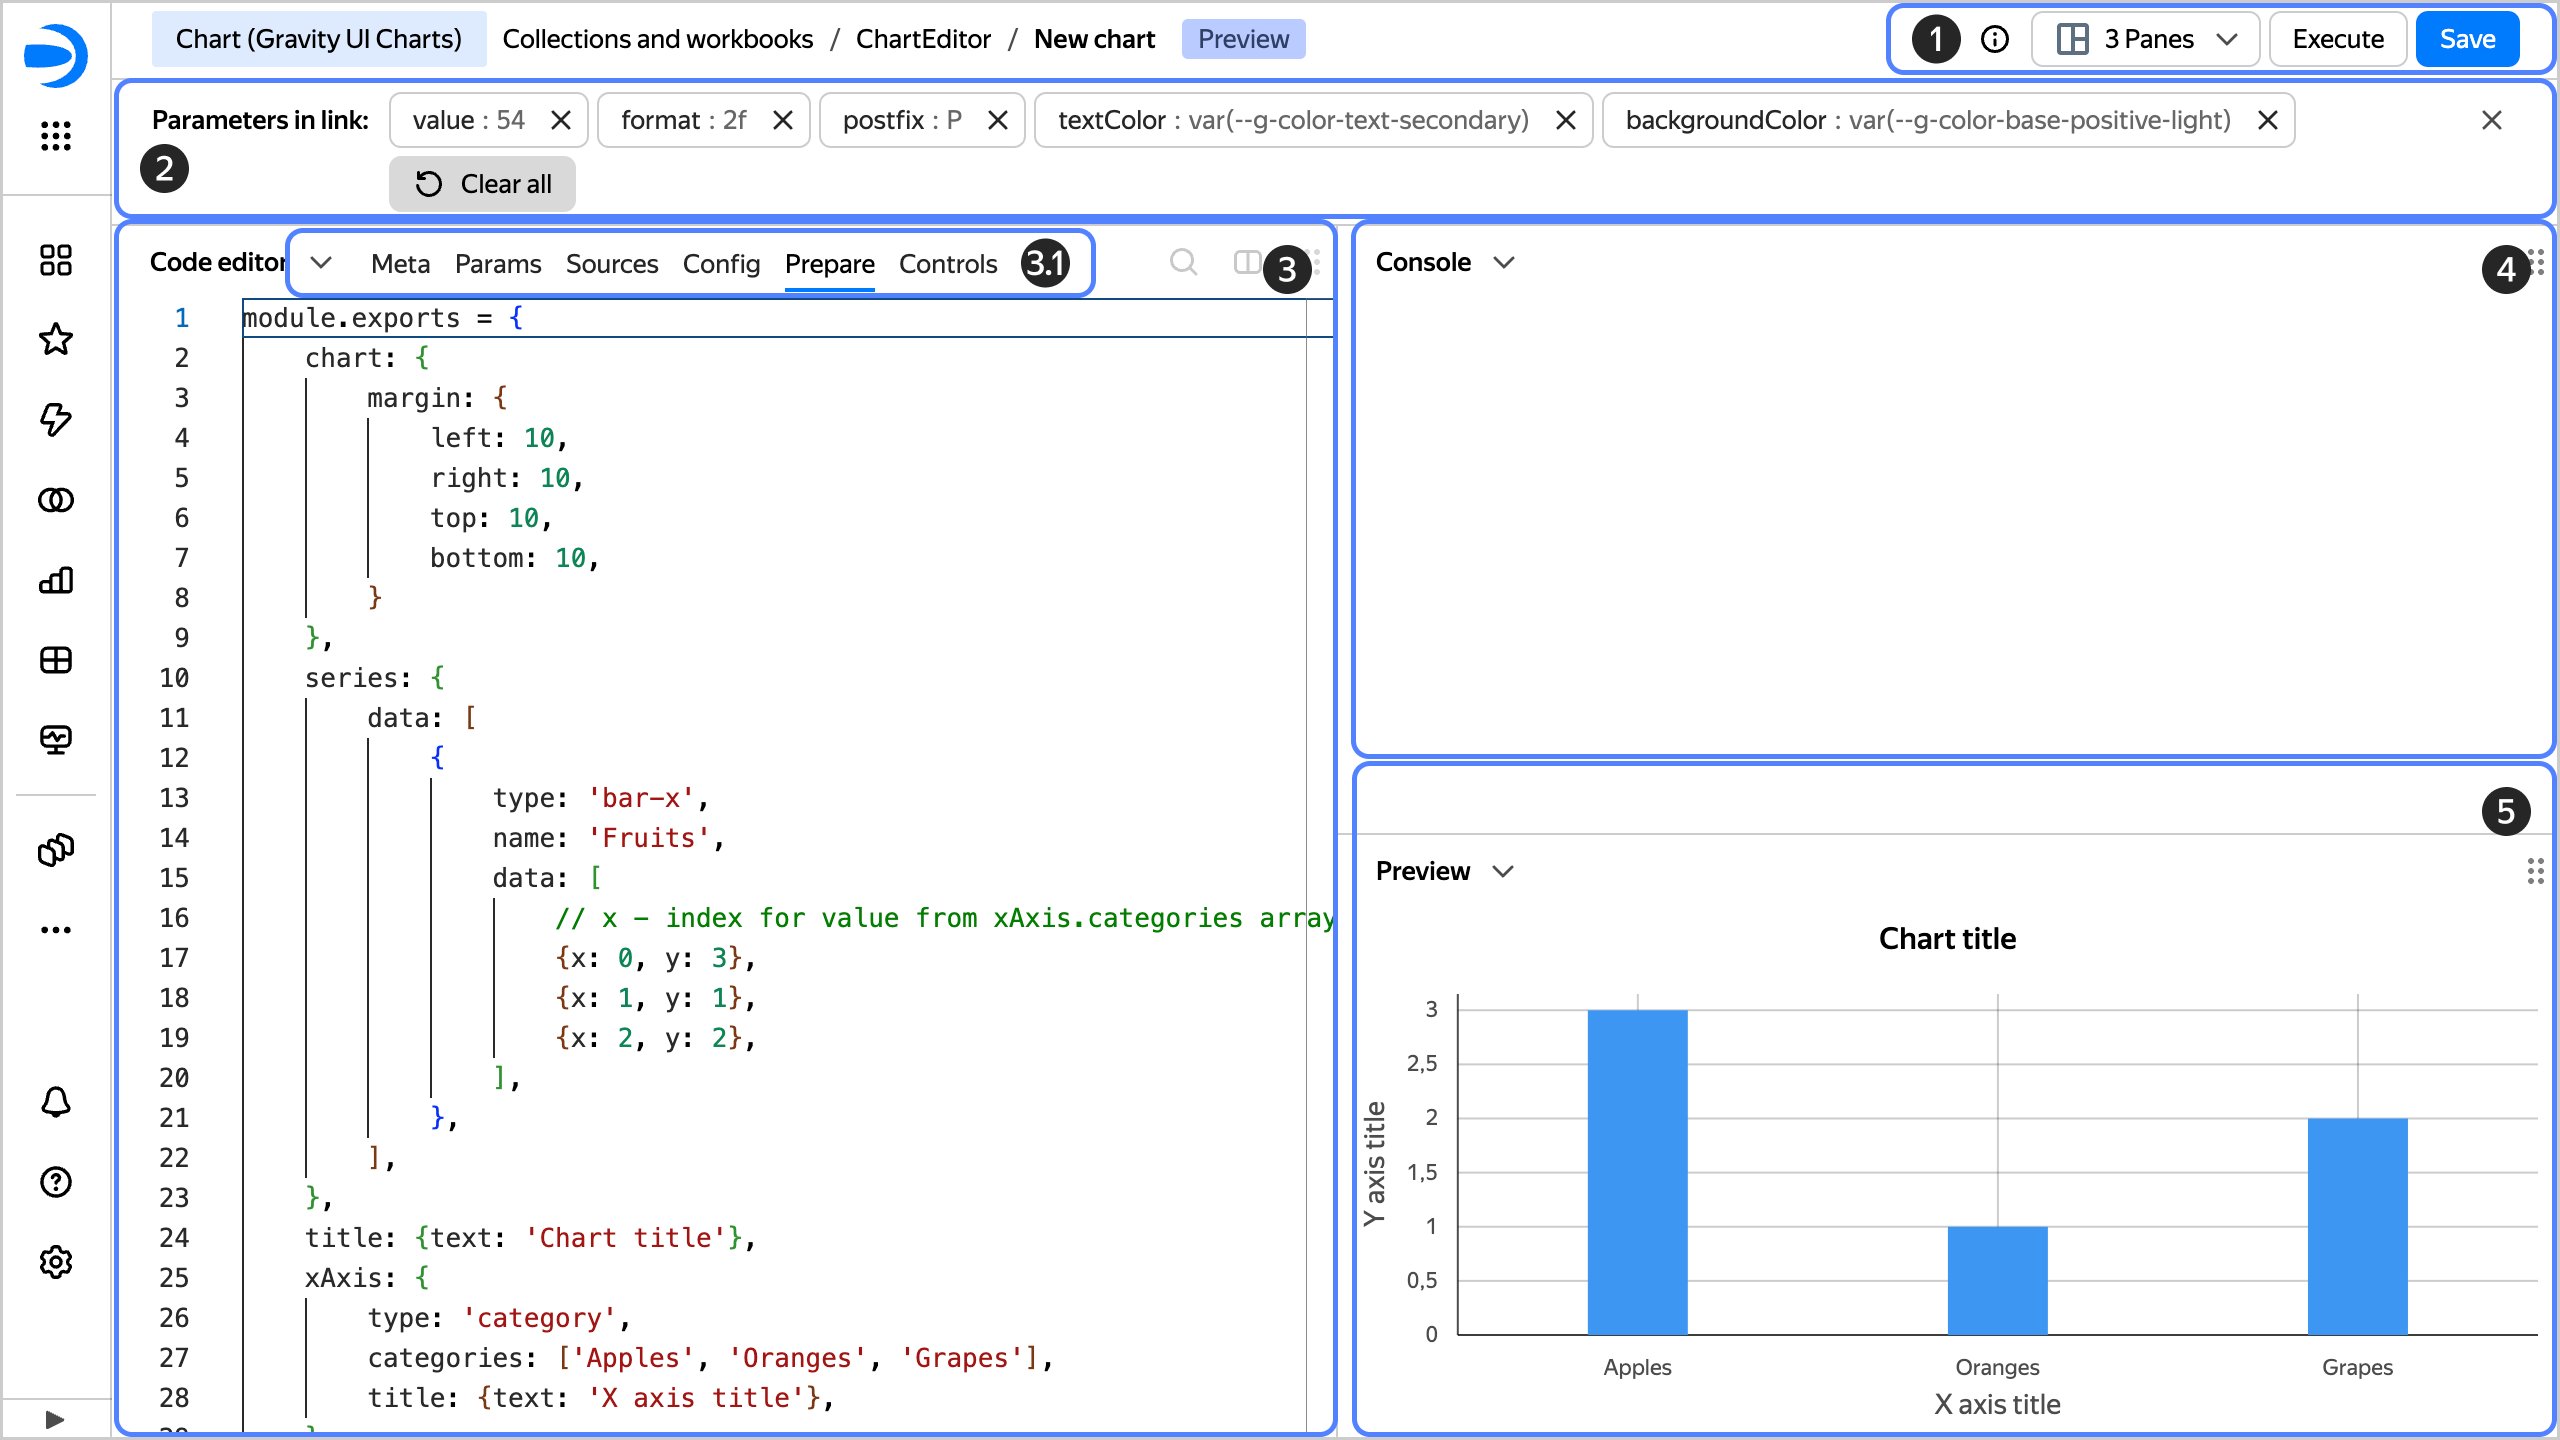
The chart creation page user interface consists of the following sections:
-
Controls:
- Managing interface panels: You can select the number and location of your interface panels. Each one can display CodeEditor, Preview, or Console.
- Chart preview refresh: After each chart code update, click Execute or press
Ctrl(Cmd) +Enterto view the result. This action does not save the chart. - Saving the chart: You can save your chart the usual way or create a draft version.
-
If Editor is opened with parameters stated in the URL, a panel with overridden parameters (2 on the screenshot) will appear below the controls panel.
-
CodeEditor panel to view and edit the contents of the chart's tabs. To learn more about tabs (3.1 on the screenshot), see Tabs.
-
Console panel for additional debugging information.
-
Chart Preview panel.