Yandex Cloud
Search
Contact UsGet started
  • Blog
  • Pricing
  • Documentation
  • All Services
  • System Status
    • Featured
    • Infrastructure & Network
    • Data Platform
    • Containers
    • Developer tools
    • Serverless
    • Security
    • Monitoring & Resources
    • ML & AI
    • Business tools
  • All Solutions
    • By industry
    • By use case
    • Economics and Pricing
    • Security
    • Technical Support
    • Customer Stories
    • Start testing with double trial credits
    • Cloud credits to scale your IT product
    • Gateway to Russia
    • Cloud for Startups
    • Education and Science
    • Yandex Cloud Partner program
  • Blog
  • Pricing
  • Documentation
© 2025 Direct Cursus Technology L.L.C.
Yandex DataLens
    • Overview
      • Overview
      • Tabs
      • Sources
      • Available methods
      • Notifications
      • Chart links in dashboards and reports
      • Cross-filtering
      • Chart debugging
    • Versioning
    • Chart inspector
    • Access management
  • Audit Trails events
  1. Charts
  2. Charts in Editor
  3. Chart debugging

Chart debugging in Editor

Written by
Yandex Cloud
Updated at April 24, 2025

You can find debug information and chart execution errors on the Console panel.

image

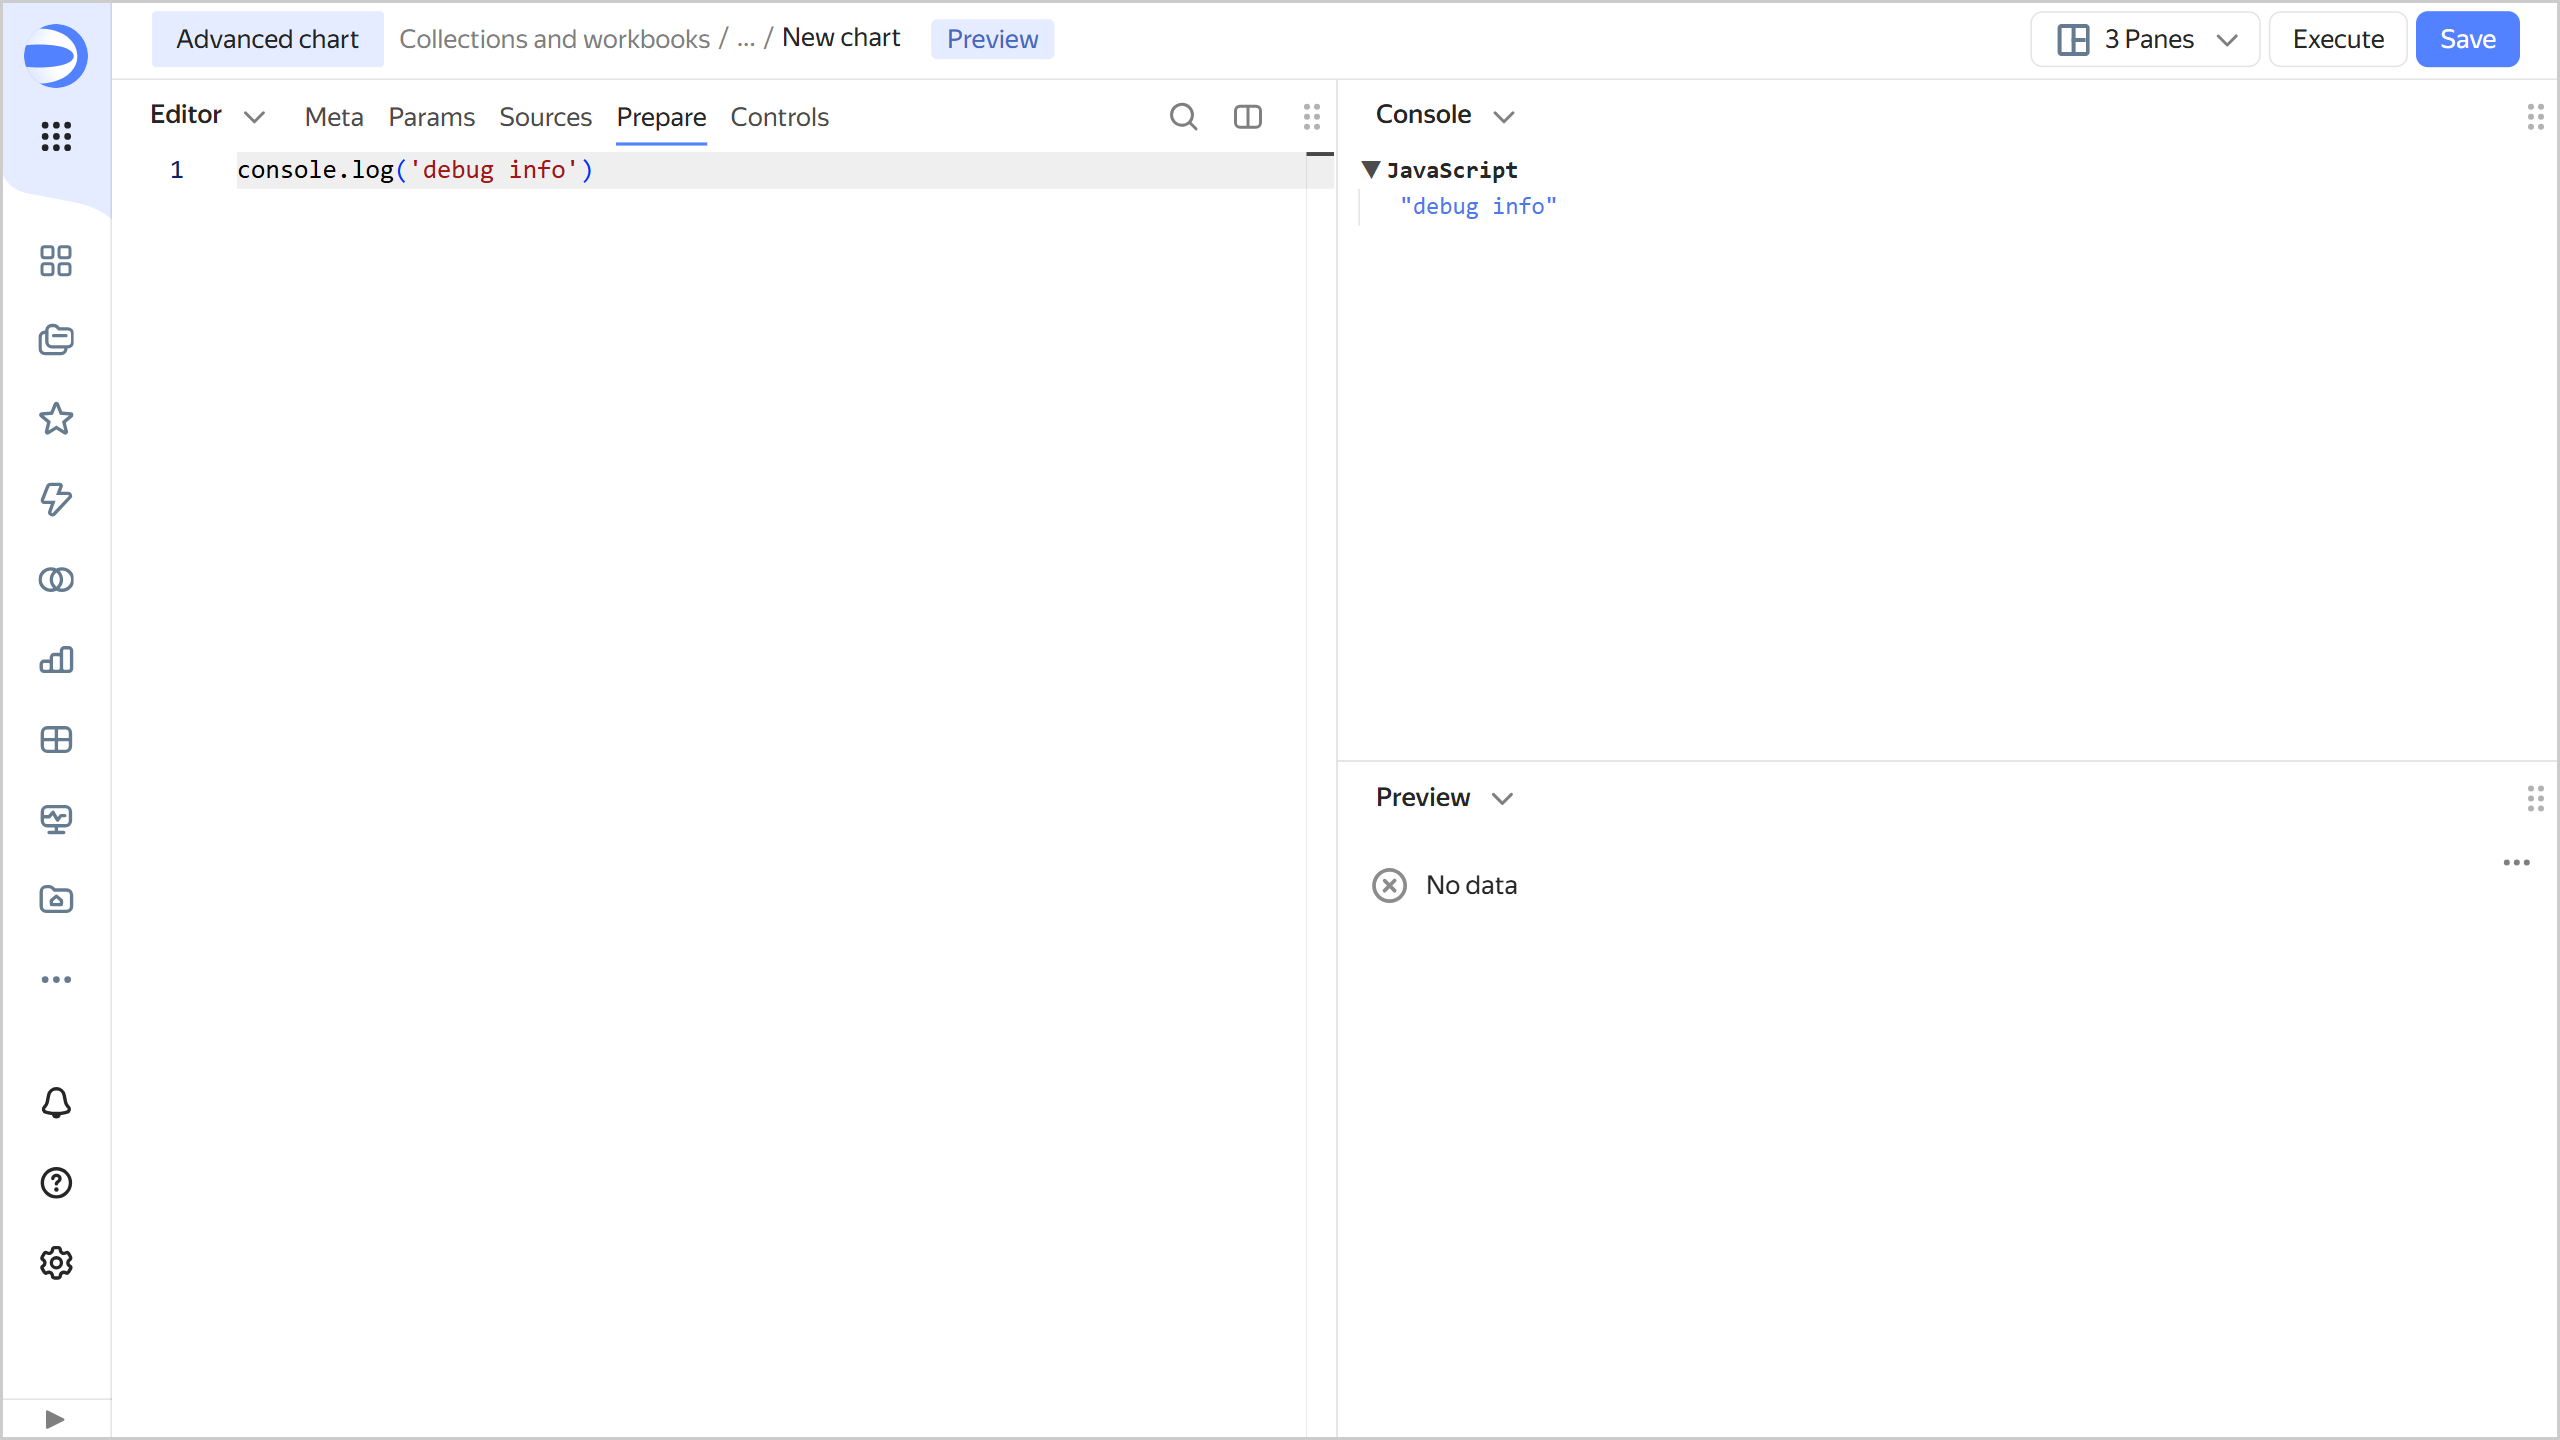
To display additional information in a particular place in the code, use the console.log(value) function. Code within functions wrapped in Editor.wrapFn runs on the client side. When using console.log inside these functions, logs will be output to the browser console.

Was the article helpful?

Previous
Cross-filtering
Next
Overview
© 2025 Direct Cursus Technology L.L.C.