Opening a chart as a table in Yandex DataLens
Written by
Updated at June 2, 2026
You can display data used to render a chart as a table.
This feature is not available for the following chart types:
To open a chart as a table, do one of the following:
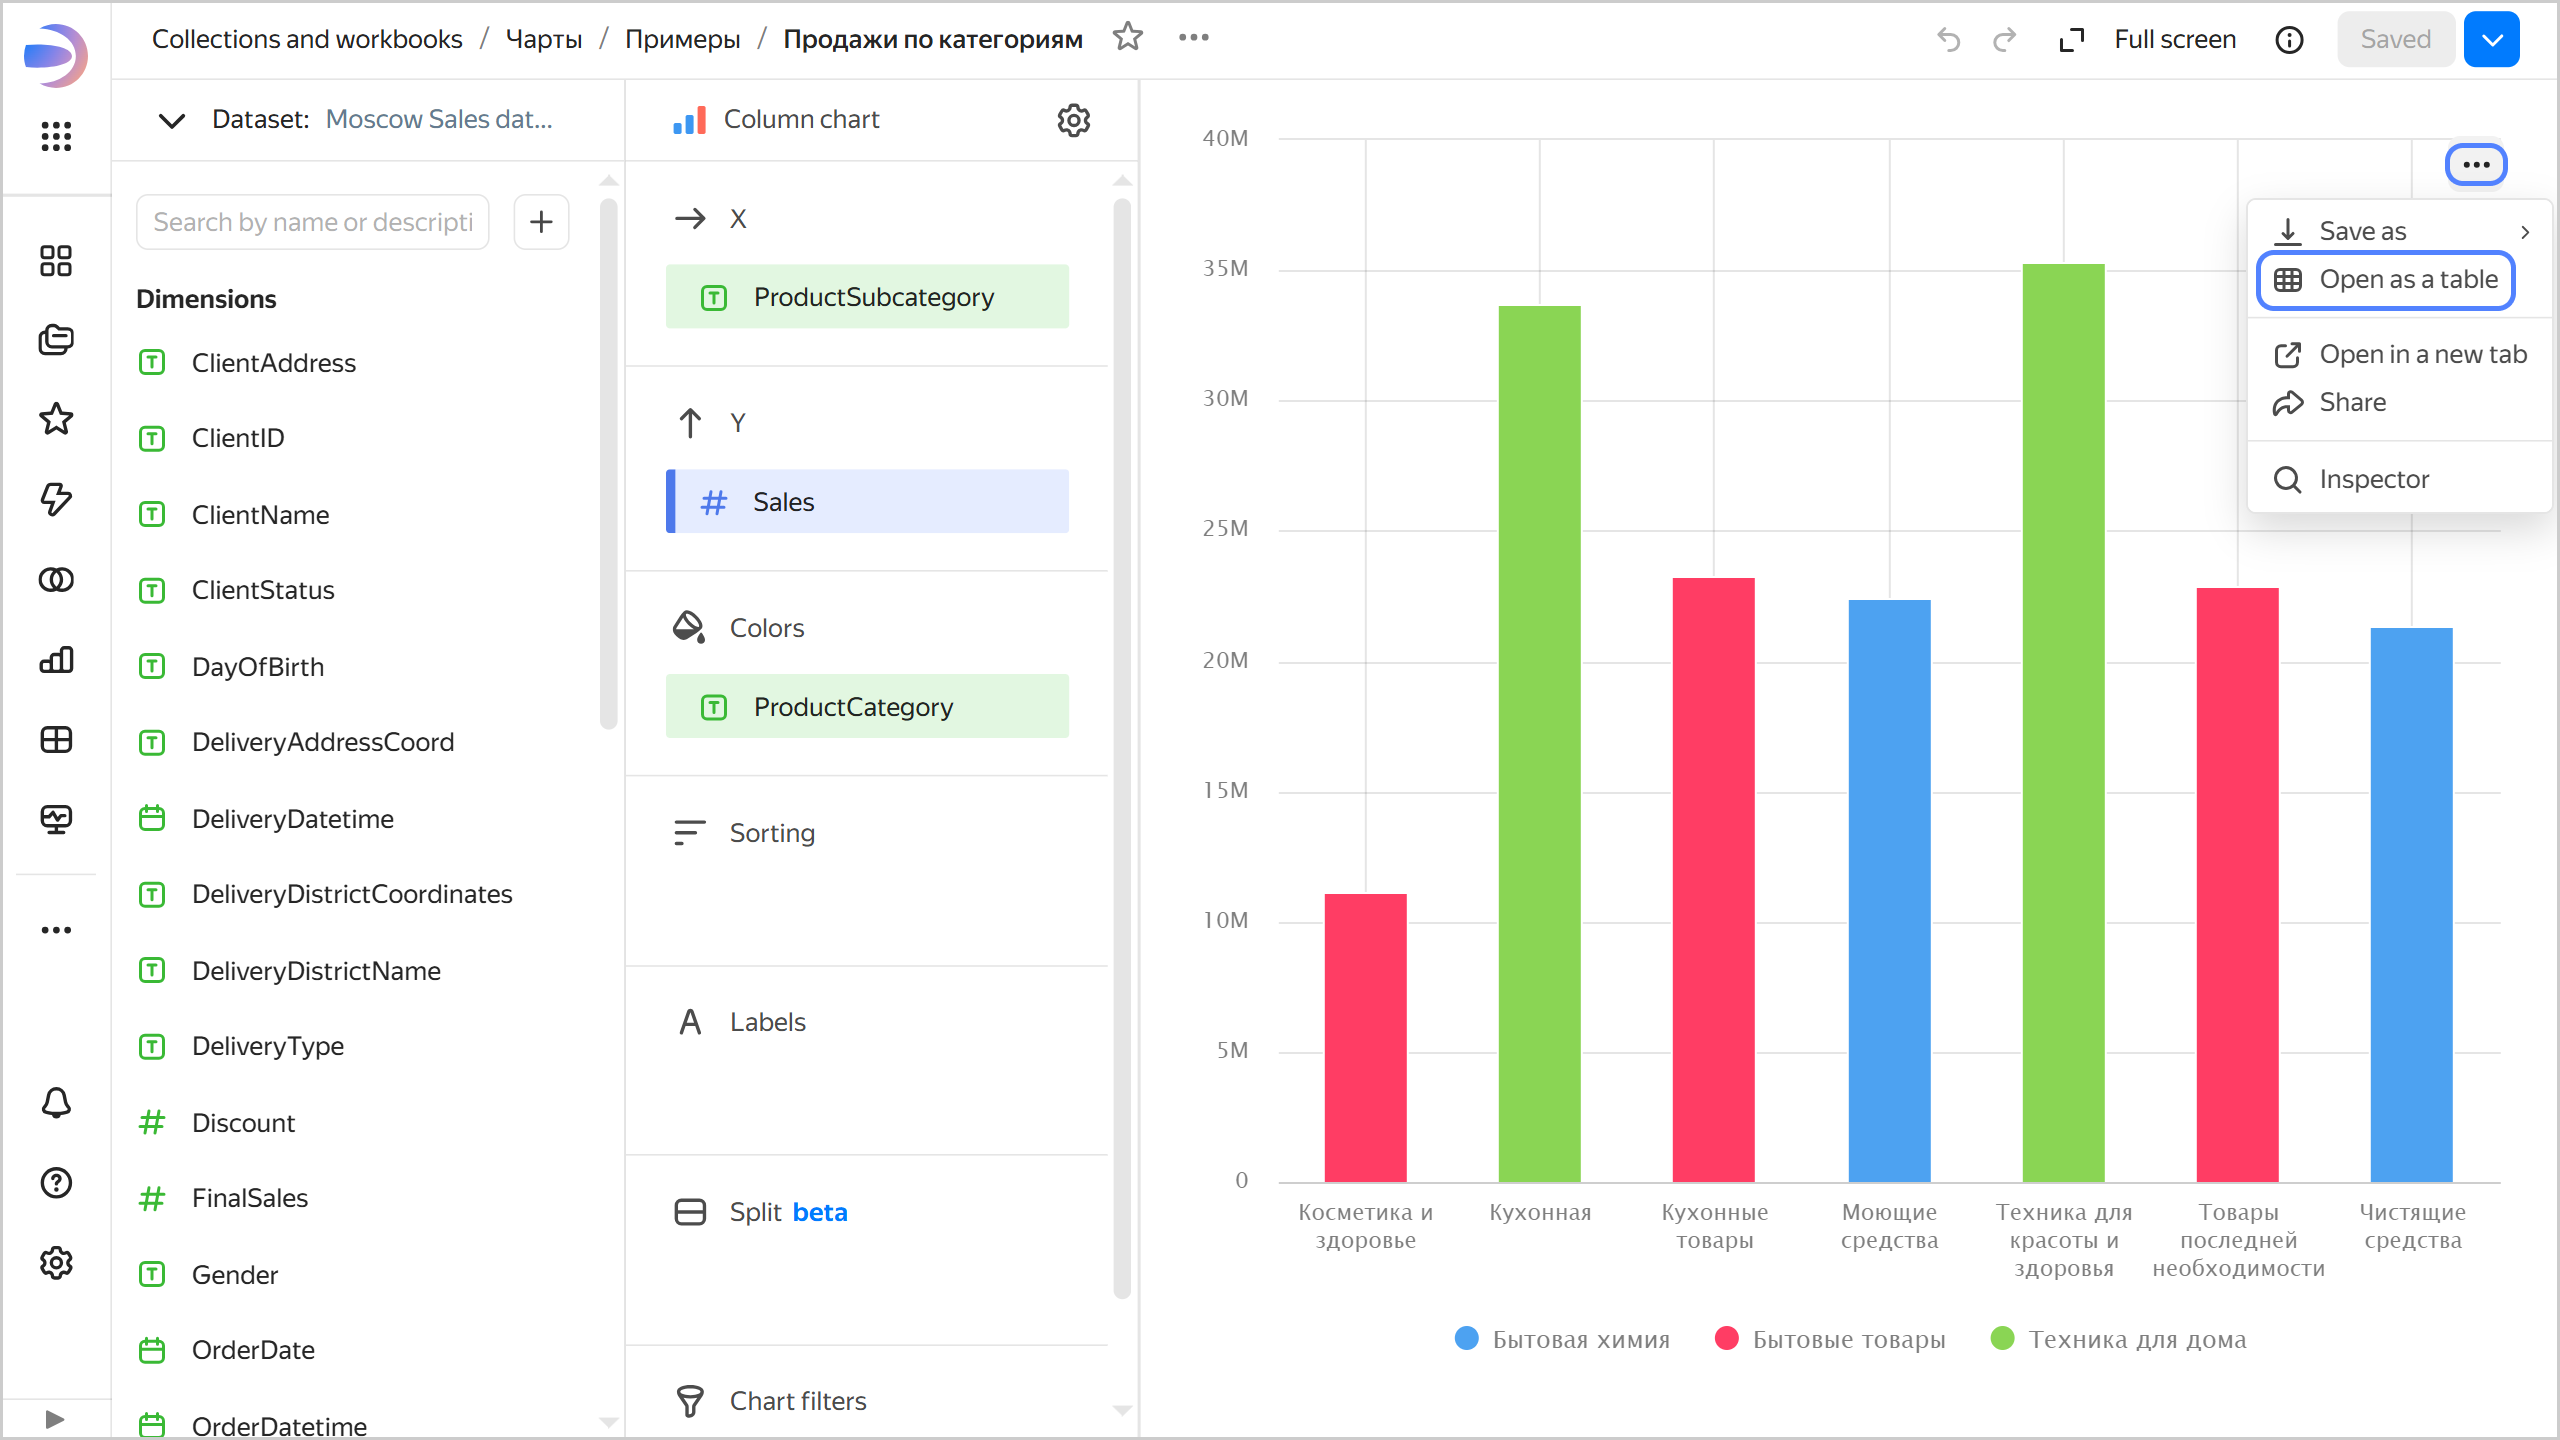
- Open the chart and click → Open as table in its top-right corner.
- On the dashboard, find the chart and click → Open as table in its top-right corner.
Opening a chart as a table
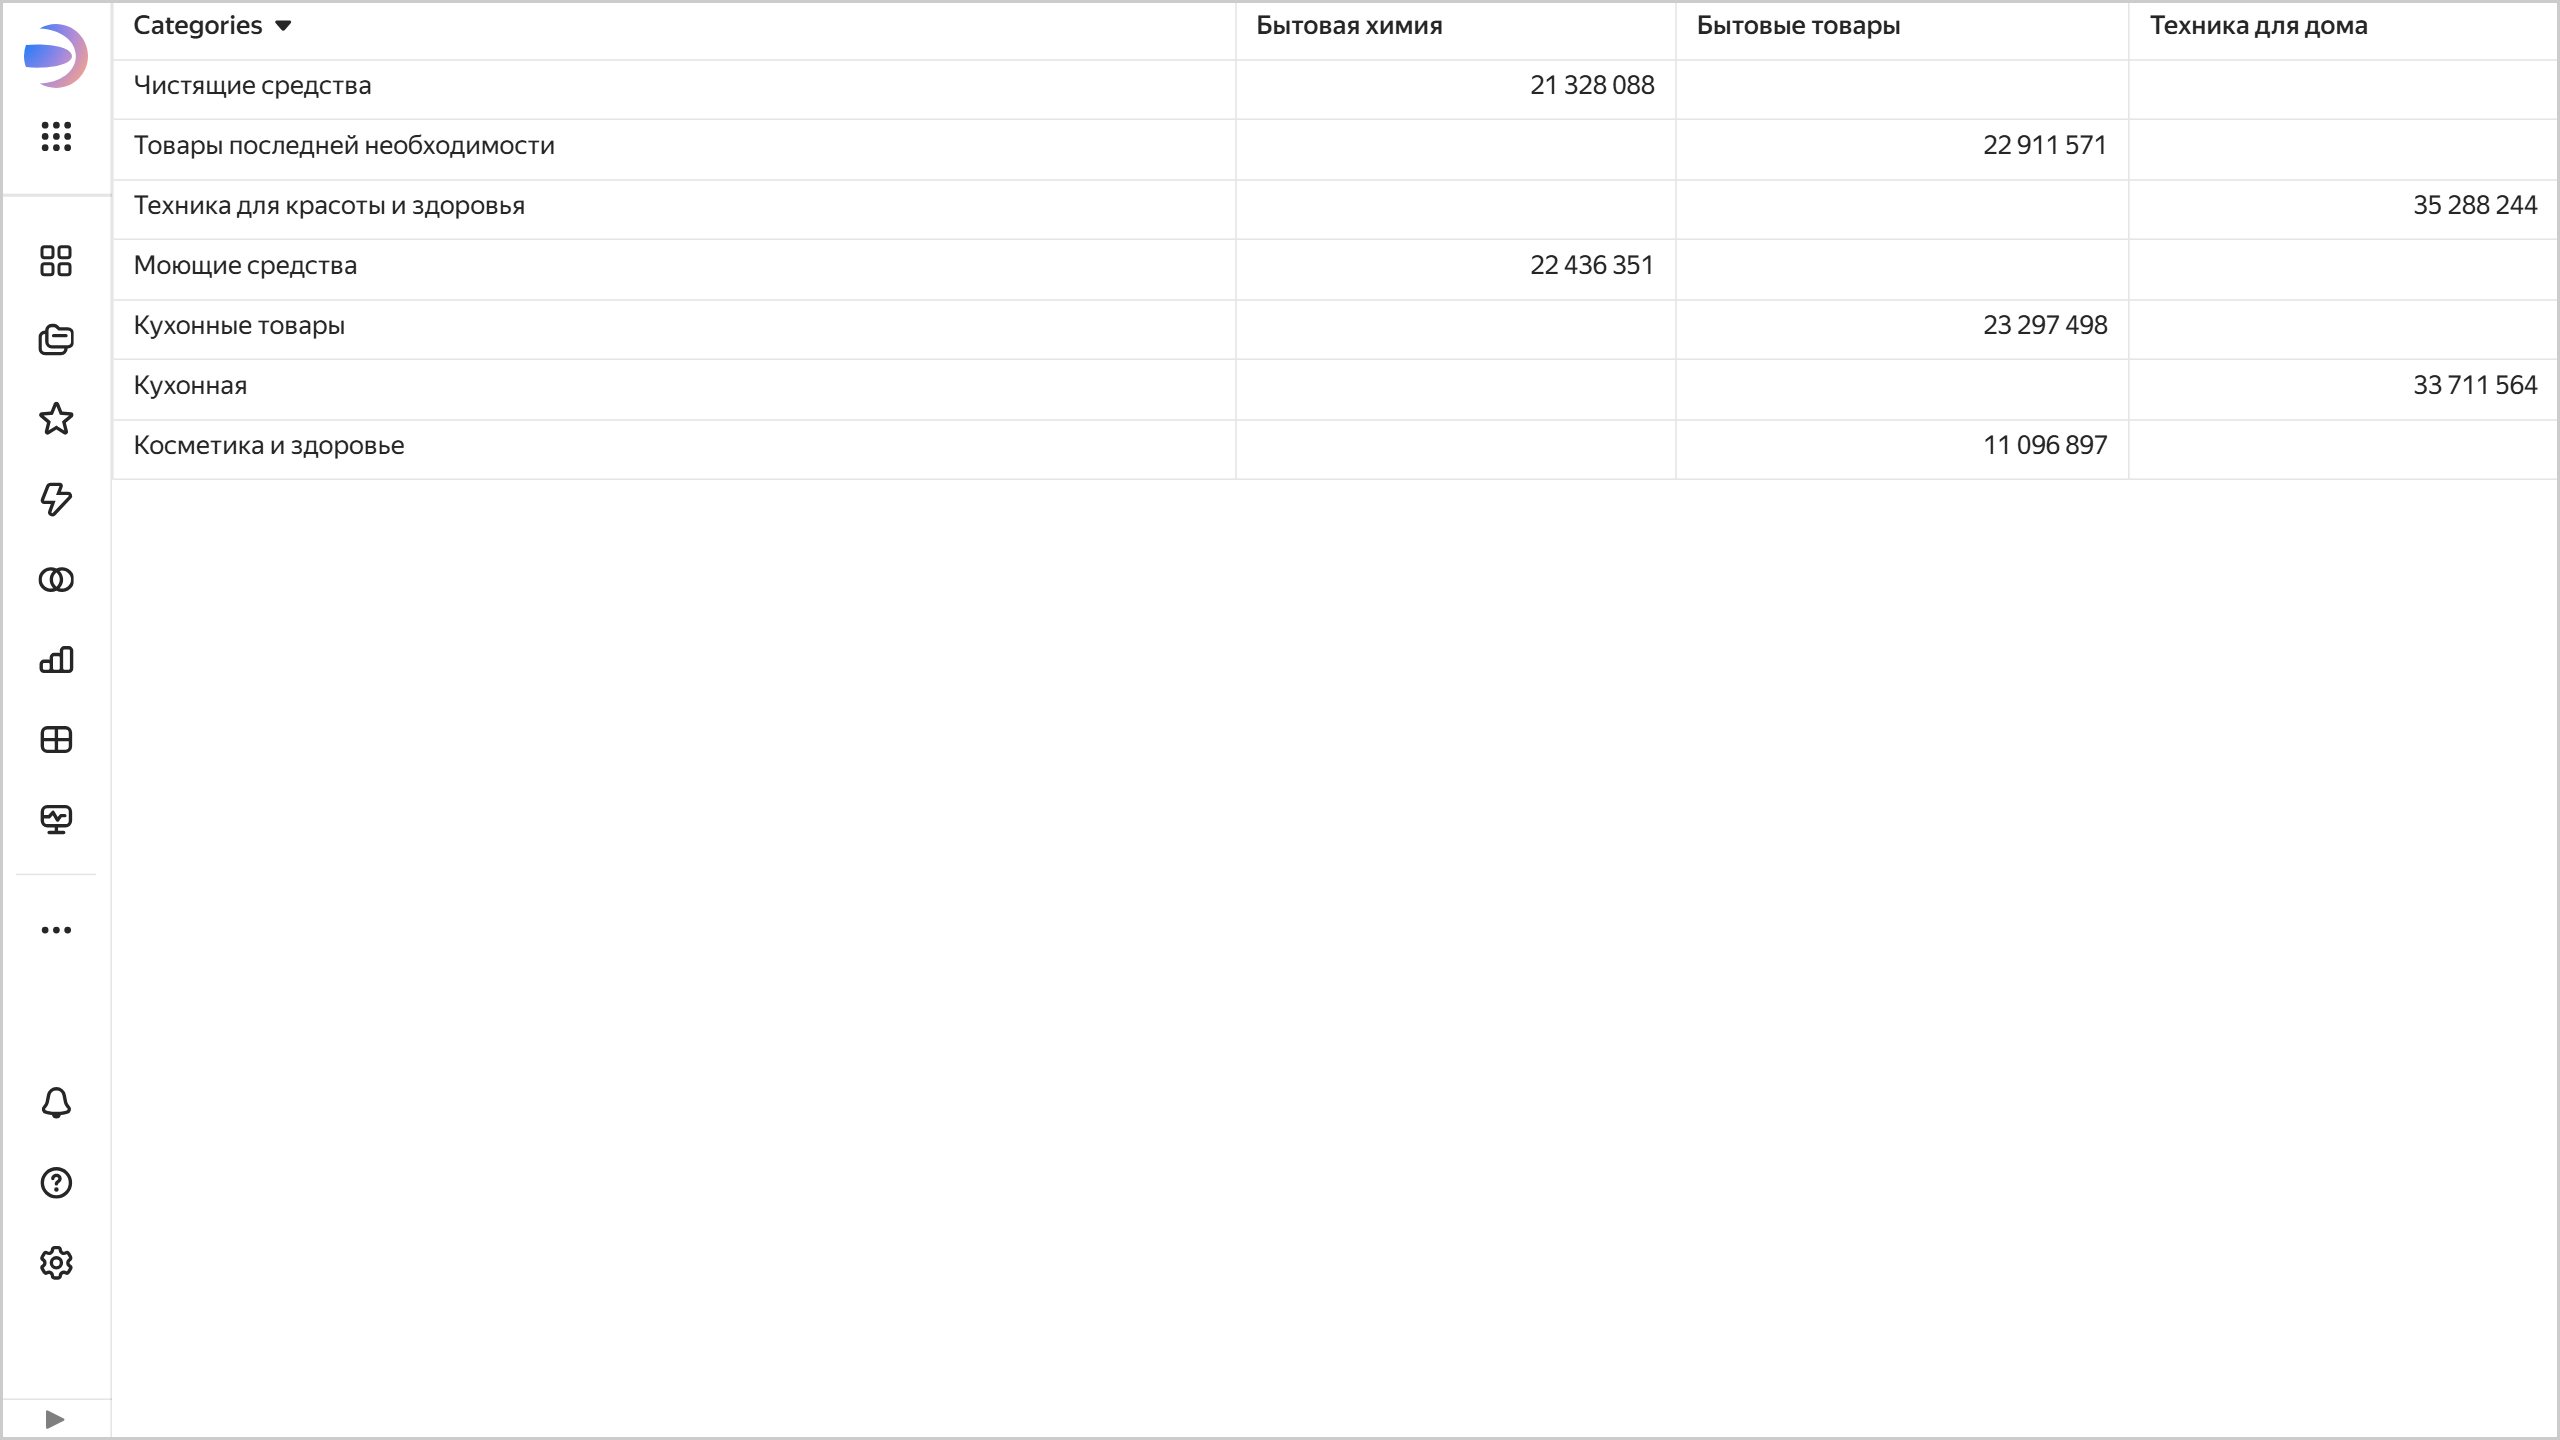
The page will display a table with dimensions and measures used to render the chart.
Displaying a chart as a table