Methods available in Editor
- Editor.generateHtml(arg)
- Editor.getActionParams()
- Editor.getCurrentPage()
- Editor.getId(arg)
- Editor.getLang()
- Editor.getLoadedData()
- Editor.getParam(name)
- Editor.getParams()
- Editor.getSortParams()
- Editor.getWidgetConfig()
- Editor.resolveInterval(arg)
- Editor.resolveOperation()
- Editor.resolveRelative(arg)
- Editor.setChartsInsights(args)
- Editor.setRawData(data)
- Editor.updateActionParams()
- Editor.updateParams(params)
- Editor.wrapFn(conf)
The supported methods include:
- Editor.generateHtml(arg)
- Editor.getActionParams()
- Editor.getCurrentPage()
- Editor.getId(arg)
- Editor.getLang()
- Editor.getLoadedData()
- Editor.getParam(name)
- Editor.getParams()
- Editor.getSortParams()
- Editor.getWidgetConfig()
- Editor.resolveInterval(arg)
- Editor.resolveOperation(args)
- Editor.resolveRelative(arg)
- Editor.setChartsInsights(args)
- Editor.setRawData(data)
- Editor.updateActionParams()
- Editor.updateParams(params)
- Editor.wrapFn(conf)
Editor.generateHtml(arg)
Generates secure HTML markup in a chart.
Supported HTML tags
aabbrbbrbuttoncaptioncircleclipPathcodedddefsdetailsdivdldl-tooltipdtellipseemfeComponentTransferfeDropShadowfeFuncAfeFuncBfeFuncGfeFuncRfeGaussianBlurfeOffsetfeMergefeMergeNodefiltergh1h2h3h4h5h6hriimglilinelinearGradientmarkermaskolppathpatternpolylinepolygonpreradialGradientrectsmallspanstopstrongsubsummarysupsvgtabletexttextPaththeadtitletbodytspantdthtruul
Supported tag attributes
altalignment-baselinearia-controlsaria-describedbyaria-expandedaria-haspopuparia-hiddenaria-labelaria-labelledbyaria-livearia-pressedaria-readonlyaria-roledescriptionaria-selectedclass1clip-pathclip-rulecolorcolspancursorcxcyddata-iddata-tooltip-contentdata-tooltip-placementdata-tooltip-anchor-iddata-tooltip-hide-delaydata-tooltip-open-delaydisableddominant-baselinedxdyfillfill-opacityfill-rulefilterfilterunitsflood-colorflood-opacityfont-familyfont-sizefont-weightfxfyheighthrefidinletter-spacingmasknameoffsetopacityorientoverflowpaddingpaint-orderpointer-eventspointspreserveaspectratiorrefXrefYrolerxryscopeslopesrcstddeviationstopstop-colorstop-opacitystrokestroke-dasharraystroke-dashoffsetstroke-linecapstroke-linejoinstroke-opacitystroke-widthresultrowspansummarytargettabindextext-aligntext-anchortext-decorationtitletransformtypevalignviewboxwidthxx1x2xlink:hrefxmlnsxmlns:xlinkyy1y2zindex
1 To avoid incompatibility in future updates, do not use service classes in the class attribute.
Supported chart types
Arguments
arg: String or JSON object in the following format:
{
  "tag": "<string>",
  "style": "<object>",
  "content": "<string> / <object> / <array_of_objects>"
}
Where:
-
tag(string): HTML tag type, required field. -
style(JSON object): Description of CSS properties in the following format:{ "key": "value" }Where:
key(string): CSS property name.value(string): CSS property value.
-
content(string, JSON object, array of objects): String, JSON object, or array of objects in the following format:{ "tag": "<string>", "style": "<object>", "content": "<string> / <object> / <array_of_objects>" }
Displaying a tooltip on hover
In the markup, you can use the special dl-tooltip tag with the following attributes:
-
data-tooltip-content(string, JSON object): Tooltip content. It is specified as a string or in the same way as theargargument. -
data-tooltip-placement(string): Tooltip location:top: Above the content.bottom: Under the content.left: To the left of the content.right: To the right of the content.
-
data-tooltip-open-delay(integer): Tooltip display delay, milliseconds. -
data-tooltip-hide-delay(integer): Tooltip hide delay, milliseconds.
Styles for color themes
CSS variables for each of the four color schemes are supported:
- Each variable must be defined for both the
lightanddarkthemes. - If their values are not defined for
light-hccontrast and/ordark-hccontrast themes, the values from the matching non-contrast themes will be used. - The variable name should start with the
--ce-themeprefix to avoid overriding the DataLens system variables and variables used in Gravity UI. - A variable only applies to the element inside which it is defined and its descendants.
Examples
Markup example
const result = {
tag: 'div',
style: {
display: 'flex',
'flex-direction': 'row',
},
content: [
{
tag: 'a',
style: {
display: 'inline-block',
'vertical-align': 'baseline',
width: '10px',
'margin-right': '10px',
},
attributes: {
href: 'https://ya.ru',
target: '_blank',
},
content: {
tag: 'img',
attributes: {
src: 'https://storage.yandexcloud.net/datalens-public-demo-assets/logo-new.svg',
width: '238',
height: '32',
},
styles: {
display: 'block',
},
},
},
{
tag: 'span',
style: {
'font-style': 'italic',
color: 'var(--g-color-text-info)',
'line-height': '1',
'margin-right': '10px',
},
content: 'some text',
},
{
tag: 'svg',
attributes: {
'xmlns': 'http://www.w3.org/2000/svg',
width: 16,
height: 16,
fill: 'var(--g-color-text-complementary)',
viewBox: '0 0 16 16',
},
content: {
tag: 'path',
attributes: {
d: 'M4.355.522a.5.5 0 0 1 .623.333l.291.956A4.979 4.979 0 0 1 8 1c1.007 0 1.946.298 2.731.811l.29-.956a.5.5 0 1 1 .957.29l-.41 1.352A4.985 4.985 0 0 1 13 6h.5a.5.5 0 0 0 .5-.5V5a.5.5 0 0 1 1 0v.5A1.5 1.5 0 0 1 13.5 7H13v1h1.5a.5.5 0 0 1 0 1H13v1h.5a1.5 1.5 0 0 1 1.5 1.5v.5a.5.5 0 1 1-1 0v-.5a.5.5 0 0 0-.5-.5H13a5 5 0 0 1-10 0h-.5a.5.5 0 0 0-.5.5v.5a.5.5 0 1 1-1 0v-.5A1.5 1.5 0 0 1 2.5 10H3V9H1.5a.5.5 0 0 1 0-1H3V7h-.5A1.5 1.5 0 0 1 1 5.5V5a.5.5 0 0 1 1 0v.5a.5.5 0 0 0 .5.5H3c0-1.364.547-2.601 1.432-3.503l-.41-1.352a.5.5 0 0 1 .333-.623zM4 7v4a4 4 0 0 0 3.5 3.97V7H4zm4.5 0v7.97A4 4 0 0 0 12 11V7H8.5zM12 6a3.989 3.989 0 0 0-1.334-2.982A3.983 3.983 0 0 0 8 2a3.983 3.983 0 0 0-2.667 1.018A3.989 3.989 0 0 0 4 6h8z',
},
},
},
],
};
...
title: Editor.generateHtml(result),
...
Markup example with template strings in chart
...
dataLabelsFormat: Editor.generateHtml({
tag: 'i',
content: '{point.yLabel}'
}),
...
Tooltip markup example
...
text: Editor.generateHtml({
tag: 'div',
content: [
{
tag: 'dl-tooltip',
content: 'Tooltip trigger 1',
attributes: {
'data-tooltip-content': {
tag: 'i',
content: 'Italic content',
},
'data-tooltip-placement': ['top']
}
},
{
tag: 'dl-tooltip',
content: 'Tooltip trigger 2',
style: { 'font-weight': 'normal' },
attributes: {
'data-tooltip-content': 'Hey!',
'data-tooltip-placement': 'right'
}
},
{
tag: 'div',
content: 'Without tooltip',
},
{
tag: 'dl-tooltip',
content: {
tag: 'img',
attributes: {
src: 'https://storage.yandexcloud.net/datalens-public-demo-assets/logo-new.svg',
width: 238,
height: 32,
},
style: {
'display': 'inline-block',
'vertical-align': 'middle',
},
},
attributes: {
'data-tooltip-content': {
tag: 'a',
attributes: {
href: 'https://ya.ru',
},
content: 'go to link',
style: {
'display': 'inline-block',
'vertical-align': 'middle',
},
},
'data-tooltip-placement': 'bottom'
},
style: {
'display': 'inline-block',
'vertical-align': 'middle',
},
},
{
tag: 'dl-tooltip',
content: {
tag: 'a',
attributes: {
href: 'https://ya.ru',
},
style: {
'display': 'inline-block',
'vertical-align': 'middle',
},
content: [{
tag: 'img',
attributes: {
src: 'https://storage.yandexcloud.net/datalens-public-demo-assets/logo-new.svg',
width: 238,
height: 32,
},
style: {
'display': 'inline-block',
'vertical-align': 'middle',
},
}],
},
style: {
'display': 'inline-block',
'vertical-align': 'middle',
'margin-left': '20px',
},
attributes: {
'data-tooltip-content': {
tag: 'img',
attributes: {
src: 'https://storage.yandexcloud.net/datalens-public-demo-assets/logo-new.svg',
},
content: 'some image desc',
},
'data-tooltip-placement': 'bottom'
}
},
]
}),
...
Example of markup with descriptions of styles for various color themes
module.exports = {
title: {
text: Editor.generateHtml({
tag: 'div',
content: [
{
tag: 'div',
theme: {
dark: {
'--ce-theme-bg': 'purple',
'--ce-theme-text': 'yellow',
},
light: {
'--ce-theme-bg': 'pink',
'--ce-theme-text': 'orange',
},
},
style: {
'background-color': 'var(--ce-theme-bg)',
},
content: {
tag: 'div',
style: {
color: 'var(--ce-theme-text)',
},
content: 'I can use --ce-theme-text variable',
},
},
{
tag: 'div',
style: {
color: 'var(--ce-theme-text)',
},
content: 'I cannot use --ce-theme-text variable',
},
]
}),
},
};
Example of markup with descriptions of styles for various color themes (Option 2)
module.exports = {
title: {
text: Editor.generateHtml({
tag: 'div',
style: {
'display': 'flex',
'flex-direction': 'column',
'align-items': 'center'
},
theme: {
dark: {
'--ce-theme-bg': '#BF90EE',
'--ce-theme-text': '#F5D629',
},
light: {
'--ce-theme-bg': '#9658D5',
'--ce-theme-text': '#26FFD9',
},
},
content: [
{
tag: 'div',
style: {
'margin-bottom': '10px',
},
content: 'Use settings to switch the theme',
},
{
tag: 'div',
style: {
'width': '100%',
'height': '300px',
'background-color': 'var(--ce-theme-bg)',
'color': 'var(--ce-theme-text)',
'text-align': 'center',
'display': 'flex',
'justify-content': 'center',
'align-items': 'center',
},
content: 'Some text',
},
]
}),
},
};
Editor.getActionParams()
Returns an object with normalized filtering (action) parameters.
Supported chart types
Arguments
None.
Returned result
JSON object in the following format:
{
  "key": "value"
}
Where:
key(string): Parameter name.value(array of strings): Values of parameters used by the current chart for filtering.
Note
You can use numeric or logical values for parameters in your charts. Then value will contain an array of values of these types. However, dashboard parameters are provided only as strings. Therefore, we recommend always reducing parameter values to a string or an array of strings to avoid data presentation inconsistencies in different widget states.
Tip
To enable debugging in filtering parameters mode, add the _action_params parameter set to 1 to the page URL.
Example
Filtering parameters were applied to the chart: the filtering element was clicked, or a parameter was specified in the chart URL with the following prefix:
_ap_City=Moscow
Params tab contents:
module.exports = {
"Year": "2024",
"City": ["Moscow", "Sochi"]
};
Prepare tab contents:
const actionParams = Editor.getActionParams();
Value of the actionParams variable after running the Prepare tab:
{
"City": ["Moscow"]
}
Chart examples
Example of cross-filtering: Clicking the advanced chart on the left filters Markdown on the right.
Editor.getCurrentPage()
Returns the current page number value in a table with pagination enabled.
Supported chart types
Arguments
No.
Returned result
Number corresponding to page number.
Example
Config tab contents:
module.exports = {
paginator: {
enabled: true,
limit: 5
}
};
Prepare tab contents:
const page = Editor.getCurrentPage();
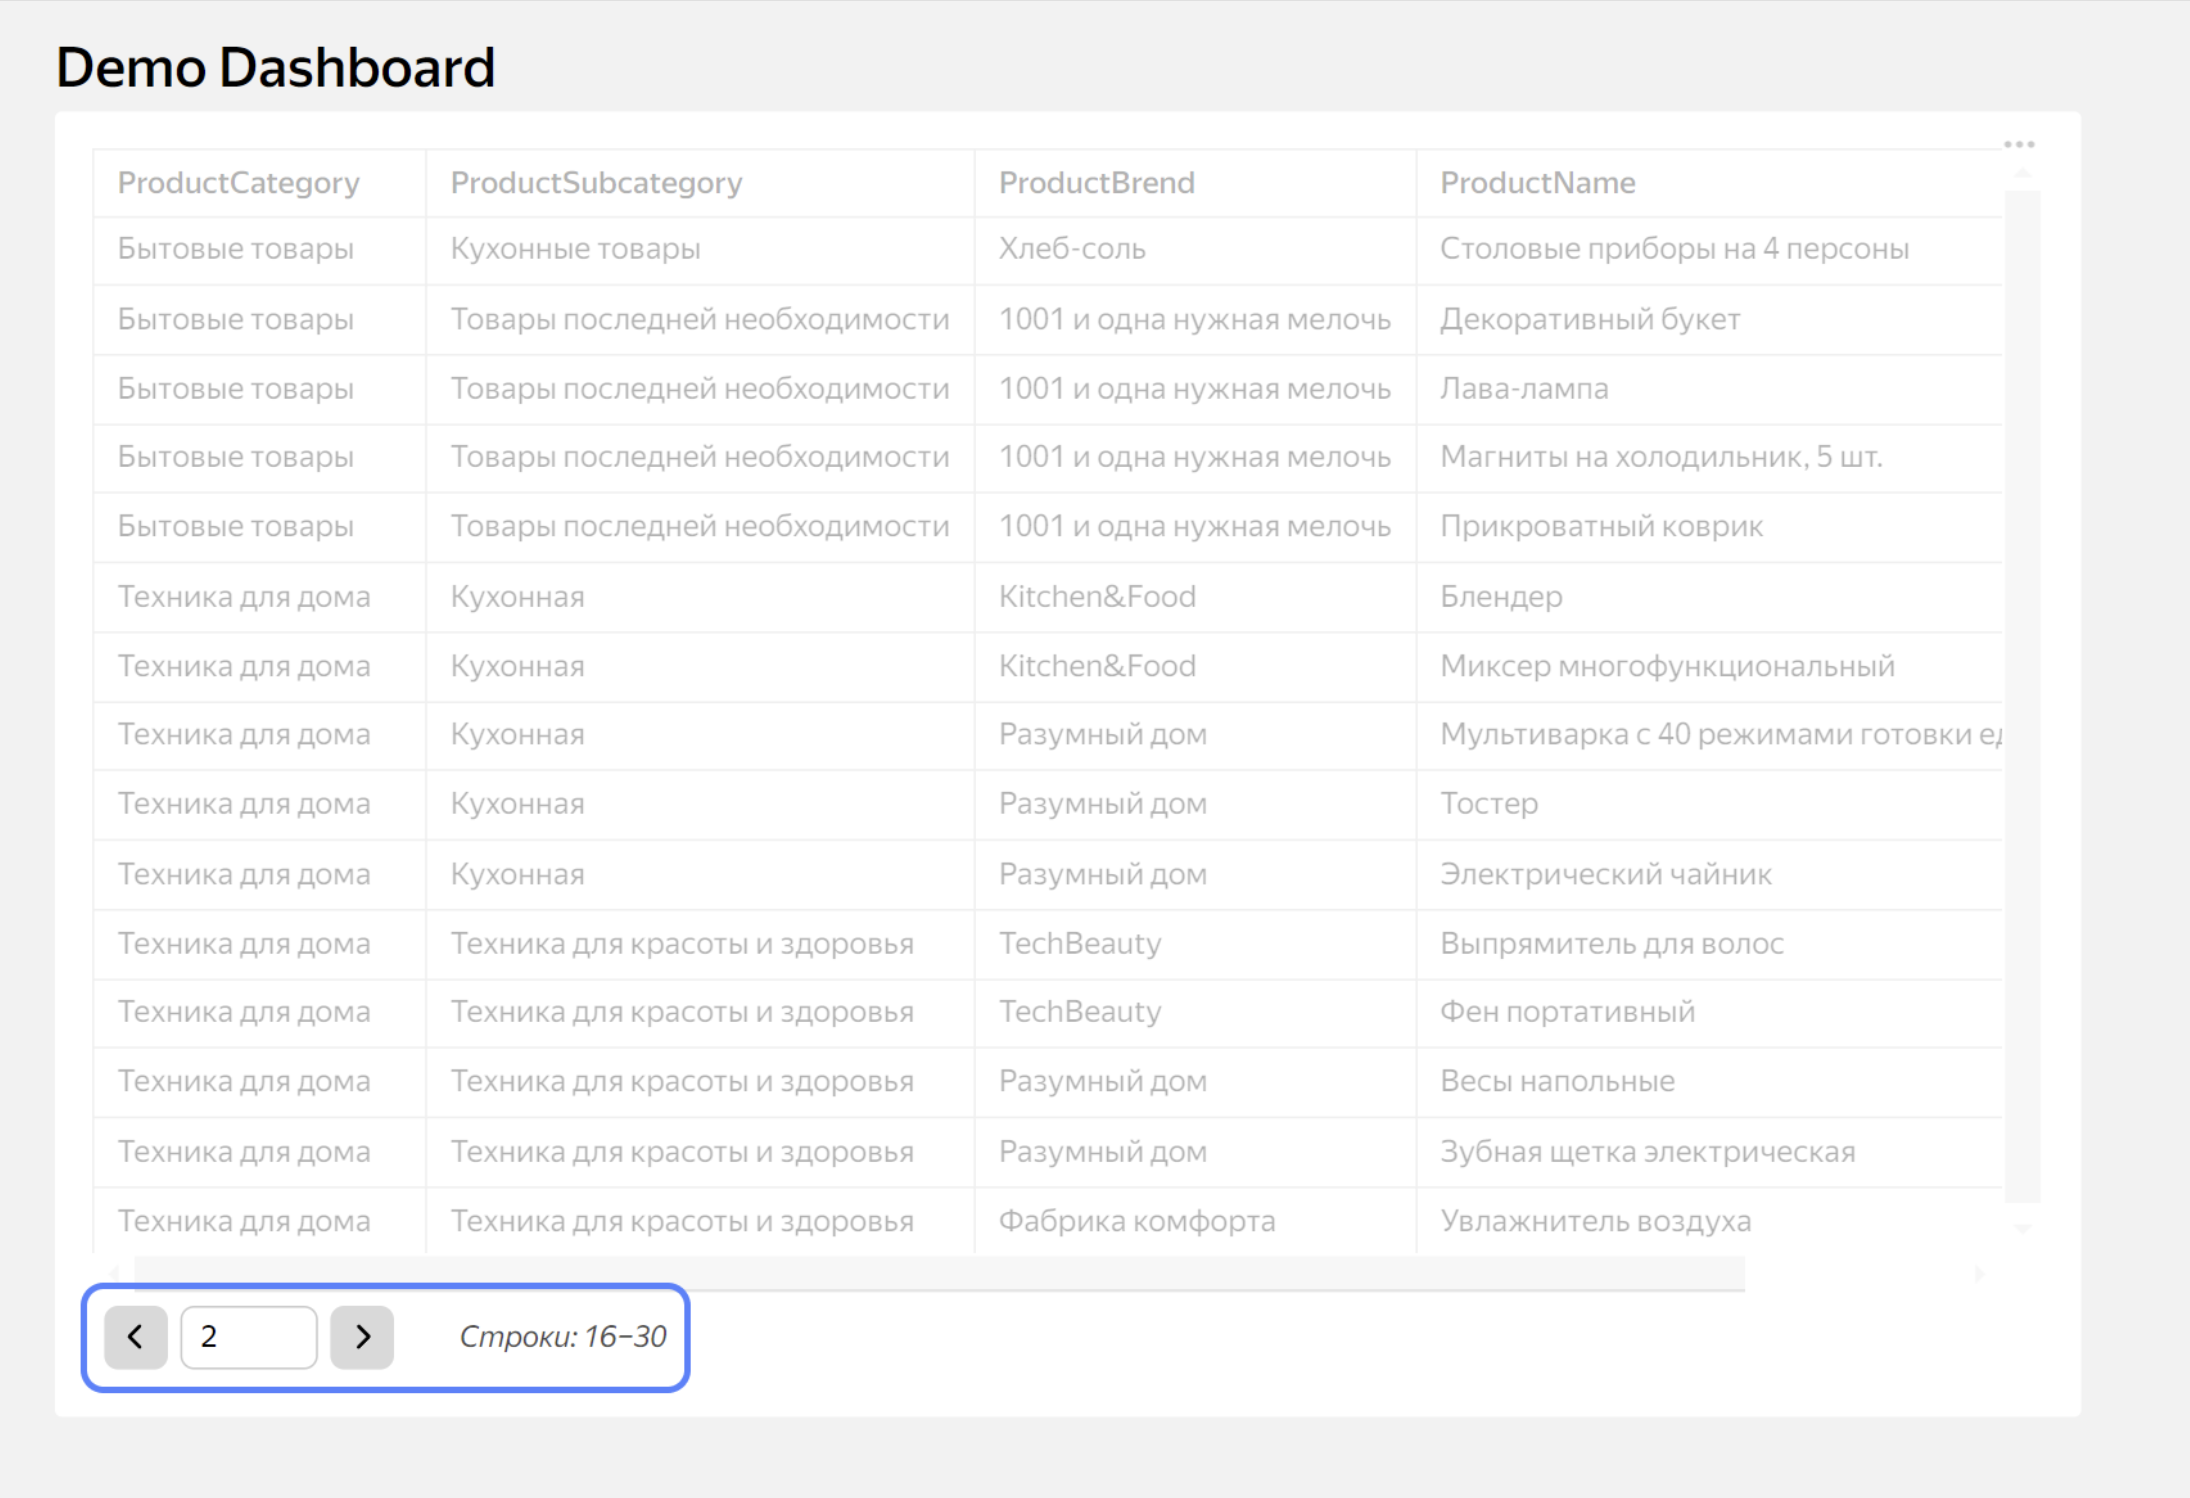
Chart examples
Example of a chart with pagination and sorting
Editor.getId(arg)
Returns the object id from the links field in the Meta tab.
Supported chart types
All.
Arguments
arg (string): String with the key name (alias) in the links object on the Meta tab.
Returned result
String with the id value.
Example
Meta tab contents:
{
"links": {
"myBestDataset": "tlzr1t5kto9cg"
}
}
Sources tab contents, where a value is obtained from the Meta tab:
module.exports = {
'myDatasetSource': {
datasetId: Editor.getId('myBestDataset'),
data: {
fields: [
{
ref: {
type: "title",
title: "PaymentType",
},
},
{
ref: {
type: "title",
title: "OrderYear",
},
},
{
ref: {
type: "title",
title: "OrderMonth",
},
},
],
},
},
};
Editor.getLang()
Returns a string with the language specified in the current user settings.
Supported chart types
All.
Arguments
No.
Returned result
A string corresponding to the language specified in the user settings: "ru" or "en".
Example
Prepare tab contents:
const lang = Editor.getLang();
Value of the lang variable after running the Prepare tab with the current user language set to ru:
["ru"]
Editor.getLoadedData()
Returns an object with data requested on the Sources tab.
Supported chart types
All.
Arguments
No.
Returned result
Depends on data source and visualization type.
Example
Example for the table with source based on a dataset.
Sources tab contents:
const {buildSource} = require('libs/dataset/v2');
const datasetId = Editor.getId('myDatasetKeyName');
module.exports = {
'myChartDataSource': buildSource({
id: datasetId,
columns: ['Year', 'Country', 'City'],
where,
order_by: [{
direction: 'ASC',
column: 'Year',
}],
}),
};
Prepare tab contents:
const data = Editor.getLoadedData();
Value of the data variable after running the Prepare tab:
{
"travelSet": {
"result": {
"data": {
"Data": [
[
"2013",
"Russia",
"Moscow"
],
[
"2014",
"Russia",
"Sochi"
]
],
"Type": [
"ListType",
[
"StructType",
[
[
"Year",
[
"OptionalType",
[
"DataType",
"Int64"
]
]
],
[
"Country",
[
"OptionalType",
[
"DataType",
"String"
]
]
],
[
"City",
[
"OptionalType",
[
"DataType",
"String"
]
]
]
]
]
]
},
"query": "SELECT `A`, `D`, `C`\n LIMIT 1000001",
"data_export_forbidden": false,
"fields": [
{
"guid": "34ca4a89-f609-4e00-83af-4ae0********",
"title": "DateStart",
"data_type": "date",
"calc_mode": "direct"
},
{
"guid": "50927ab0-3a7e-11ec-965f-71d2********",
"title": "Year",
"data_type": "integer",
"calc_mode": "formula"
},
{
"guid": "13dbfc8f-b649-4201-b3d0-fb8b********",
"title": "City",
"data_type": "string",
"calc_mode": "direct"
},
{
"guid": "d079937f-6bc4-4133-9171-4009********",
"title": "Country",
"data_type": "string",
"calc_mode": "direct"
}
]
}
}
}
Chart examples
Example of using Editor.getLoadedData() in a dataset-based table
Editor.getParam(name)
Returns a normalized value of the parameter with name for name.
Supported chart types
All.
Arguments
name (string): Parameter name.
Returned result
Array of strings that returns the parameter value.
Example
Example for the table with source based on a dataset.
Params tab contents:
module.exports = {
"Year": "2024",
"City": ["Moscow", "Sochi"]
};
Prepare tab contents:
const params = Editor.getParam('Year');
Value of the params variable after running the Prepare tab:
["2024"]
Chart examples
Example of a chart accessing a parameter by name
Editor.getParams()
Returns an object with normalized parameters.
Supported chart types
All.
Arguments
No.
Returned result
JSON object in the following format:
{
  "key": "value"
}
Where:
key(string): Parameter name.value(array of strings): Parameter values.
Note
You can use numeric or logical values for parameters in your charts. Then value will contain an array of values of these types. However, dashboard parameters are provided only as strings. Therefore, we recommend always reducing parameter values to a string or an array of strings to avoid data presentation inconsistencies in different widget states.
Example
Example for the table with source based on a dataset.
Params tab contents:
module.exports = {
    "Year": "2024",
    "City": ["Moscow", "Sochi"]
};
Prepare tab contents:
const params = Editor.getParams();
Value of the params variable after running the Prepare tab:
{
"Year": ["2024"],
"City": ["Moscow", "Sochi"]
}
Chart examples
Example of using the function for getting all applied parameters
Editor.getSortParams()
Returns an object with the sorting options in the table.
Supported chart types
Arguments
No.
Returned result
JSON object in the following format:
{
"columnId": "<string>",
"order": "<numer> | <string>"
}
Where:
-
columnId(row): Column ID, e.g.,0_0_1_id=date_name=Date. -
order(number or row): Sorting order. The possible values are:1: Sorting in ascending order.-1: Sorting in descending order.__special_value__NaN: No sorting.
Example
Example for the table with source based on a dataset.
Sources tab contents:
const sort_params = Editor.getSortParams();
Object with sorting parameters after executing the Sources tab:
{
"columnId": "_id=ProductCategory_name=ProductCategory",
"order": -1
}
Chart examples
Example of a chart with pagination and sorting
Editor.getWidgetConfig()
Returns the current widgets settings from a dashboard or report. Can be used to debug custom chart display issues when filtering by that chart.
Supported chart types
Arguments
No.
Returned result
JSON object in the following format:
{
"widgetConfig": {
...
"actionParams": {
"enable": "<boolean>",
"fields": "<string[]>"
}
}
}
Where:
-
actionParams: Settings for chart filtering by chart:enable(Boolean): Filtering enabled flag.fields(array of strings): Fields the chart uses for filtering.
Example
Example for the table with source based on a dataset.
Config tab contents:
module.exports = {
events: {
click: {
handler: [{type: 'setActionParams'}],
scope: 'point',
},
},
};
Prepare tab contents:
const seriesData = [
[
{
y: 5,
custom: {actionParams: {'Apples': 'John'}},
},
{
y: 3,
custom: {actionParams: {'Oranges': 'John'}},
},
{
y: 4,
custom: {actionParams: {'Pears': 'John'}},
},
{
y: 7,
custom: {actionParams: {'Grapes': 'John'}},
},
{
y: 2,
custom: {actionParams: {'Bananas': 'John'}},
},
],
[
{
y: 2,
custom: {actionParams: {'Apples': 'Jane'}},
},
{
y: 2,
custom: {actionParams: {'Oranges': 'Jane'}},
},
{
y: 3,
custom: {actionParams: {'Pears': 'Jane'}},
},
{
y: 2,
custom: {actionParams: {'Grapes': 'Jane'}},
},
{
y: 1,
custom: {actionParams: {'Bananas': 'Jane'}},
},
],
[
{
y: 3,
custom: {actionParams: {'Apples': 'Joe'}},
},
{
y: 4,
custom: {actionParams: {'Oranges': 'Joe'}},
},
{
y: 4,
custom: {actionParams: {'Pears': 'Joe'}},
},
{
y: 2,
custom: {actionParams: {'Grapes': 'Joe'}},
},
{
y: 5,
custom: {actionParams: {'Bananas': 'Joe'}},
},
]
];
const widgetSettings = Editor.getWidgetConfig();
if ('widgetConfig' in widgetSettings && 'enable' in widgetSettings.widgetConfig) {
Editor.updateConfig({title: ...});
}
module.exports = {
graphs: [
{
name: 'John',
data: seriesData[0],
},
{
name: 'Jane',
data: seriesData[1],
},
{
name: 'Joe',
data: seriesData[2],
},
],
categories: ['Apples', 'Oranges', 'Pears', 'Grapes', 'Bananas'],
};
If filtering by chart is enabled on the dashboard, running in widgetSettings will return a configuration with the active filtering setting.
Editor.resolveInterval(arg)
Converts a time interval to a pair of values representing the interval start and end points.
Supported chart types
All.
Arguments
arg (string): String in the interval format.
Returned result
{from, to} object, where from/to is an ISO date if the string matches the format; otherwise, null.
Example
// current time: 2020-02-26T07:05:52.552Z
const {from, to} = Editor.resolveInterval('__interval___relative_-1y___relative_+10d_eM');
// from === 2019-02-26T00:00:00.000Z
// to === 2020-03-31T23:59:59.999Z
// current time: 2020-02-26T07:05:52.552Z
const interval = Editor.resolveInterval('__interval_2019-01-01T07:08:25.941Z___relative_+1h');
// interval.from === 2019-01-01T07:08:25.941Z
// interval.to === 2020-02-26T08:05:52.552Z
// current time: 2020-02-26T07:05:52.552Z
const interval = Editor.resolveInterval('__interval_2020.01.15___relative_-0d');
// interval === null
Note: Start and end of the interval specified in the Params tab or in the URL will be automatically processed by the helper method for the relative date. However, if the interval start/end value does not match the relative date format, the original value will be returned instead of null.
Here is an example:
Params tab:
module.exports = {
first: '__interval_2020-01-01T12:30:11.324Z___relative_+1d',
second: '',
incorrect: '__inteval_01.01.2020___relative_-1d'
}
URL parameters: ...?second=__interval___relative_-1y_eQ_2021
// current time: 2020-02-20T12:30:11.324Z
const params = Editor.getParams();
// params === {
// first: ['__interval_2020-01-01T12:30:11.324Z_2020-02-21T23:59:59.999Z'],
// second: ['__interval_2019-03-31T23:59:59.999Z_2021'],
// incorrect: ['__inteval_01.01.2020___relative_-1d']
// }
Editor.resolveOperation()
An operation returns a parameter value as a special value. To streamline further operations with that value, you can use this method, which converts the value to the parameter and operation.
Supported chart types
All.
Arguments
No.
Example
Example for the table with source based on a dataset.
Prepare tab contents:
Editor.resolveOperation("__gt_42");
operation: "GT",
value: "42",
Editor.resolveRelative(arg)
Takes a string in relative date format and returns an ISO date if the string matches the format; otherwise, returns null.
Supported chart types
All.
Arguments
arg (string): String in relative date format.
Returned result
ISO date if the provided arg argument matches the format; otherwise, null.
Example
// current time: 2020-02-18T09:14:56.123Z
const date = Editor.resolveRelative('__relative_-7d');
// date === 2020-02-11T00:00:00.000Z
// current time: 2020-02-18T09:14:56.123Z
const date = Editor.resolveRelative('__relative_+30m_sh');
// date === 2020-02-18T09:00:00.000Z
const date = Editor.resolveRelative('2020-01-01');
// date === null
Note: Relative dates specified in the Params tab or in the URL will be automatically processed by the helper method. However, if the parameter value does not match the relative date format, the original value will be returned instead of null.
Here is an example:
Params tab:
module.exports = {
date_min: '2020-01-01',
date_max: '__relative_+1d_sw',
incorrect: '_relative_d1',
}
URL parameters: ...?date_min=__relative_-7d
// current time: 2020-02-20T12:30:11.324Z
const params = Editor.getParams();
// params === {
// date_min: ['2020-02-13T00:00:00.000Z'],
// date_max: ['2020-02-17T00:00:00.000Z'],
// incorrect: ['_relative_d1']
// }
Editor.setChartsInsights(args)
Adds a notification to a chart.
Supported chart types
All.
Arguments
args: Array of JSON objects in the following format:
{
"title": "<string>",
"message": "<string>",
"level": "<string>",
"locator": "<string>",
}
Where:
-
title(string): Notification title. -
message(string): Notification text in Markdown. -
level(string): Notification type:info: Notewarning: Warningcritical: Restriction
The type of notification determines its priority and the icon displayed. If more than one notification has been added to the chart, only one of them will have its icon shown in collapsed view.
-
locator(string): Unique ID for each notification within the chart.
Example
Prepare tab contents:
Editor.setChartsInsights([
{
title: 'markdown',
message: 'Use [markdown](https://yandex.cloud/en/docs/datalens/charts/editor/widgets/markdown)',
level: 'critical',
locator: '1'
},
{
title: 'List',
message: 'Use a separator to move to a new line \\n \n- one\n- two\n- three',
level: 'info',
locator: '4'
},
{
title: 'Table',
message: 'Header | Header \n:--- | :--- |\nText | Text ',
level: 'warning',
locator: '2'
},
{
title: 'Attention',
message: 'The data will be unavailable during tomorrow's drill',
level: 'critical',
locator: 'qaz'
}
]);
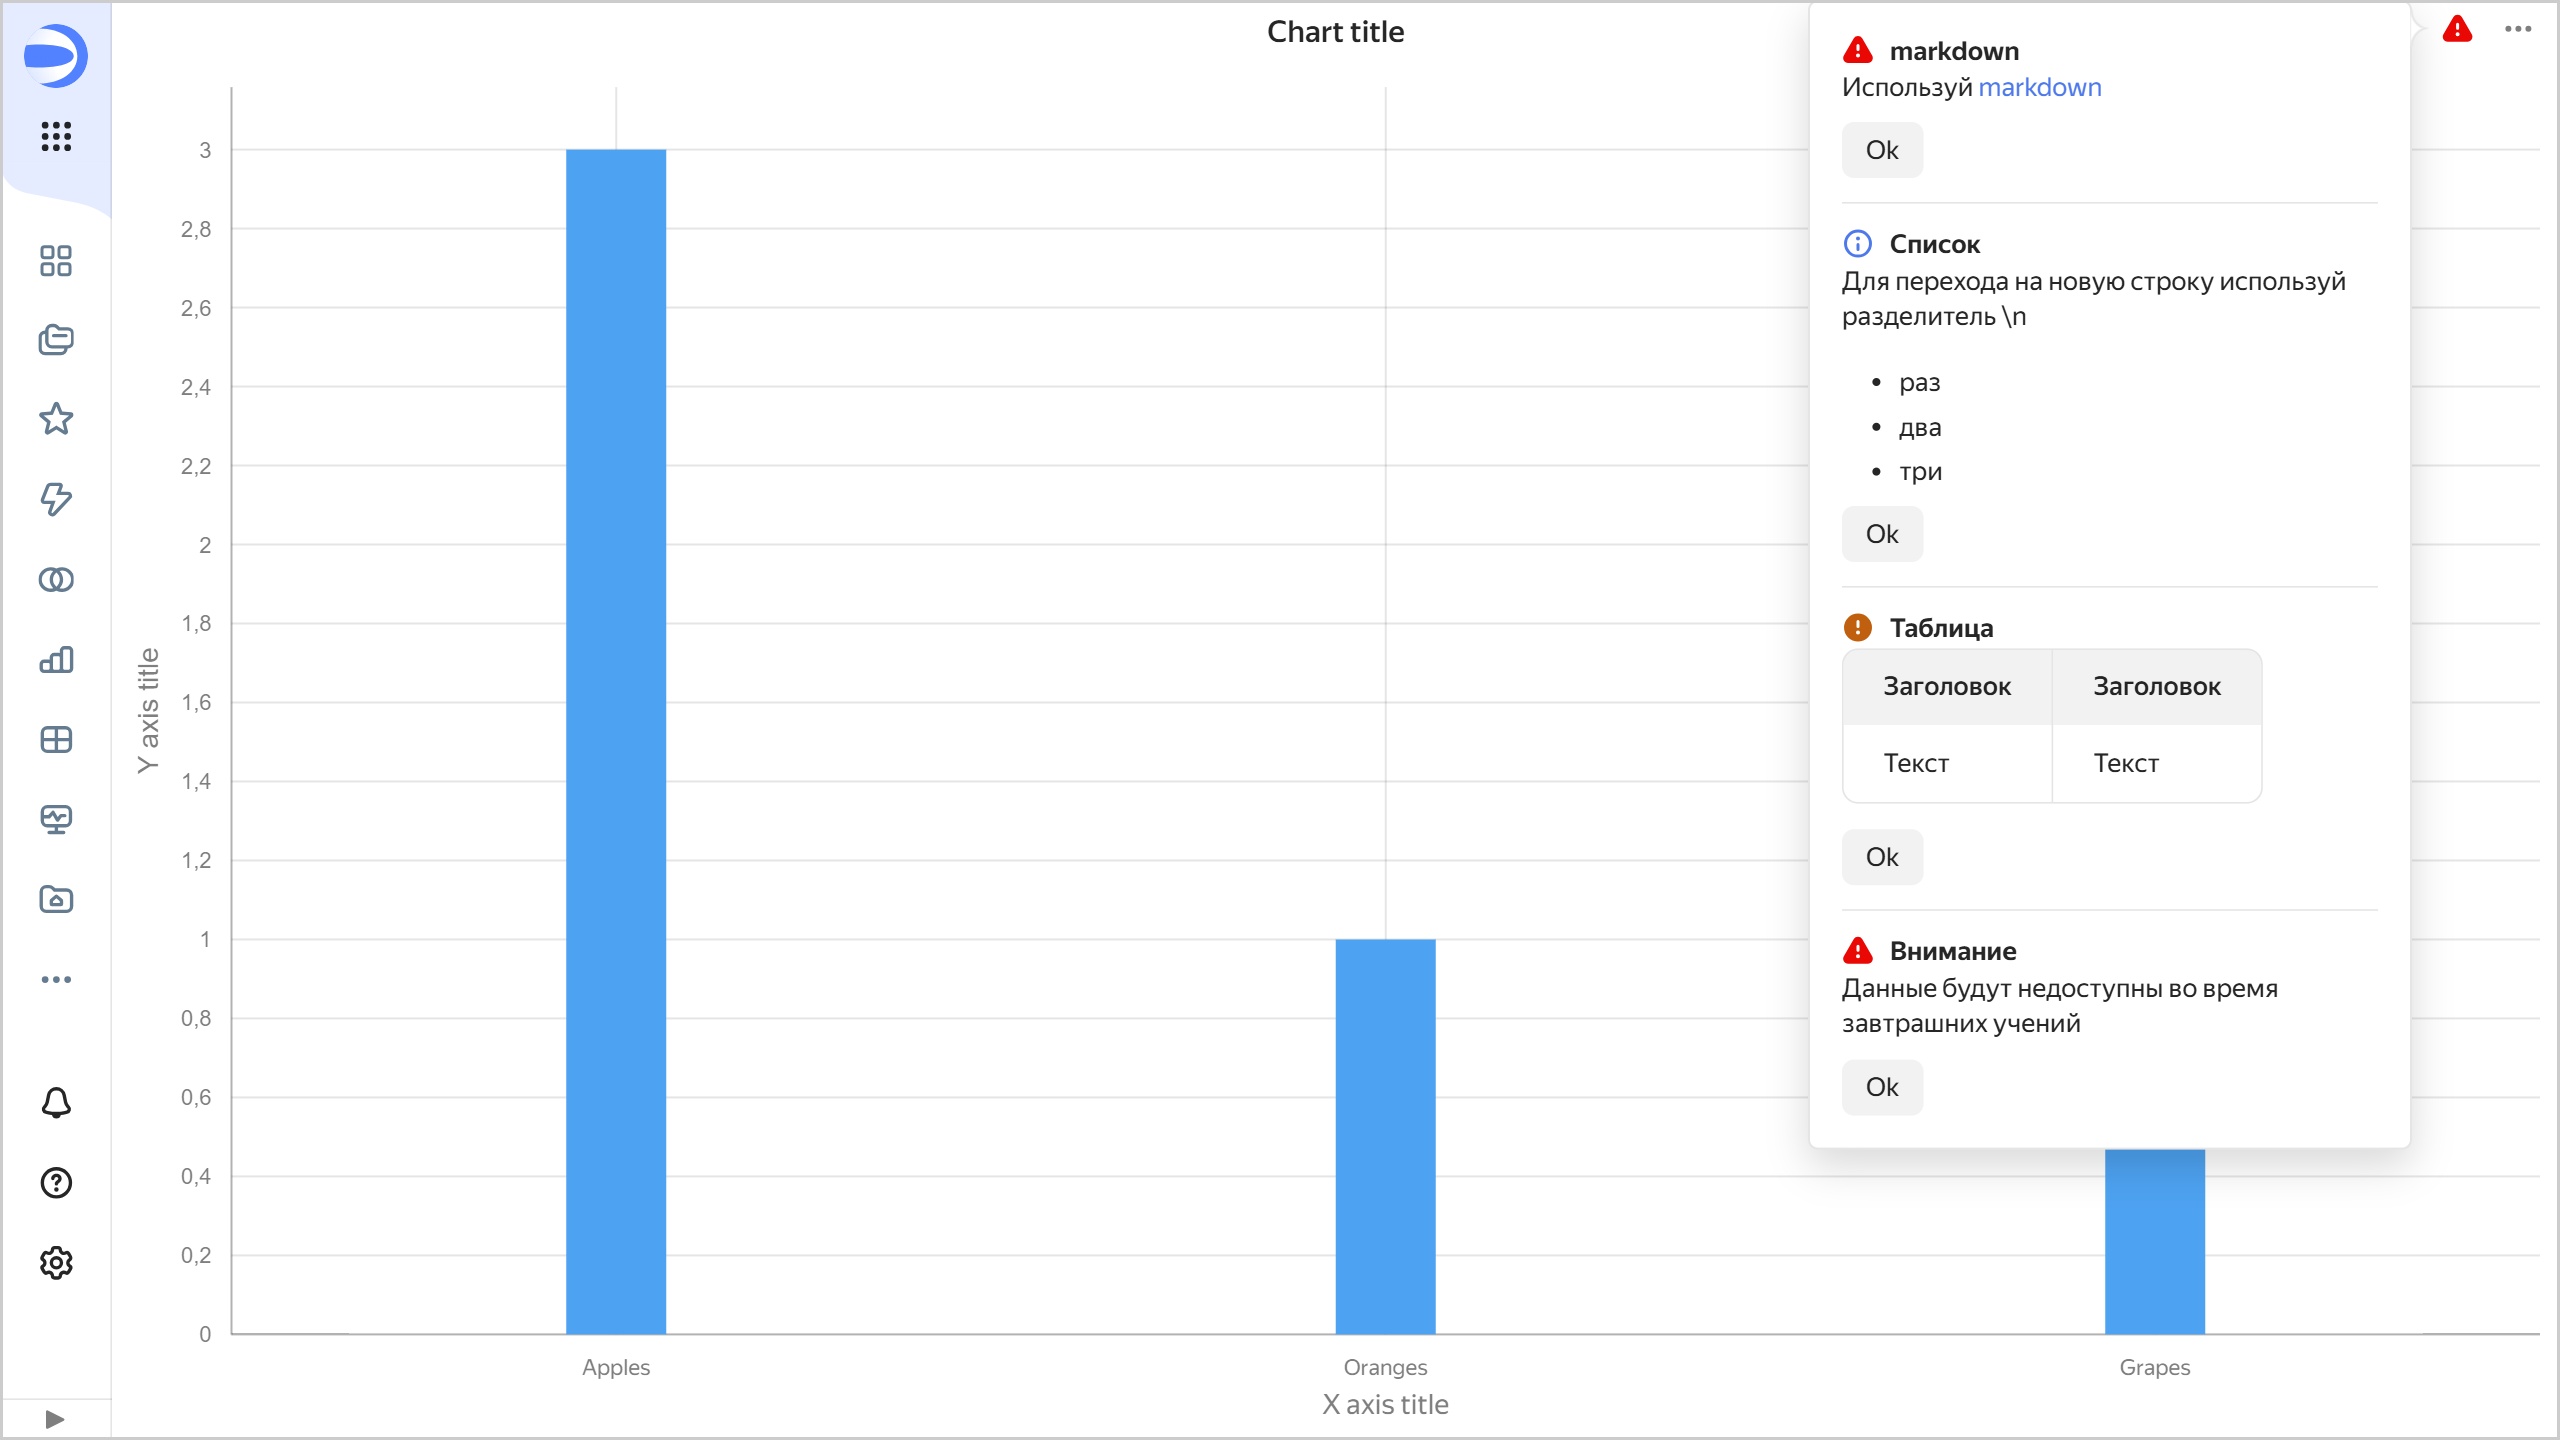
Chart examples
Example of a chart with notifications
Editor.setRawData(data)
Specifies structured chart data. It is used for the following two tasks:
- Exporting advanced chart data to CSV, XLSX, and Markdown. Without calling this method, export is unavailable for advanced charts.
- Using Neuroanalyst. If set, Neuroanalyst will use this data instead of parsing the chart's HTML markup.
Supported chart types
Arguments
data (array): Array with data. Supported formats are:
- Array of objects:
[{x: 1, y: 2}, ...] - Array of arrays (matrix):
[["header1", "header2"], [1, 2], ...] - Array of primitives:
[1, 2, 3]
Returned result
No.
Example
Prepare tab contents:
const data = [
{x: 1, y: 10},
{x: 2, y: 20},
{x: 3, y: 30},
];
Editor.setRawData(data);
module.exports = {
render: Editor.wrapFn({
fn: function() {
return 'Hello world';
},
}),
};
Editor.updateActionParams()
Updates an object with filtering (action) parameters.
Supported chart types
Arguments
JSON object in the following format:
{
"key": "value"
}
Where:
key(string): Parameter name.value(array of strings): Values of parameters used by the current chart for filtering.
Note
You can use numeric or logical values for parameters in your charts. Then value will contain an array of values of these types. However, dashboard parameters are provided only as strings. Therefore, we recommend always reducing parameter values to a string or an array of strings to avoid data presentation inconsistencies in different widget states.
Returned result
No.
Example
Params tab contents:
module.exports = {
"Year": "2024",
"City": ["Moscow", "Sochi"]
};
Prepare tab contents:
const actionParams = Editor.updateActionParams({"City": "Moscow"});
Values of filtering parameters (via Editor.getActionParams) after running the Sources tab:
{
  "City": ["Moscow"]
}
Chart examples
Example of cross-filtering: Clicking the advanced chart on the left filters Markdown on the right.
Editor.updateParams(params)
Extends the definition of the chart parameters with the params argument.
We do not recommend updating parameters inside charts and controls as this may cause issues with components and related items. However, as an option of last resort, you can use this method instead of mutating the original params object. If there is a mutation, chart stability is not guaranteed.
Supported chart types
All.
Note
Recommended only for controls.
Arguments
params: JSON object in the following format:
{
  "key": "value"
}
Where:
key(string): Parameter name.value(array of strings): Parameter values. Single values are also transmitted within the array.
Example
module.exports = {
    paramA: '1',
    paramB: 'Value 1',
}
const {paramA} = Editor.getParams();

const currentParamA = Number(paramA[0]);

Editor.updateParams({paramB: [`${currentParamA}` value]})

module.exports = [
    {
        type: 'button',
        label: 'Change value',
        theme: 'action',
        onClick: {
            action: 'setParams',
            args: {
                paramA: [currentParamA > 2 ? 1 : currentParamA + 1]
            }
        },
        updateOnChange: true,
    },
    {
        type: 'select',
        param: 'paramB',
        content: ['Value 1', 'Value 2', 'Value 3'],
    }
];
Each time you click the button, it cycles through these values: Value 1, Value 2, Value 3.
The initial values are: paramA: '1' and paramB: 'Value 1'.
After you click the button on the Controls tab, paramA increases by 1. If its value is greater than 2, it gets set to 1. The paramB value changes with the help of the Editor.updateParams() method to ${currentParamA} value, where ${currentParamA} is the current paramA value.
After this, the selector will be redrawn based on the current paramB value.
Editor.wrapFn(conf)
Function for generating a chart handler; it runs in a sandboxed browser with limited access to the browser API. Avoid resource-intensive calculations that may cause lags in the chart display. Also, minimize the information provided in args.
The Editor.wrapFn function is sensitive to syntax errors. So if you have issues when using the function, check your syntax first.
Time limits on the execution of the Editor.wrapFn function:
- One function: 100 milliseconds.
- One Advanced chart function: 1.5 seconds.
- Total execution time of all functions of one chart: 3 seconds.
Supported chart types
All.
Arguments
conf: Object in the following format:
fn: function(highchartsArgs1, …, highchartsArgsN, arg1, …, argN) {
    ...
},
args: [arg1, …, argN],
libs: [lib1, …, libN],
Where:
-
fn: Handler function. It cannot be a link or contain links to external variables (including functions). -
args: Array of arguments for the handler function. These arguments are provided after all method-specific ones.Note
Extensive parameters transmitted in
argsslow the script down, so we recommend transmitting as little information as possible using them. -
libs: Array of strings specifying the libraries the handler function will use. We recommend that you specify the library name together with its version, e.g.,date-utils@2.3.0ordate-utils@2.5.3. If you specify the library name without its version, e.g.,date-utils, the latest version (latest) published in the npm registry will be used.Possible values for libraries to connect:
date-utils@2.3.0,date-utils@2.5.3(date-utilalias),d3@7.9.0(d3alias),d3-chord@3.0.1(d3-chordalias), andd3-sankey@0.12.3(d3-sankeyalias).Warning
- Specifying multiple versions of the same library may cause it to behave unexpectedly or render it complete inoperable.
- In some cases, referring to a library without specifying its version may cause unpredictable results in the handler function.
Examples
Example for an advanced chart:
 module.exports = {
    render: Editor.wrapFn({
        fn: function() {
            return 'Hello world';
        },
    }),
};
Chart examples
Use case with the d3 library connected, based on the advanced chart