Adding parameters in the dashboard chart settings in Yandex DataLens
To set a parameter:
Warning
If you use the new DataLens object model with workbooks and collections:
- In the left-hand panel, select Collections and workbooks.
- Open the workbook you need and select an object.
Proceed with this guide from Step 2.
-
In the left-hand panel, click Dashboards and select the dashboard you need. If you do not have a dashboard, create one.
-
In the top-right corner, click Edit.
-
Select a chart for which you want to set a new parameter.
-
In the top-right corner of the chart, click .
-
In the window that opens, click Parameters.
-
Click Add parameter at the bottom of the list.
-
In the Name column, enter the parameter name (key).
-
In the Value column, click and set a value for the parameter. You can set multiple values.
-
Click Save.
-
In the top-right corner of the dashboard edit window, click Save.
Chart on a dashboard without a parameter
Chart on a dashboard with a parameter
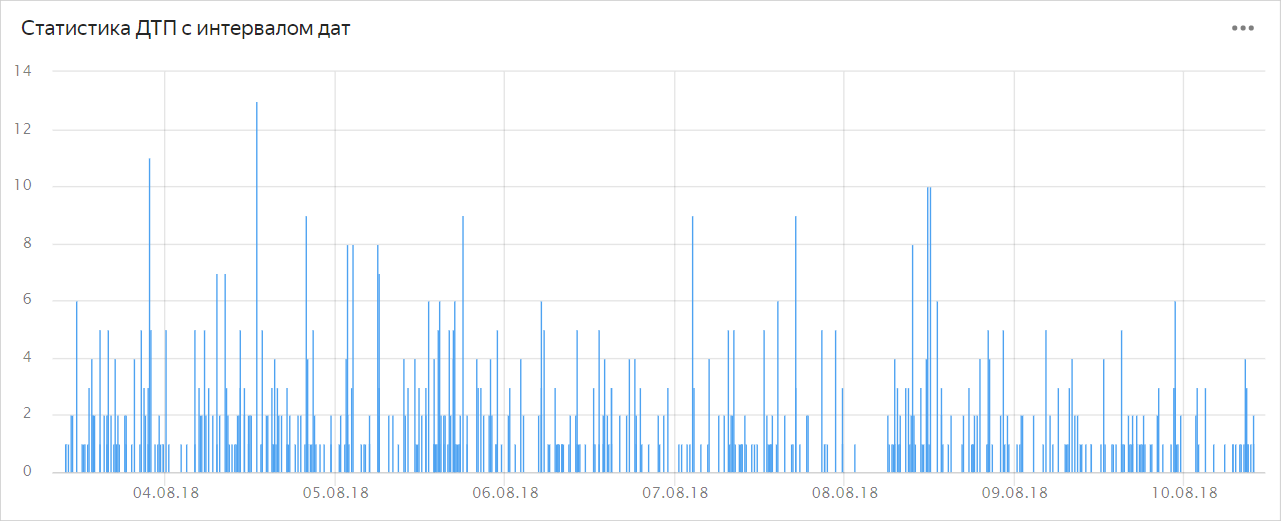
Example of parameters with intervals
Example of adding a parameter with a date interval
To set the date and time interval between 03-08-2018 09:00:00 and 10-08-2018 10:00:00, set the parameter to __interval_2018-08-03T09:00:00_2018-08-10T10:00:00.
Example of adding a parameter with a relative date
To set the date and time interval from the beginning of the last week of 2018 until today, set the parameter to __interval_2018-12-23___relative_+0d.
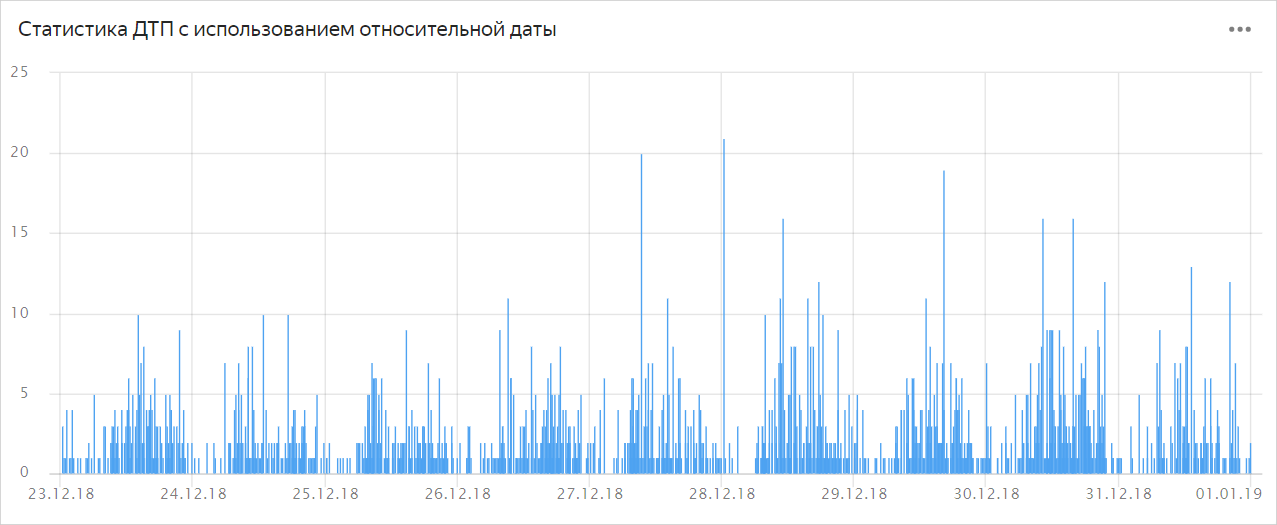
To build relative statistics for the beginning of the year, change __relative_-0d to __relative_-0y_sy.
Note
If castings are not specified, then for units of day and longer, the time is cast to the start of the day, i.e., 00:00:00.000; for shorter units, the current time is used.