Setting up Nginx telemetry collection in Kubernetes


You will set up an Nginx server in a Kubernetes cluster and send its metrics and logs to Monium. This guide uses Managed Service for Kubernetes to deploy a cluster, but you can any of your Kubernetes clusters.
To set up web server telemetry collection in a cluster:
- Configure your Kubernetes cluster.
- Set up authentication: Create a service account and API key to send data to Monium.
- Install and configure Nginx: Deploy a web server with a metric exporter.
- Install OpenTelemetry Collector: Set up metric collection and sending.
- View metrics in Monium.
- Configure log collection.
- View logs in Monium.
- Configure additional metrics based on logs.
- Create a dashboard and alerts.
Getting started
Sign up for Yandex Cloud and create a billing account:
- Navigate to the management console and log in to Yandex Cloud or create a new account.
- On the Yandex Cloud Billing page, make sure you have a billing account linked and it has the
ACTIVEorTRIAL_ACTIVEstatus. If you do not have a billing account, create one and link a cloud to it.
If you have an active billing account, you can create or select a folder for your infrastructure on the cloud page.
Learn more about clouds and folders here.
Required paid resources
The cost of resources you need for Monium includes:
- Fee for using a Managed Service for Kubernetes master (see Managed Service for Kubernetes pricing).
- Fee for the Managed Service for Kubernetes node group's computing resources and disks (see Yandex Compute Cloud pricing).
- Fee for using Monium (see Monium pricing).
Setting up a cluster
Setting up authentication
In this step, you need to get and save the API key and folder ID to use them to configure OpenTelemetry Collector.
-
Create a service account with the
monium.telemetry.writerrole.- Navigate to Identity and Access Management.
- Click Create service account.
- Name your service account, e.g.,
monium-ca. - Click Add role and select
monium.telemetry.writer. - Click Create.
-
Create an API key with the
yc.monium.telemetry.writescope:- Select the service account you created from the list.
- Click Create new key and select Create API key.
- In the Scope field, select
yc.monium.telemetry.write. - Click Create.
-
Copy the API key and save it to a secure location as you will need it later.
-
Copy the ID of the folder the cluster and service account were created in. To do this, click the folder name at the top and click → Copy ID next to the folder in the list.
Installing and configuring Nginx
-
Create a file with the web server configuration and Nginx HTML page:
configmap.yaml
apiVersion: v1 kind: ConfigMap metadata: name: nginx-config namespace: nginx-demo data: nginx.conf: | server { listen 80; root /usr/share/nginx/html; index index.html; ssi on; ssi_types text/html; ssi_last_modified on; location / { try_files $uri $uri/ =404; } location /nginx_status { stub_status; access_log off; allow 127.0.0.1; deny all; } } index.html: | <!DOCTYPE html> <html lang="en"> <head> <meta charset="utf-8" /> <meta name="viewport" content="width=device-width, initial-scale=1" /> <title>Nginx Demo</title> <style> body { font-family: -apple-system,BlinkMacSystemFont,Segoe UI,Roboto,Arial,sans-serif; background:#0b1020; color:#e6edf3; margin:0; } .wrap { max-width: 900px; margin: 80px auto; padding: 0 20px; } .card { background:#111a33; border:1px solid rgba(255,255,255,.08); border-radius: 16px; padding: 28px; box-shadow: 0 10px 30px rgba(0,0,0,.35); } h1 { margin:0 0 10px; font-size: 28px; } p { margin: 8px 0; color:#b7c3d0; } code { background: rgba(255,255,255,.06); padding: 2px 6px; border-radius: 8px; } .ok { display:inline-block; margin-top:14px; padding:8px 12px; border-radius: 999px; background: rgba(56,189,248,.12); border:1px solid rgba(56,189,248,.35); color:#7dd3fc; } .grid { display:grid; grid-template-columns: 1fr 1fr; gap: 12px; margin-top: 18px; } .mini { background: rgba(255,255,255,.04); border:1px solid rgba(255,255,255,.06); border-radius: 14px; padding: 14px; } .mini b { color:#e6edf3; } @media (max-width: 700px) { .grid { grid-template-columns: 1fr; } } </style> </head> <body> <div class="wrap"> <div class="card"> <h1>🚀 Nginx is serving this page</h1> <p>This is a simple demo page served from a Kubernetes pod.</p> <div class="ok">Status: OK</div> <div class="grid"> <div class="mini"> <p><b>Endpoint:</b> <code>/</code></p> <p>Static HTML from <code>/usr/share/nginx/html/index.html</code></p> </div> <div class="mini"> <p><b>Metrics:</b> <code>/metrics</code> (exporter)</p> <p>Nginx stub status: <code>/nginx_status</code> (localhost-only)</p> </div> </div> <!-- New grid section: runtime pod info --> <div class="grid" style="margin-top:18px;"> <div class="mini"> <p><b>Pod (hostname):</b></p> <p><code><!--# echo var="hostname" --></code></p> </div> <div class="mini"> <p><b>Pod IP:</b></p> <p><code><!--# echo var="server_addr" --></code></p> </div> <div class="mini"> <p><b>Client IP:</b></p> <p><code><!--# echo var="remote_addr" --></code></p> </div> <div class="mini"> <p><b>Request time:</b></p> <p><code><!--# echo var="time_local" --></code></p> </div> </div> <p style="margin-top:18px;"> Refresh the page to see load balancing between pods. </p> <p style="margin-top:18px;"> If you see this page via LoadBalancer/Ingress — publishing works. </p> </div> </div> </body> </html> -
Create a file to manage the running and scaling of Nginx pods.
deployment.yaml
apiVersion: apps/v1
kind: Deployment
metadata:
  name: nginx-server
  namespace: nginx-demo
  labels:
    app: nginx
spec:
  replicas: 3
  selector:
    matchLabels:
      app: nginx
  template:
    metadata:
      labels:
        app: nginx
    spec:
      containers:
        - name: nginx
          image: nginx:stable
          ports:
            - name: http
              containerPort: 80
          volumeMounts:
            - name: nginx-config
              mountPath: /etc/nginx/conf.d/default.conf
              subPath: nginx.conf
            - name: nginx-config
              mountPath: /usr/share/nginx/html/index.html
              subPath: index.html
        - name: nginx-exporter
          image: nginx/nginx-prometheus-exporter:0.10.0
          args:
            - -nginx.scrape-uri=http://localhost/nginx_status
          ports:
            - name: metrics
              containerPort: 9113
          resources:
            limits:
              memory: 128Mi
              cpu: 500m
      volumes:
        - name: nginx-config
          configMap:
            name: nginx-config
To monitor Nginx in Kubernetes, you will need
nginx-exporterto convert Nginx internal statistics into OpenTelemetry Collector format.In the
deployment.yamlfile, the exporter is added as a sidecar:- name: nginx-exporter image: nginx/nginx-prometheus-exporter:0.10.0 args: - -nginx.scrape-uri=http://localhost/nginx_status ports: - name: metrics containerPort: 9113 resources: limits: memory: 128Mi cpu: 500mEach Nginx app pod will have two containers,
nginxandnginx-exporter. -
Create a file with Nginx access credentials:
services.yaml
apiVersion: v1 kind: Service metadata: name: nginx-web namespace: nginx-demo labels: app: nginx spec: externalTrafficPolicy: Local type: LoadBalancer selector: app: nginx ports: - name: http port: 80 targetPort: 80 --- apiVersion: v1 kind: Service metadata: name: nginx-metrics namespace: nginx-demo labels: app: nginx spec: selector: app: nginx ports: - name: metrics port: 9113 targetPort: metrics -
Deploy Nginx:
kubectl create namespace nginx-demo kubectl apply -f configmap.yaml kubectl apply -f deployment.yaml kubectl apply -f services.yaml -
Make sure the application is running:
kubectl get service -n nginx-demo nginx-webResult:
NAME TYPE CLUSTER-IP EXTERNAL-IP PORT(S) AGE nginx-web LoadBalancer 10.96.238.139 158.260.329.4 80:32761/TCP 104s -
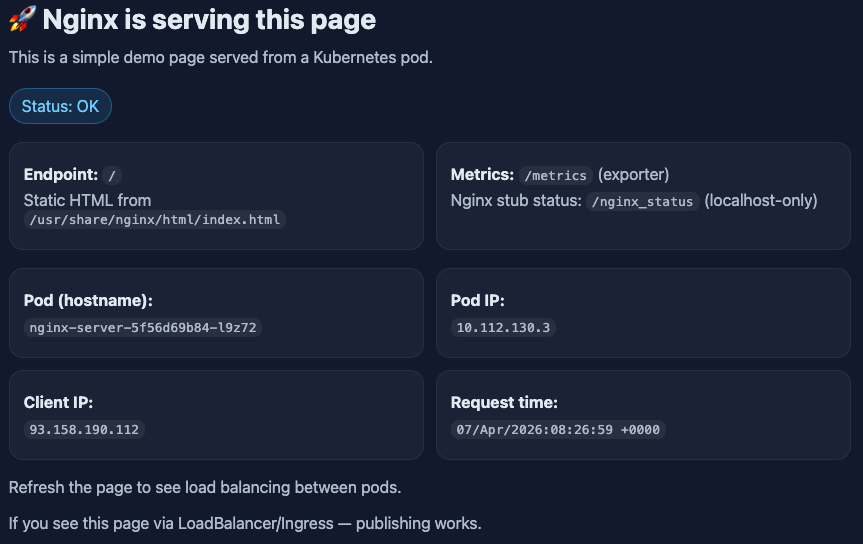
In your browser, open the address from the
EXTERNAL-IPcolumn, e.g.,http://158.260.329.4. You should see the HTML page fromconfigmap.yaml.Nginx web server page
Installing and configuring OpenTelemetry Collector
In this step, you will install OpenTelemetry Collector Contrib, an extended collector version with additional components for log collection, parsing, and other tasks. The OpenTelemetry Collector basic version is enough for metric collection, but to work with logs, you need the Contrib version, which is why we will use it from the beginning.
-
Create a file to install OpenTelemetry Collector and send metrics to Monium:
otel-config.yaml
---
apiVersion: v1
kind: Secret
metadata:
  name: monium-secrets
  namespace: nginx-demo
stringData:
  MONIUM_API_KEY: '<API_key>'
---
apiVersion: v1
kind: ConfigMap
metadata:
  name: otel-collector-conf
  namespace: nginx-demo
  labels:
    app: opentelemetry
    component: otel-collector-conf
data:
  otel-collector-config: |
    receivers:
      prometheus:
        config:
          scrape_configs:
            - job_name: "nginx"
              scrape_interval: 15s
              kubernetes_sd_configs:
                - role: pod
                  namespaces:
                    names:
                      - nginx-demo

              relabel_configs:
                - source_labels: [__meta_kubernetes_namespace]
                  action: keep
                  regex: nginx-demo

                - source_labels: [__meta_kubernetes_pod_label_app]
                  action: keep
                  regex: nginx

                - source_labels: [__meta_kubernetes_pod_container_port_name]
                  action: keep
                  regex: metrics

                - source_labels: [__meta_kubernetes_pod_name]
                  target_label: pod

                - source_labels: [__meta_kubernetes_namespace]
                  target_label: namespace

    processors:
      batch:
        timeout: 5s
        send_batch_size: 1024
      memory_limiter:
        limit_mib: 1500
        spike_limit_mib: 512
        check_interval: 5s
      resource:
        attributes:
          - key: service.name
            value: nginx
            action: upsert
          - key: service.namespace
            value: nginx-demo
            action: upsert

    exporters:
      otlp/monium:
        compression: none
        endpoint: ingest.monium.yandex.cloud:443
        headers:
          Authorization: Api-Key ${env:MONIUM_API_KEY}
          x-monium-project: folder__<folder_ID>
      debug:
        verbosity: basic

    extensions:
      zpages: {}

    service:
      extensions: [zpages]
      pipelines:
        metrics:
          receivers: [prometheus]
          processors: [memory_limiter, resource, batch]
          exporters: [otlp/monium, debug]
---
apiVersion: v1
kind: Service
metadata:
  name: otel-collector
  namespace: nginx-demo
  labels:
    app: opentelemetry
    component: otel-collector
spec:
  ports:
    - name: otlp-grpc
      port: 4317
      protocol: TCP
      targetPort: 4317
    - name: otlp-http
      port: 4318
      protocol: TCP
      targetPort: 4318
    - name: metrics
      port: 8888
  selector:
    component: otel-collector
---
apiVersion: apps/v1
kind: Deployment
metadata:
  name: otel-collector
  namespace: nginx-demo
  labels:
    app: opentelemetry
    component: otel-collector
spec:
  selector:
    matchLabels:
      app: opentelemetry
      component: otel-collector
  replicas: 1
  template:
    metadata:
      labels:
        app: opentelemetry
        component: otel-collector
    spec:
      serviceAccountName: otel-collector
      containers:
        - command:
            - "/otelcol-contrib"
            - "--config=/conf/otel-collector-config.yaml"
          image: otel/opentelemetry-collector-contrib:latest
          name: otel-collector
          resources:
            limits:
              cpu: 1
              memory: 2Gi
            requests:
              cpu: 200m
              memory: 400Mi
          ports:
            - containerPort: 55679
            - containerPort: 4317
            - containerPort: 4318
            - containerPort: 8888
          env:
            - name: MY_POD_IP
              valueFrom:
                fieldRef:
                  apiVersion: v1
                  fieldPath: status.podIP
            - name: GOMEMLIMIT
              value: 1600MiB
            - name: MONIUM_API_KEY
              valueFrom:
                secretKeyRef:
                  name: monium-secrets
                  key: MONIUM_API_KEY
          volumeMounts:
            - name: otel-collector-config-vol
              mountPath: /conf
      volumes:
        - name: otel-collector-config-vol
          configMap:
            name: otel-collector-conf
            items:
              - key: otel-collector-config
                path: otel-collector-config.yaml
---
apiVersion: v1
kind: ServiceAccount
metadata:
  name: otel-collector
  namespace: nginx-demo
---
apiVersion: rbac.authorization.k8s.io/v1
kind: Role
metadata:
  name: otel-collector-discovery
  namespace: nginx-demo
rules:
  - apiGroups: [""]
    resources: ["pods"]
    verbs: ["get", "list", "watch"]
---
apiVersion: rbac.authorization.k8s.io/v1
kind: RoleBinding
metadata:
  name: otel-collector-discovery
  namespace: nginx-demo
subjects:
  - kind: ServiceAccount
    name: otel-collector
    namespace: nginx-demo
roleRef:
  apiGroup: rbac.authorization.k8s.io
  kind: Role
  name: otel-collector-discovery
In this file, provide the
<API_key>and<folder_ID>values you saved when setting up authentication. -
Install OTel Collector and start sending metrics:
kubectl apply -f otel-config.yaml -
Make sure there is a new pod named
otel-collector:kubectl get pods --namespace nginx-demoResult:
NAME                              READY   STATUS    RESTARTS   AGE
nginx-server-949d9f98b-kzlrd      2/2     Running   0          2d2h
nginx-server-949d9f98b-ngtsp      2/2     Running   0          2d2h
nginx-server-949d9f98b-tclvh      2/2     Running   0          2d2h
otel-collector-6cd848c59d-k6g2p   1/1     Running   0          12s
Viewing metrics in Monium
-
On the Monium home page, select Explore → Metrics on the left.
-
In the query string, select the following one by one:
project=folder__<folder_ID>cluster=defaultservice=nginxname=nginx_up
You can use text mode for the query. To do this, click and enter your query as text:
`project=folder__<folder_ID>; cluster=default; service=nginx; name=nginx_up`.This metric shows the Nginx availability status:
1for available,0for unavailable. The aggregate value of3indicates the number of pods. -
Click Execute query.
More on metrics.
If there is no data in Monium, see Data delivery troubleshooting.
By combining various metrics in queries, you can check if the web server is handling the current load effectively, detect connection drops caused by insufficient resources, and estimate query processing speeds.
Number of active connections
To estimate the number of active connections, specify the following value for the name metric:
nginx_connections_accepted: Number of accepted connections since Nginx startup. It is used to monitor the general load.nginx_connections_reading: Number of connections Nginx reads client requests from. Shows how active incoming requests are.nginx_connections_writing: Number of connections where Nginx sends responses to clients. Shows how active outgoing requests are.
Number of unprocessed connections
To estimate the number of connections unprocessed by Nginx, use these metrics:
nginx_connections_accepted: Number of accepted connections.nginx_connections_handled: Number of processed connections.
The difference between processed and accepted connections will be the number of connections that were accepted but not correctly processed by Nginx.
Create three queries: Query A for nginx_connections_accepted, Query B for nginx_connections_handled, and Query C to calculate the difference between these metrics. To create an extra query, click Add query.
-
Query A:
`project=folder__<folder_ID>; cluster=default; service=nginx; name=nginx_connections_accepted`. -
Query B:
`project=folder__<folder_ID>; cluster=default; service=nginx; name=nginx_connections_handled`. -
Query C: enter
A - Bin the query string.
Chart displaying unprocessed connections
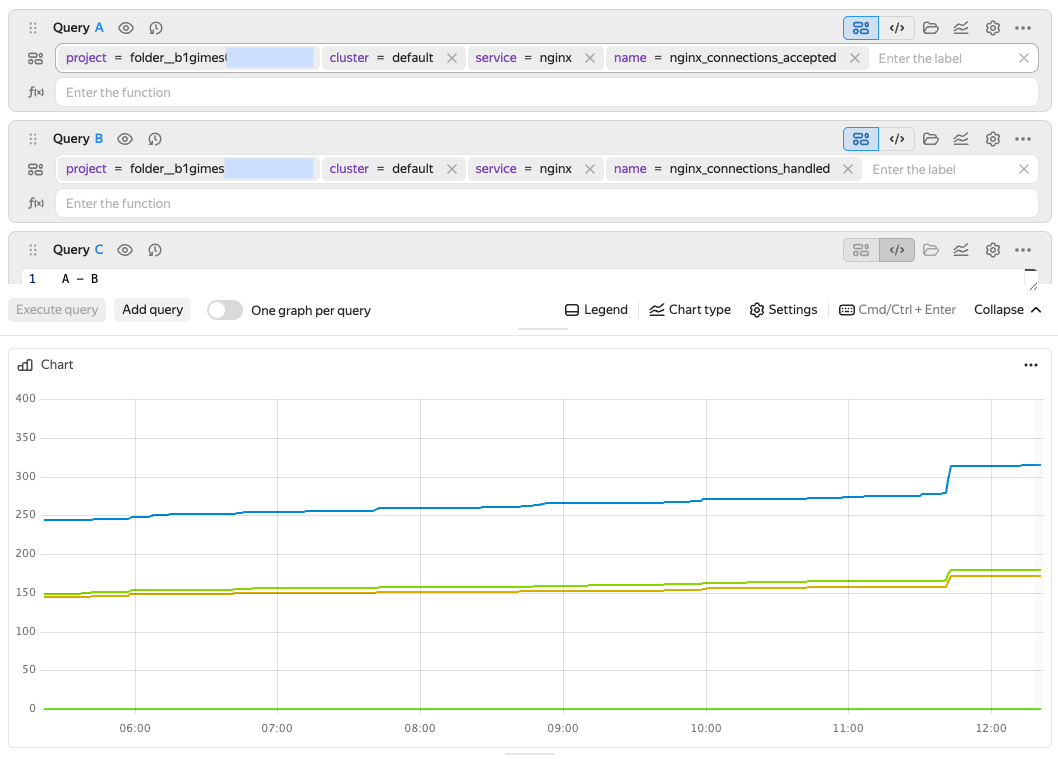
To display only the final result, click next to queries A and B to hide them from the chart. To show the hidden charts, click .
In the test example, there are no unprocessed connections, so all query C values are null. In real systems, you can visualize these values as the (A - B) / A ratio, i.e., the share of connections accepted by Nginx but not processed. You can create an alert for this indicator to notify you, e.g., when the share of dropped connections exceeds 5%.
Configuring log collection
-
Create a new configuration file for log collection:
otel-config-logs.yaml
---
apiVersion: v1
kind: Secret
metadata:
  name: monium-secrets
  namespace: nginx-demo
stringData:
  MONIUM_API_KEY: '<API_key>'
---
apiVersion: v1
kind: ConfigMap
metadata:
  name: otel-collector-conf
  namespace: nginx-demo
  labels:
    app: opentelemetry
    component: otel-collector-conf
data:
  otel-collector-config: |
    receivers:
      prometheus:
        config:
          scrape_configs:
            - job_name: "nginx"
              scrape_interval: 15s
              kubernetes_sd_configs:
                - role: pod
                  namespaces:
                    names:
                      - nginx-demo

              relabel_configs:
                - source_labels: [__meta_kubernetes_namespace]
                  action: keep
                  regex: nginx-demo

                - source_labels: [__meta_kubernetes_pod_label_app]
                  action: keep
                  regex: nginx

                - source_labels: [__meta_kubernetes_pod_container_port_name]
                  action: keep
                  regex: metrics

                - source_labels: [__meta_kubernetes_pod_name]
                  target_label: pod

                - source_labels: [__meta_kubernetes_namespace]
                  target_label: namespace
      filelog:
        include:
          - /var/log/pods/nginx-demo_nginx-server-*/nginx/*.log
        operators:
          - type: container
            id: container-parser

    processors:
      batch:
        timeout: 5s
        send_batch_size: 1024
      memory_limiter:
        limit_mib: 1500
        spike_limit_mib: 512
        check_interval: 5s
      resource:
        attributes:
          - key: service.name
            value: nginx
            action: upsert
          - key: service.namespace
            value: nginx-demo
            action: upsert

    exporters:
      otlp/monium:
        compression: none
        endpoint: ingest.monium.yandex.cloud:443
        headers:
          Authorization: Api-Key ${env:MONIUM_API_KEY}
          x-monium-project: folder__<folder_ID>
      debug:
        verbosity: basic

    extensions:
      zpages: {}

    service:
      extensions: [zpages]
      pipelines:
        metrics:
          receivers: [prometheus]
          processors: [memory_limiter, resource, batch]
          exporters: [otlp/monium, debug]
        logs:
          receivers: [filelog]
          processors: [memory_limiter, resource, batch]
          exporters: [otlp/monium, debug]
---
apiVersion: v1
kind: Service
metadata:
  name: otel-collector
  namespace: nginx-demo
  labels:
    app: opentelemetry
    component: otel-collector
spec:
  ports:
    - name: otlp-grpc
      port: 4317
      protocol: TCP
      targetPort: 4317
    - name: otlp-http
      port: 4318
      protocol: TCP
      targetPort: 4318
    - name: metrics
      port: 8888
  selector:
    component: otel-collector
---
apiVersion: apps/v1
kind: DaemonSet
metadata:
  name: otel-collector
  namespace: nginx-demo
  labels:
    app: opentelemetry
    component: otel-collector
spec:
  selector:
    matchLabels:
      app: opentelemetry
      component: otel-collector
  template:
    metadata:
      labels:
        app: opentelemetry
        component: otel-collector
    spec:
      serviceAccountName: otel-collector
      containers:
        - command:
            - "/otelcol-contrib"
            - "--config=/conf/otel-collector-config.yaml"
          image: otel/opentelemetry-collector-contrib:latest
          name: otel-collector
          resources:
            limits:
              cpu: 1
              memory: 2Gi
            requests:
              cpu: 200m
              memory: 400Mi
          ports:
            - containerPort: 55679
            - containerPort: 4317
            - containerPort: 4318
            - containerPort: 8888
          env:
            - name: MY_POD_IP
              valueFrom:
                fieldRef:
                  apiVersion: v1
                  fieldPath: status.podIP
            - name: GOMEMLIMIT
              value: 1600MiB
            - name: MONIUM_API_KEY
              valueFrom:
                secretKeyRef:
                  name: monium-secrets
                  key: MONIUM_API_KEY
          volumeMounts:
            - name: otel-collector-config-vol
              mountPath: /conf
            - name: varlogpods
              mountPath: /var/log/pods
              readOnly: true
      volumes:
        - name: otel-collector-config-vol
          configMap:
            name: otel-collector-conf
            items:
              - key: otel-collector-config
                path: otel-collector-config.yaml
        - name: varlogpods
          hostPath:
            path: /var/log/pods
---
apiVersion: v1
kind: ServiceAccount
metadata:
  name: otel-collector
  namespace: nginx-demo
---
apiVersion: rbac.authorization.k8s.io/v1
kind: Role
metadata:
  name: otel-collector-discovery
  namespace: nginx-demo
rules:
  - apiGroups: [""]
    resources: ["pods"]
    verbs: ["get", "list", "watch"]
---
apiVersion: rbac.authorization.k8s.io/v1
kind: RoleBinding
metadata:
  name: otel-collector-discovery
  namespace: nginx-demo
subjects:
  - kind: ServiceAccount
    name: otel-collector
    namespace: nginx-demo
roleRef:
  apiGroup: rbac.authorization.k8s.io
  kind: Role
  name: otel-collector-discovery
This file contains a receiver section:
filelog:
  include:
    - /var/log/pods/nginx-demo_nginx-server-*/nginx/*.log
  operators:
    - type: container
      id: container-parser
As well as the log collection pipeline (
pipeline) and mount parameters (volumeMounts,volumes) for accessing the pod logs. -
Delete the previous configuration file and apply the new one:
kubectl delete -f otel-config.yaml
kubectl apply -f otel-config-logs.yaml
Viewing logs in Monium
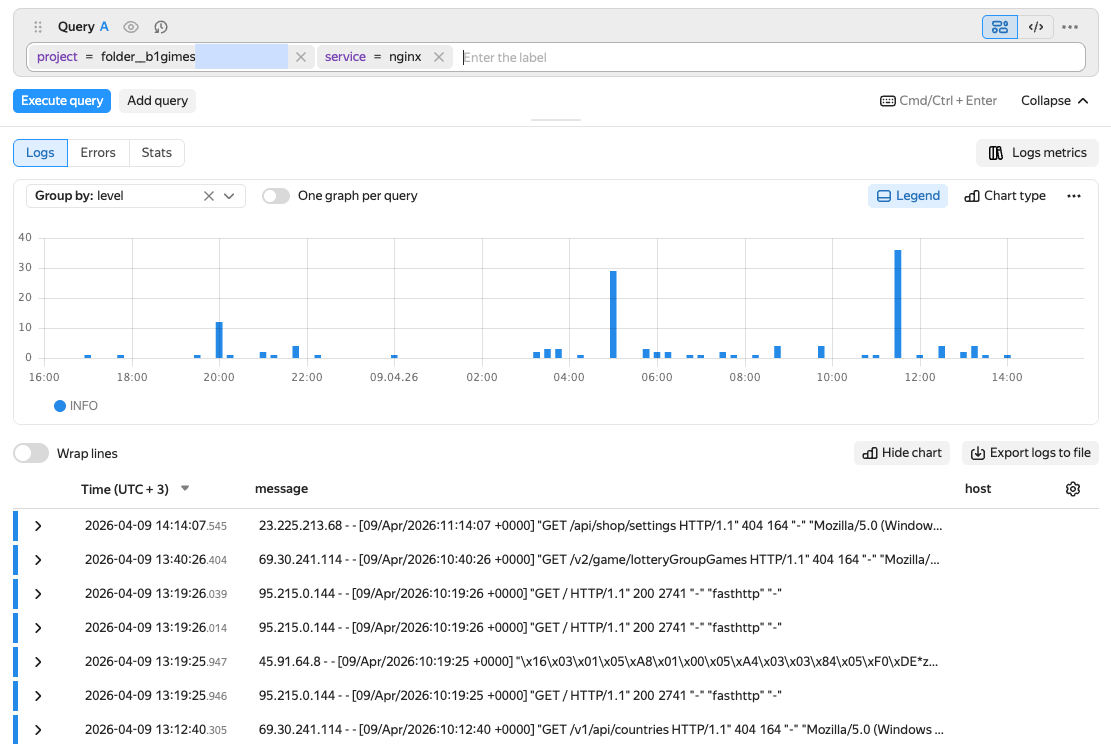
-
On the Monium home page, select Explore → Logs on the left.
-
In the query string, specify the following:
project=folder__<folder_ID>service=nginx
-
Click Execute query.
Page example with Nginx logs
More on logs.
Setting up metric collection from logs
Apart from the standard metrics provided by Nginx via the Prometheus exporter, OTel Collector enables you to retrieve additional metrics from application logs. For example, you can track the numbers of HTTP responses with different status codes.
To get these metrics, create and apply a new configuration file:
otel-config-metrics.yaml
---
apiVersion: v1
kind: Secret
metadata:
  name: monium-secrets
  namespace: nginx-demo
stringData:
  MONIUM_API_KEY: "<API_key>"
---
apiVersion: v1
kind: ConfigMap
metadata:
  name: otel-collector-conf
  namespace: nginx-demo
  labels:
    app: opentelemetry
    component: otel-collector-conf
data:
  otel-collector-config: |
    receivers:
      prometheus:
        config:
          scrape_configs:
            - job_name: "nginx"
              scrape_interval: 15s
              kubernetes_sd_configs:
                - role: pod
                  namespaces:
                    names:
                      - nginx-demo

              relabel_configs:
                - source_labels: [__meta_kubernetes_namespace]
                  action: keep
                  regex: nginx-demo

                - source_labels: [__meta_kubernetes_pod_label_app]
                  action: keep
                  regex: nginx

                - source_labels: [__meta_kubernetes_pod_container_port_name]
                  action: keep
                  regex: metrics

                - source_labels: [__meta_kubernetes_pod_name]
                  target_label: pod

                - source_labels: [__meta_kubernetes_namespace]
                  target_label: namespace
      filelog:
        include:
          - /var/log/pods/nginx-demo_nginx-server-*/nginx/*.log
        operators:
          - type: container
            id: container-parser

          - type: regex_parser
            id: nginx-access
            parse_from: body
            regex: '^(?P<remote_addr>\S+) - (?P<remote_user>\S+) \[(?P<time_local>[^\]]+)\] "(?P<method>\S+) (?P<target>\S+) (?P<protocol>[^"]+)" (?P<status>\d{3}) (?P<body_bytes_sent>\d+)'

    processors:
      batch:
        timeout: 5s
        send_batch_size: 1024
      memory_limiter:
        limit_mib: 1500
        spike_limit_mib: 512
        check_interval: 5s
      resource:
        attributes:
          - key: service.name
            value: nginx
            action: upsert
          - key: service.namespace
            value: nginx-demo
            action: upsert

    connectors:
      count/nginx:
        logs:
          nginx_http_2xx_total:
            description: nginx 2xx responses
            conditions:
              - 'IsMatch(attributes["status"], "^2..$")'

          nginx_http_4xx_total:
            description: nginx 4xx responses
            conditions:
              - 'IsMatch(attributes["status"], "^4..$")'

          nginx_http_5xx_total:
            description: nginx 5xx responses
            conditions:
              - 'IsMatch(attributes["status"], "^5..$")'

    exporters:
      otlp/monium:
        compression: none
        endpoint: ingest.monium.yandex.cloud:443
        headers:
          Authorization: Api-Key ${env:MONIUM_API_KEY}
          x-monium-project: folder__<folder_ID>
      debug:
        verbosity: basic

    extensions:
      zpages: {}

    service:
      extensions: [zpages]
      pipelines:
        metrics:
          receivers: [prometheus]
          processors: [memory_limiter, resource, batch]
          exporters: [otlp/monium, debug]
        logs:
          receivers: [filelog]
          processors: [memory_limiter, resource, batch]
          exporters: [count/nginx, otlp/monium, debug]
        metrics/logs:
          receivers: [count/nginx]
          processors: [memory_limiter, resource, batch]
          exporters: [otlp/monium, debug]
---
apiVersion: v1
kind: Service
metadata:
  name: otel-collector
  namespace: nginx-demo
  labels:
    app: opentelemetry
    component: otel-collector
spec:
  ports:
    - name: otlp-grpc
      port: 4317
      protocol: TCP
      targetPort: 4317
    - name: otlp-http
      port: 4318
      protocol: TCP
      targetPort: 4318
    - name: metrics
      port: 8888
  selector:
    component: otel-collector
---
apiVersion: apps/v1
kind: DaemonSet
metadata:
  name: otel-collector
  namespace: nginx-demo
  labels:
    app: opentelemetry
    component: otel-collector
spec:
  selector:
    matchLabels:
      app: opentelemetry
      component: otel-collector
  template:
    metadata:
      labels:
        app: opentelemetry
        component: otel-collector
    spec:
      serviceAccountName: otel-collector
      containers:
        - command:
            - "/otelcol-contrib"
            - "--config=/conf/otel-collector-config.yaml"
          image: otel/opentelemetry-collector-contrib:0.147.0
          name: otel-collector
          resources:
            limits:
              cpu: 1
              memory: 2Gi
            requests:
              cpu: 200m
              memory: 400Mi
          ports:
            - containerPort: 55679
            - containerPort: 4317
            - containerPort: 4318
            - containerPort: 8888
          env:
            - name: MY_POD_IP
              valueFrom:
                fieldRef:
                  apiVersion: v1
                  fieldPath: status.podIP
            - name: GOMEMLIMIT
              value: 1600MiB
            - name: MONIUM_API_KEY
              valueFrom:
                secretKeyRef:
                  name: monium-secrets
                  key: MONIUM_API_KEY
          volumeMounts:
            - name: otel-collector-config-vol
              mountPath: /conf
            - name: varlogpods
              mountPath: /var/log/pods
              readOnly: true
      volumes:
        - name: otel-collector-config-vol
          configMap:
            name: otel-collector-conf
            items:
              - key: otel-collector-config
                path: otel-collector-config.yaml
        - name: varlogpods
          hostPath:
            path: /var/log/pods
---
apiVersion: v1
kind: ServiceAccount
metadata:
  name: otel-collector
  namespace: nginx-demo
---
apiVersion: rbac.authorization.k8s.io/v1
kind: Role
metadata:
  name: otel-collector-discovery
  namespace: nginx-demo
rules:
  - apiGroups: [""]
    resources: ["pods"]
    verbs: ["get", "list", "watch"]
---
apiVersion: rbac.authorization.k8s.io/v1
kind: RoleBinding
metadata:
  name: otel-collector-discovery
  namespace: nginx-demo
subjects:
  - kind: ServiceAccount
    name: otel-collector
    namespace: nginx-demo
roleRef:
  apiGroup: rbac.authorization.k8s.io
  kind: Role
  name: otel-collector-discovery
This configuration is updated with the following components:
-
Retrieving log data.
The
filelogsection includes theregex_parserstatement to retrieve the relevant fields, e.g., the request method, URL, HTTP response code, etc., from the Nginx access log lines:filelog: include: - /var/log/pods/nginx-demo_nginx-server-*/nginx/*.log operators: - type: container id: container-parser - type: regex_parser id: nginx-access parse_from: body regex: '^(?P<remote_addr>\S+) - (?P<remote_user>\S+) \[(?P<time_local>[^\]]+)\] "(?P<method>\S+) (?P<target>\S+) (?P<protocol>[^"]+)" (?P<status>\d{3}) (?P<body_bytes_sent>\d+)'This statement will get the
statusfield (HTTP response code) from each log line. We will use this value to generate metrics. -
Creating metrics from logs.
Added the
countconnector to monitor the number of log entries based on specific conditions. The example below counts responses with2xx,4xx, and5xxcodes:connectors: count/nginx: logs: nginx_http_2xx_total: description: Number of successful responses (2xx) conditions: - 'IsMatch(attributes["status"], "^2..$")' nginx_http_4xx_total: description: Number of client errors (4xx) conditions: - 'IsMatch(attributes["status"], "^4..$")' nginx_http_5xx_total: description: Number of server errors (5xx) conditions: - 'IsMatch(attributes["status"], "^5..$")' -
Setting up pipelines.
Added the
metrics/logspipeline to receive metrics from thecount/nginxconnector and send them to Monium together with other metrics:service: extensions: [zpages] pipelines: metrics: receivers: [prometheus] processors: [memory_limiter, resource, batch] exporters: [otlp/monium, debug] logs: receivers: [filelog] processors: [memory_limiter, resource, batch] exporters: [count/nginx, otlp/monium, debug] metrics/logs: receivers: [count/nginx] processors: [memory_limiter, resource, batch] exporters: [otlp/monium, debug]
Once you apply the configuration, new metrics will be available in Monium:
nginx_http_2xx_total: Number of successful responses.nginx_http_4xx_total: Number of client errors.nginx_http_5xx_total: Number of server errors.
Example of a page with Nginx metrics collected from logs
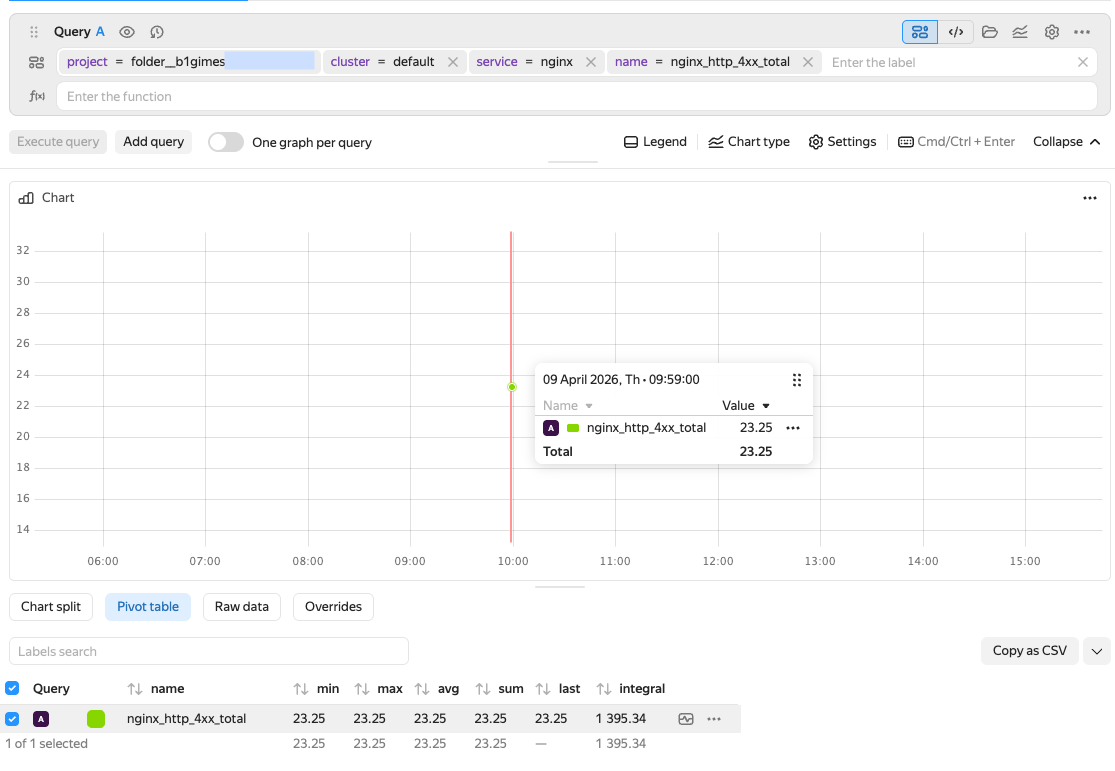
These metrics can be used for quality-of-service monitoring and troubleshooting. For example, a spike in 5xx errors may indicate an application failure.
Creating a dashboard and alerts
For continuous Nginx health monitoring, create a dashboard with key metrics and set up alerts to get notifications about issues.
For Nginx, we recommend adding charts with the following metrics to the dashboard:
nginx_connections_accepted: Number of accepted connections since startup.nginx_connections_active: Number of current active connections.nginx_connections_handled: Number of processed connections.nginx_connections_reading: Number of connections Nginx reads requests from.nginx_connections_waiting: Number of idle connections.nginx_connections_writing: Number of connections Nginx sends responses to.nginx_requests_total: Total number of processed requests.nginx_http_2xx_total: Number of successful responses (code 2xx).nginx_http_4xx_total: Number of client errors (code 4xx).nginx_http_5xx_total: Number of server errors (code 5xx).
To receive notifications about critical situations, set the following alerts:
-
High server error rate: Increase in
nginx_http_5xx_total.Trigger condition: Value greater than
10over a five-minute window. -
High client error rate: Increase in
nginx_http_4xx_total.Trigger condition: Value greater than
50over a five-minute window. -
Unprocessed connections: Difference between accepted and processed connections.
Trigger condition: Value greater than
0over a five-minute window.
Adjust these the thresholds and time intervals based on your application’s specific requirements.