Getting started with Monium
Monium is a platform for collecting metrics, logs, and traces from Yandex Cloud, other clouds, or your local infrastructure.
Follow this guide to send telemetry data from your app or demo app via OTel Collector and view it in Monium.
To get started with app telemetry:
- Get your cloud ready.
- Create a service account and API key.
- Set up your application .
- View the data in Monium.
Get your cloud ready
-
Log in to the management console or sign up. If not signed up yet, navigate to the management console and follow the instructions.
-
On the Yandex Cloud Billing page, make sure you have a linked billing account with the
ACTIVEorTRIAL_ACTIVEstatus. If you do not have a billing account yet, create one.If you have an active billing account, you can navigate to the cloud page to create or select a folder for your infrastructure.
Create a service account and API key
-
In the management console, navigate to the folder where you want to store your telemetry.
-
Navigate to Identity and Access Management.
-
Click Create service account.
-
Enter a name for the service account, e.g.,
monium-sa. -
Click Add role and add the
monium.telemetry.writerrole.If you plan to transfer only particular data types, instead of
monium.telemetry.writer, select one or more roles with narrower sets of permissions:monium.metrics.writer,monium.logs.writer,monium.traces.writer. -
Click Create.
-
In the list that opens, select the service account you created.
-
In the top panel, click Create new key and select Create API key.
-
Select Scope for
yc.monium.telemetry.write.If you plan to transfer only particular data types, instead of
yc.monium.telemetry.write, select one or more narrower scopes:yc.monium.metrics.write,yc.monium.logs.write,yc.monium.traces.write. -
Optionally, set Expires at for the new API key.
-
Click Create.
-
Save the secret key you got for the next step.
After you close the window, you will not be able to view the secret key again.
Set up your application
In Monium, telemetry has this hierarchy: project → cluster → service. Data for each service-cluster pair is distributed to individual shards.
The method of configuring your application depends on whether telemetry is already configured or not. If you have already configured telemetry in the application, specify the connection parameters for Monium. If telemetry has not yet been configured, or if you do not have an application, perform a complete setup.
Specify the Monium connection settings if telemetry is already configured in your app
If you have an application and telemetry delivery is already configured, specify the parameters required to connect to Monium:
- Authentication: API key.
- Endpoint:
ingest.monium.yandex.cloud:443. - In the header:
x-monium-project=folder__<folder_ID>parameter. - In
OTEL_RESOURCE_ATTRIBUTES:clusterordeployment.nameandserviceorservice.name.
Attribute priority when writing data
All metrics, logs, and traces in Monium have mandatory labels: project, cluster, and service. These labels form the shard key.
When delivering telemetry in OpenTelemetry format, the values of these key attributes are assigned in the following order of priority:
- Values assigned via HTTP or gRPC headers have the highest priority.
- Then follow the values set in the resource attributes of the request body with the
clusterandservicekeys. - Next are the values set in the resource attributes recommended by the OpenTelemetry semantic convention.
- If the above-listed values are not set, the default value is used.
The project name is only taken from the header. The algorithm for determining the shard key is presented in the table below.
|
header |
resource’s own attribute |
resource’s standard attribute |
default value |
|
|
— |
— |
— |
|
|
|
|
|
|
|
|
|
|
Set up transfer of telemetry from an app
If you have your own application but telemetry delivery has not yet been configured in it, perform the necessary configuration. If you do not have a ready-made application for testing, use the demo app.
-
Set these environment variables:
-
MONIUM_PROJECT: Monium project name.By default, when you create a cloud and folder, two projects are created:
cloud__<cloud_ID>andfolder__<folder_ID>. You can also create other projects.To test Monium, you can specify a project folder, e.g.,
folder__b1g86q4m5vej********.If entering it manually, make sure that
folderis followed by two underscores. -
MONIUM_API_KEY: API key.
-
-
Set up your application to send OTLP telemetry:
- Install the auto-instrumentation agent to automatically collect some telemetry data and send it to OTLP.
- Add the OpenTelemetry SDK to your app.
-
Install OTel Collector.
You can send data to Monium directly from the OpenTelemetry SDK, without using the agent.
-
In the
otel-collector.yamlconfiguration file, configure data transfer to Monium.Example of a minimal
otel-collector.yamlconfiguration:receivers: otlp: # Target type: OTLP protocols: # Protocols that OTel Collector listens to grpc: # gRPC, default port 4317 http: # HTTP, default port 4318 processors: cumulativetodelta: batch: exporters: # Connecting to Monium otlp/monium: compression: zstd endpoint: ingest.monium.yandex.cloud:443 headers: Authorization: "Api-Key ${env:MONIUM_API_KEY}" x-monium-project: "${env:MONIUM_PROJECT}" service: pipelines: metrics: # Transferring metrics receivers: [ otlp ] processors: [ batch, cumulativetodelta ] exporters: [ otlp/monium ] traces: # Transferring traces receivers: [ otlp ] processors: [ batch ] exporters: [ otlp/monium ] logs: # Transferring logs receivers: [ otlp ] processors: [ batch ] exporters: [ otlp/monium ] -
Set the environment variables to distribute data across shards in Monium:
OTEL_SERVICE_NAME: Name of your application or service.OTEL_RESOURCE_ATTRIBUTES="cluster=my-cluster": Name of the installation the application operates in, e.g., production or test environment. This is an optional setting. The default value iscluster=default.
-
Run your app and start sending telemetry.
In this example, you will install the Spring PetClinic demo app and configure it to send telemetry to Monium.
To install the demo application, you can temporarily create a Yandex Compute Cloud VM. Learn more about creating a suitable VM here.
Below are examples of commands for installing the demo application on Linux Ubuntu.
Warning
For the OTel Collector agent to work correctly, the VM or server must allow outgoing traffic on TCP port 443.
For the demo application to work correctly, the VM or server must allow incoming traffic on TCP ports 4317, 4318, and 8080.
If you are using a Compute Cloud VM, create and link to it a security group allowing these traffic types.
-
Install Git and Java suitable for your OS. For example:
sudo apt update sudo apt install -y git openjdk-17-jdk -
Download and install an OTel Collector agent suitable for your OS. For example:
wget https://github.com/open-telemetry/opentelemetry-collector-releases/releases/download/v0.144.0/otelcol_0.144.0_linux_amd64.tar.gz tar xvf otelcol_0.144.0_linux_amd64.tar.gz -
Set environment variables containing data for agent authentication in Monium:
export MONIUM_PROJECT=folder__<folder_ID>
export MONIUM_API_KEY=<API_key>
Where:
-
<folder_ID>: ID of the folder to house your Monium project. -
<api_key>: Service account API key.This service account must have the
monium.telemetry.writerrole or more granular roles to writing metrics, logs, or traces. The API key must have theyc.monium.telemetry.writescope or narrower scopes for writing metrics, logs, or traces.
-
-
Create a file named
otel-collector.yamland paste the following contents to it:receivers: otlp: protocols: grpc: http: exporters: otlp_grpc/monium: compression: zstd endpoint: ingest.monium.yandex.cloud:443 headers: Authorization: "Api-Key ${env:MONIUM_API_KEY}" x-monium-project: "${env:MONIUM_PROJECT}" sending_queue: batch: service: pipelines: metrics: receivers: [ otlp ] exporters: [ otlp_grpc/monium ] traces: receivers: [ otlp ] exporters: [ otlp_grpc/monium ] logs: receivers: [ otlp ] exporters: [ otlp_grpc/monium ] telemetry: metrics: level: normal readers: - periodic: exporter: otlp: protocol: http/protobuf endpoint: http://localhost:4318 interval: 30000 timeout: 5000 -
Run the OTel Collector agent:
./otelcol --config otel-collector.yamlOnce active, the agent will start listening on ports
4317(gRPC) and4318(HTTP). -
Open a new terminal window, then download and build the
Spring PetClinicapplication:git clone https://github.com/spring-projects/spring-petclinic cd spring-petclinic ./mvnw -DskipTests packageResult:
... [INFO] ------------------------------------------------------------------------ [INFO] BUILD SUCCESS [INFO] ------------------------------------------------------------------------ [INFO] Total time: 53.308 s [INFO] Finished at: 2026-05-05T18:56:22Z [INFO] ------------------------------------------------------------------------ -
Download the OpenTelemetry Java agent:
curl -L -o opentelemetry-javaagent.jar \ https://github.com/open-telemetry/opentelemetry-java-instrumentation/releases/latest/download/opentelemetry-javaagent.jar -
Run the demo application using the Java agent to send telemetry to OTel Collector:
cd ~/spring-petclinic
OTEL_SERVICE_NAME=spring-petclinic \
OTEL_EXPORTER_OTLP_METRICS_TEMPORALITY_PREFERENCE="delta" \
java -javaagent:./opentelemetry-javaagent.jar -jar target/*.jar
Result:
... 2026-05-05T19:00:31.981Z INFO 3657 --- [ main] o.s.s.petclinic.PetClinicApplication : Started PetClinicApplication in 9.287 seconds (process running for 12.883) -
Open the running
Spring PetClinicdemo app in your browser:- If the application is installed on your local computer, its address is
http://localhost:8080. - If you used a VM to install the application, its address is
http://<VM_public_IP_address>:8080.
- If the application is installed on your local computer, its address is
-
Interact with the demo application UI as a user: open a menu, click a button, enter new owner details, schedule an appointment, etc.
After you finish your app setup, view the telemetry in Monium.
View the data in Monium
-
On the Monium home page, select a data type section on the left:
MetricsLogsTraces-
At the top, set the data search time period on the timeline.
-
In the search bar, enter a query to search for telemetry data:
-
project = <project_ID>: Select the project specified inx-monium-projectof the application's telemetry transmission configuration.This may be a cloud (
cloud__<cloud_ID>) or folder (folder__<folder_ID>) project, or another project. -
cluster = <cluster_name>: Select the name of the installation that runs your application. If no cluster is specified,cluster = defaultis used. -
service = <service_name>: Name of your application or service. You can use theOTEL_SERVICE_NAMEenvironment variable to provide it.If you do not see the required labels in the suggestions, you can enter them manually. However, the system most likely has not received data with these labels. For more on troubleshooting possible issues, see Data delivery troubleshooting.
-
-
Click Execute query or Execute.
The page will show data that matches the query.
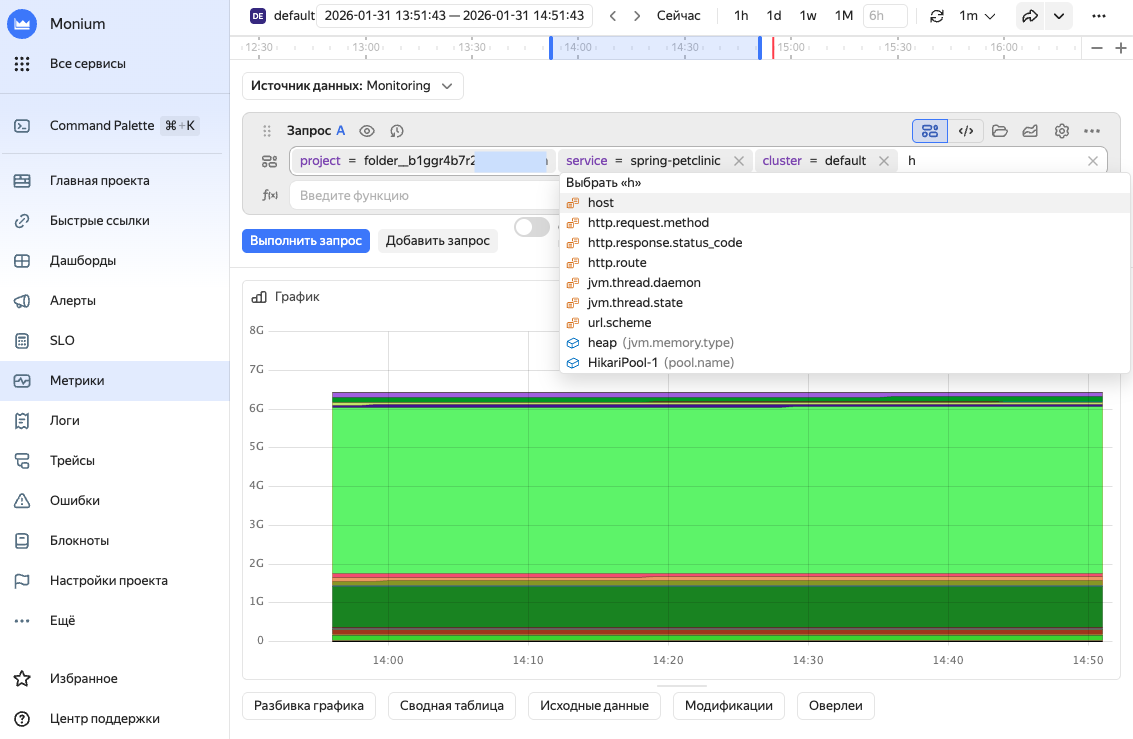
More on metrics.
-
At the top, set the data search time period on the timeline.
-
In the search bar, enter a query to search for telemetry data:
-
project = <project_ID>: Select the project specified inx-monium-projectof the application's telemetry transmission configuration.This may be a cloud (
cloud__<cloud_ID>) or folder (folder__<folder_ID>) project, or another project. -
cluster = <cluster_name>: Select the name of the installation that runs your application. If no cluster is specified,cluster = defaultis used. -
service = <service_name>: Name of your application or service. You can use theOTEL_SERVICE_NAMEenvironment variable to provide it.If you do not see the required labels in the suggestions, you can enter them manually. However, the system most likely has not received data with these labels. For more on troubleshooting possible issues, see Data delivery troubleshooting.
-
-
Click Execute query or Execute.
The page will show data that matches the query.
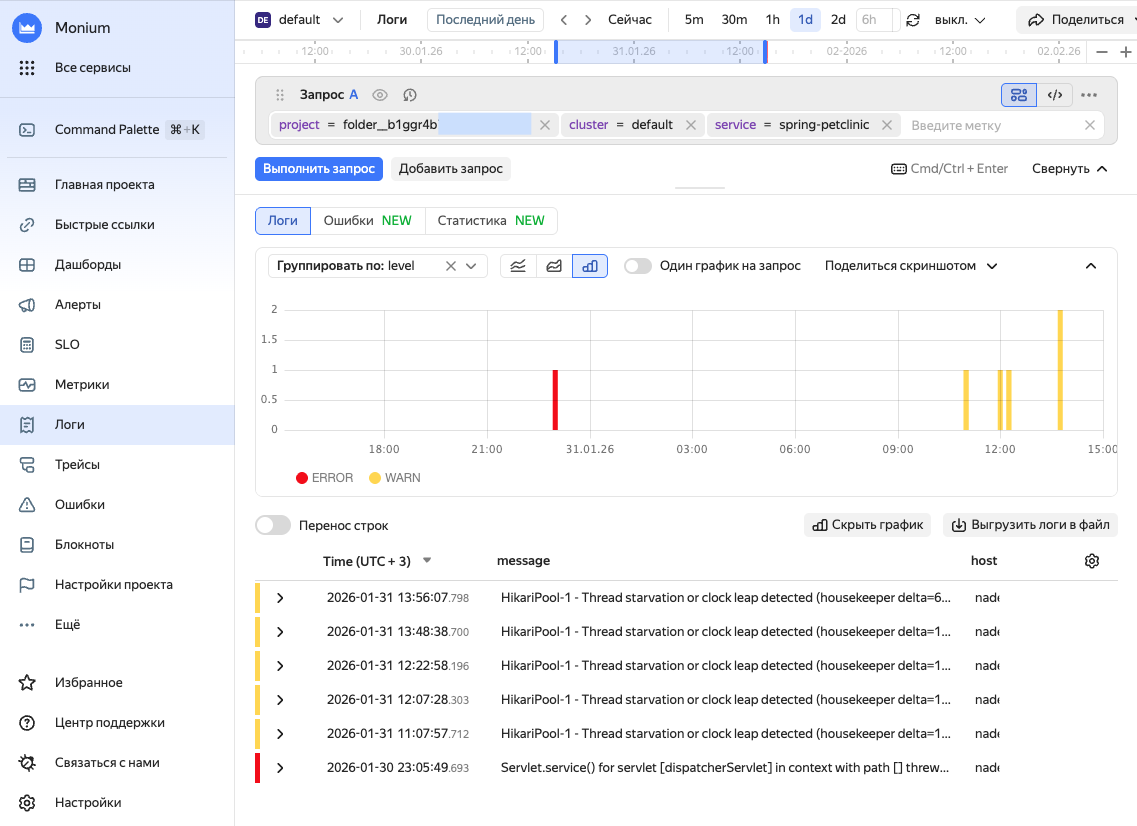
More on logs.
-
At the top, set the data search time period on the timeline.
-
In the search bar, enter a query to search for telemetry data:
-
project = <project_ID>: Select the project specified inx-monium-projectof the application's telemetry transmission configuration.This may be a cloud (
cloud__<cloud_ID>) or folder (folder__<folder_ID>) project, or another project. -
cluster = <cluster_name>: Select the name of the installation that runs your application. If no cluster is specified,cluster = defaultis used. -
service = <service_name>: Name of your application or service. You can use theOTEL_SERVICE_NAMEenvironment variable to provide it.If you do not see the required labels in the suggestions, you can enter them manually. However, the system most likely has not received data with these labels. For more on troubleshooting possible issues, see Data delivery troubleshooting.
-
-
Click Execute query or Execute.
The page will show data that matches the query.
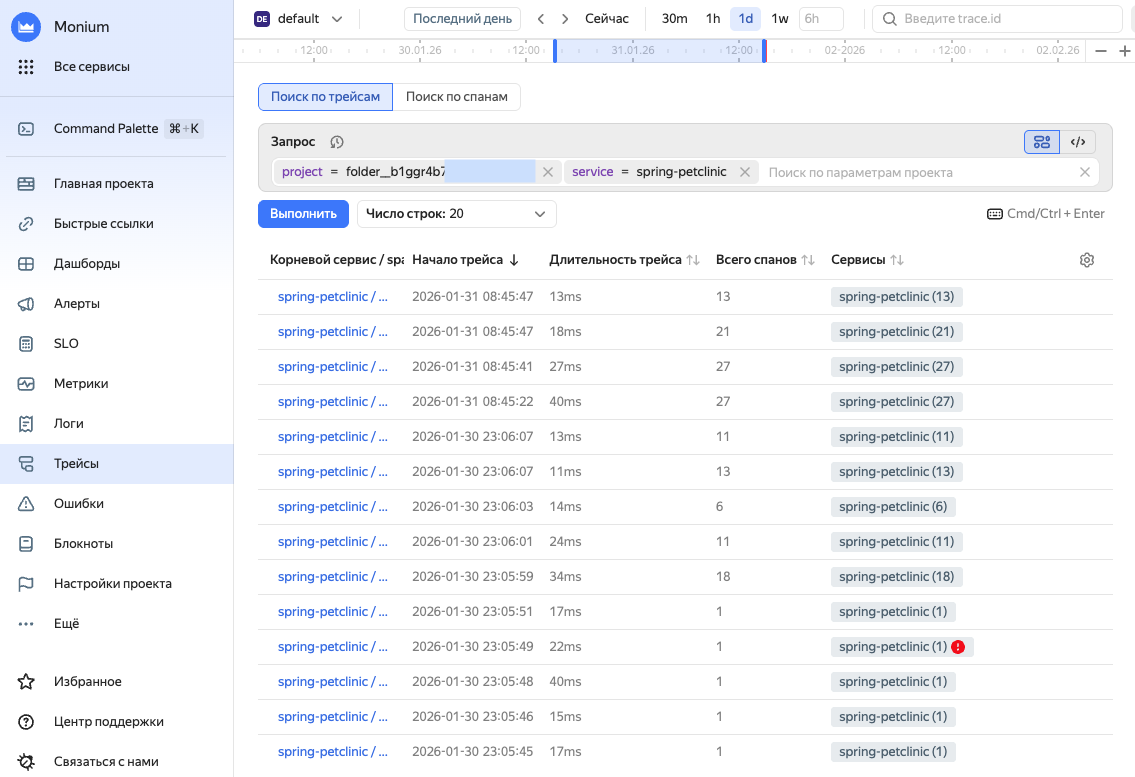
More on traces.
-
-
To view information about the data shard, select Shards on the left and then, the shard with your service name.
Note
Keep in mind that data in Monium appears with a lag rather than immediately, since the Otel Collector starts sending data after 60 seconds.
To use the data you collected, you can create dashboards and alerts.