Setting up a demo app and collecting telemetry in Kubernetes


You will set up a demo app in a Kubernetes cluster and send the app's telemetry data to Monium. This guide uses Managed Service for Kubernetes to deploy a cluster, but you can any of your Kubernetes clusters.
Getting started
Sign up for Yandex Cloud and create a billing account:
- Navigate to the management console and log in to Yandex Cloud or create a new account.
- On the Yandex Cloud Billing page, make sure you have a billing account linked and it has the
ACTIVEorTRIAL_ACTIVEstatus. If you do not have a billing account, create one and link a cloud to it.
If you have an active billing account, you can create or select a folder for your infrastructure on the cloud page.
Learn more about clouds and folders here.
Required paid resources
The cost of resources you need for Monium includes:
- Fee for using a Managed Service for Kubernetes master (see Managed Service for Kubernetes pricing).
- Fee for the Managed Service for Kubernetes node group's computing resources and disks (see Yandex Compute Cloud pricing).
- Fee for using Monium (see Monium pricing).
Setting up a cluster
-
Create an Kubernetes cluster.
-
Install Helm v3.8.0 or higher.
-
Install kubectl and configure it to work with the new cluster.
-
Add the OpenTelemetry Helm charts repository:
helm repo add open-telemetry https://open-telemetry.github.io/opentelemetry-helm-charts
helm repo update
From this repository you will install OpenTelemetry Collector, which will collect telemetry from your Kubernetes cluster apps, plus OpenTelemetry Demo, an online store demo app.
-
Create a service account with the
monium.telemetry.writerrole and an API key with theyc.monium.telemetry.writescope. -
Add the API key to the cluster secrets:
export NS=default
kubectl -n $NS create secret generic monium-secrets \
--from-literal=MONIUM_API_KEY='<API_key>'
Delivering and viewing telemetry
-
Create a file named
otel-demo-monium.ymlwith the following configuration:# https://github.com/open-telemetry/opentelemetry-helm-charts/blob/main/charts/opentelemetry-demo/README.md opentelemetry-collector: extraEnvsFrom: - secretRef: name: monium-secrets config: receivers: # Collection of grafana metrics, not configured in the demo app by default prometheus: config: scrape_configs: - job_name: "grafana" kubernetes_sd_configs: - role: pod relabel_configs: # Filtering by label (keep grafana only) - source_labels: [__meta_kubernetes_pod_label_app_kubernetes_io_name] action: keep regex: grafana # Replacing the address with the pod IP and port 3000 - source_labels: [__address__] action: replace regex: "([^:]+)(?::\\d+)?" replacement: "$1:3000" target_label: __address__ # Specifying the path to the metrics - action: replace target_label: __metrics_path__ replacement: /grafana/metrics exporters: debug: verbosity: detailed otlp/monium: compression: none endpoint: ingest.monium.yandex.cloud:443 headers: Authorization: "Api-Key ${env:MONIUM_API_KEY}" x-monium-project: folder__<folder_ID> service: extensions: [health_check] pipelines: traces: receivers: [otlp] exporters: [otlp, spanmetrics, otlp/monium] logs: receivers: [otlp] exporters: [opensearch, otlp/monium] metrics: receivers: [httpcheck/frontend-proxy, otlp, prometheus, redis, spanmetrics] exporters: [otlphttp/prometheus, otlp/monium] telemetry: resource: service: otel-collector metrics: level: detailed readers: - periodic: exporter: otlp: endpoint: ${env:MY_POD_IP}:4317 protocol: grpc interval: 10000 timeout: 5000 -
Install the demo app to deliver logs, metrics, and traces to Monium:
helm uninstall otel-demo-monium -n $NS --ignore-not-found helm install otel-demo-monium open-telemetry/opentelemetry-demo \ --version 0.37 \ -n $NS \ --values otel-demo-monium.yml -
Generate traffic to send telemetry.
-
Configure port forwarding for
frontend-proxy:kubectl --namespace default port-forward svc/frontend-proxy 8080:8080 -
In your browser, open the online store at
http://localhost:8080/and simulate user activity. For example, add an item to the cart.
-
View telemetry data
-
On the Monium home page, select Shards on the left.
-
In the list, select the shard with the name of the service operating within the online store, e.g.,
cartorproduct-catalog.The shard name follows the
<project_name>_<cluster_name>_<service_name>format, e.g.,folder__b1g86q4m5vej********_default_cart. -
To view a specific data type, on the left, select:
-
Metrics.
In the query string, select the following one by one
*project=folder__<folder_ID>.
*cluster=default.
*service=cart.
* and click Execute query.Example of a chart with metrics
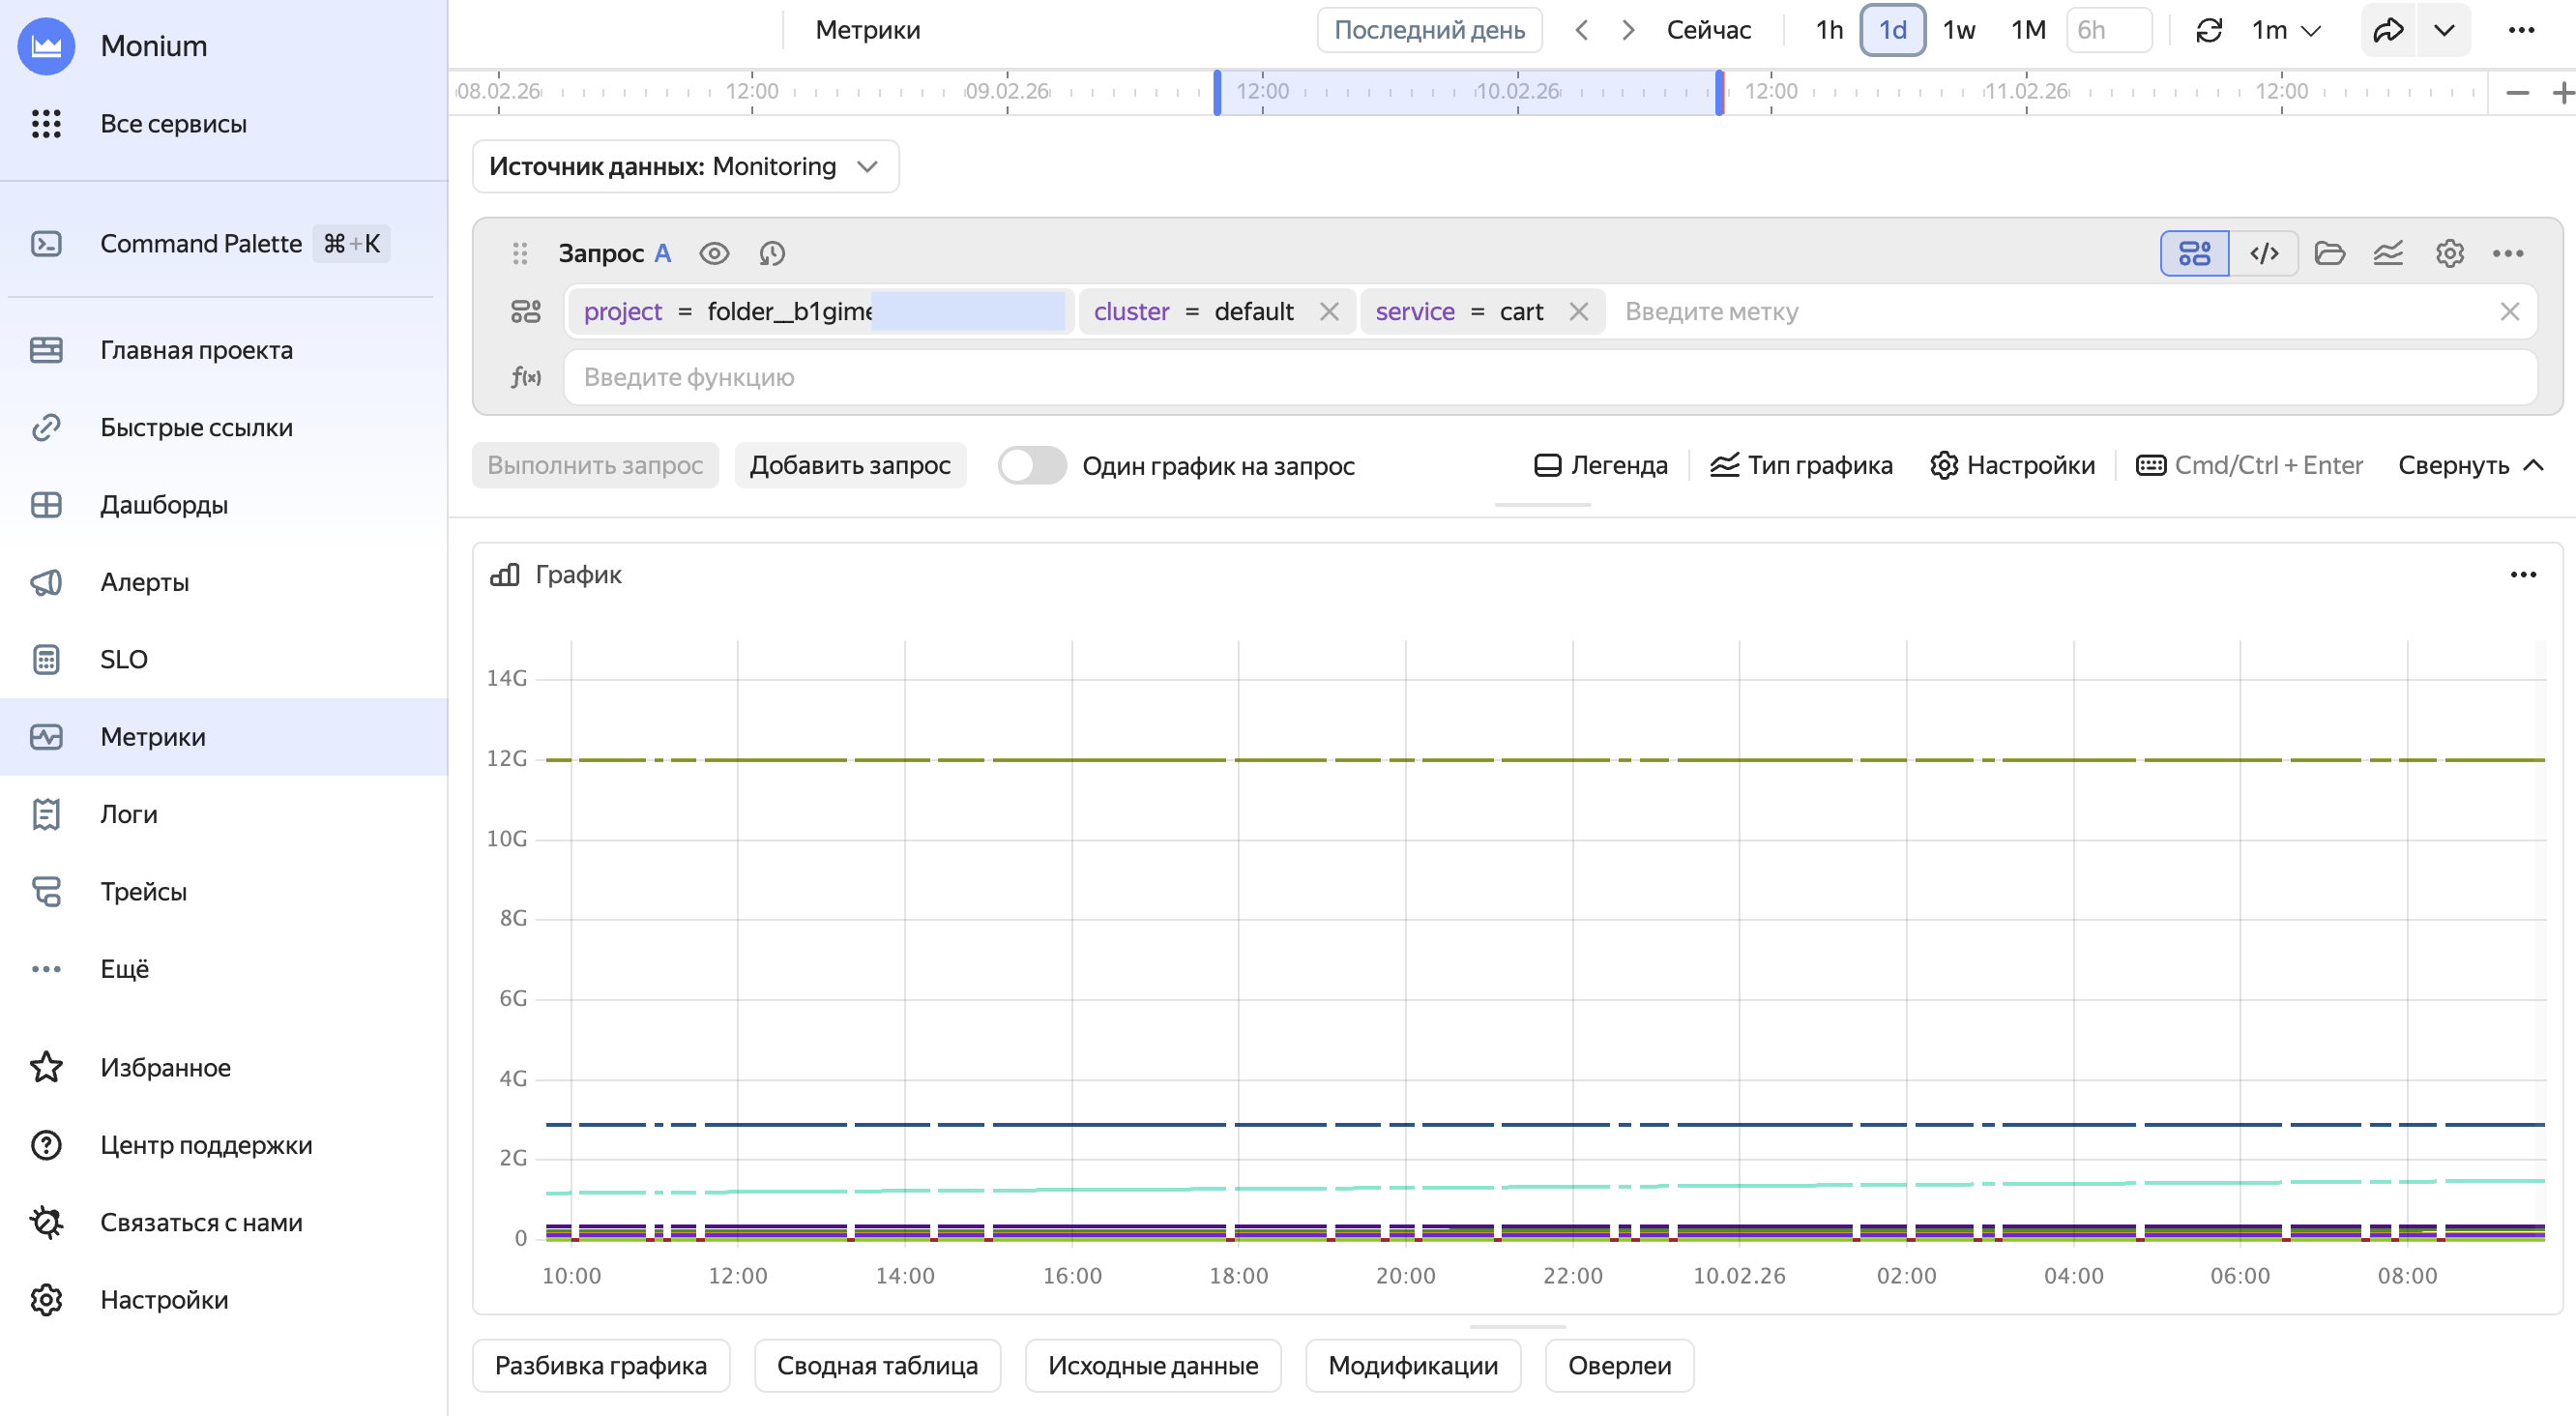
More on metrics.
-
Logs.
In the query string, select
project,cluster, andserviceone by one and click Execute query.Example of a page with logs
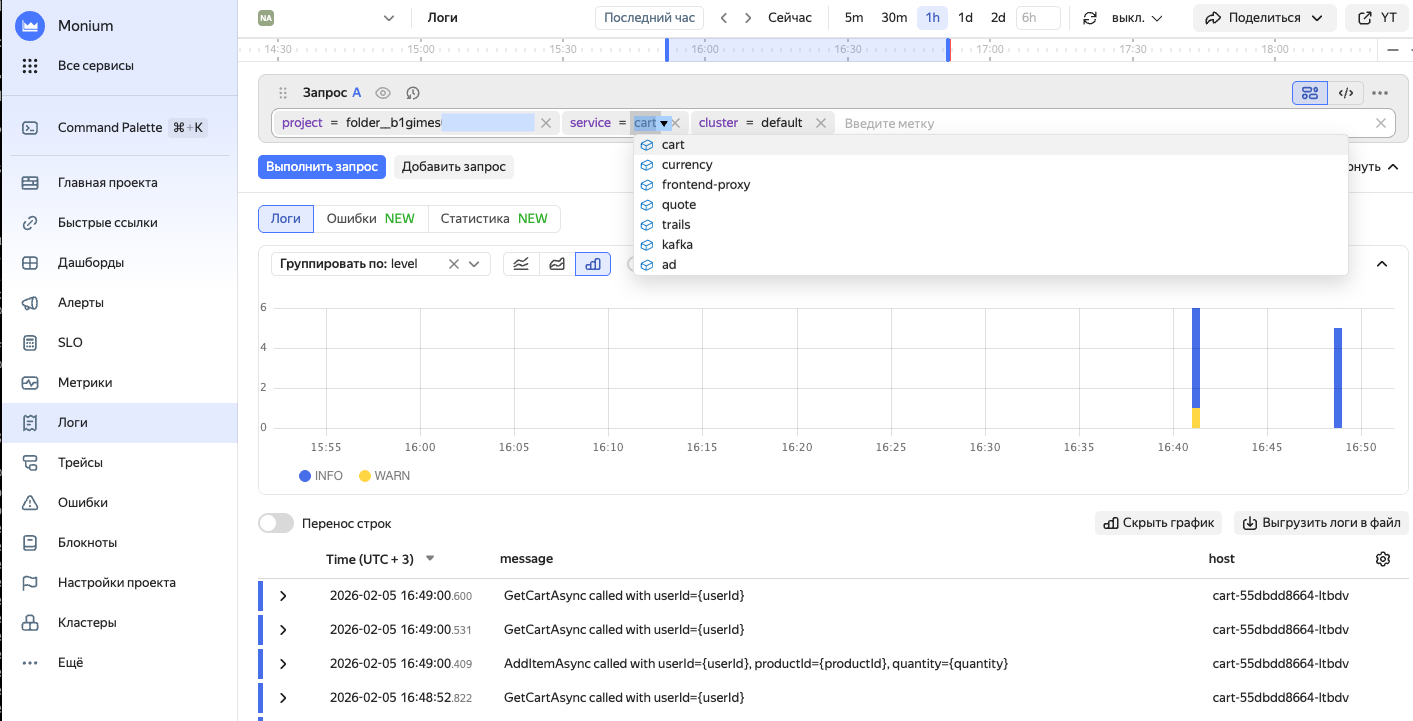
More on logs.
-
Traces.
In the query string, select
projectandserviceone by one and click Execute.Example of a page with traces
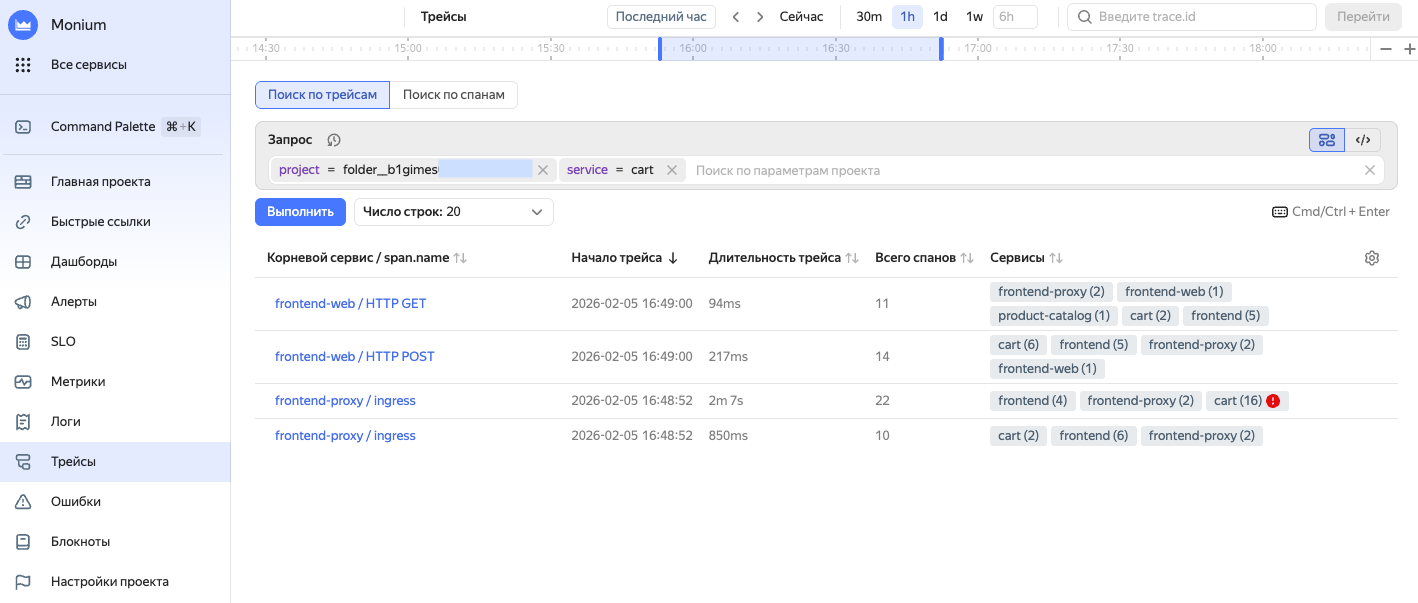
More on traces.
-
To use telemetry data, create a dashboard and alerts.
If Monium does not show telemetry
-
Make sure the service account and API key have the required roles and scopes.
-
Check that the secrets feature the correct API key:
kubectl get secret monium-secrets -n $NS -o jsonpath='{.data.MONIUM_API_KEY}' | base64 -d -
Check the OTel Collector logs:
kubectl logs -l app.kubernetes.io/name=opentelemetry-collector -n $NS -
Make sure the Monium endpoint is accessible:
kubectl run -it --rm debug --image=curlimages/curl --restart=Never -- \
curl -v https://ingest.monium.yandex.cloud