Yandex Music podcasts: Statistics

Let’s use a podcast from Yandex Music you have access to as your data source.
With podcast analytics, you can get statistics and analyze podcast listening and subscriber data in Yandex Music. To work with podcast analytics, you must have access to at least one podcast.
Note
Statistics in DataLens are updated once a day, so there may be a lag between the chart data and the actual data you see in the service.
To visualize and analyze the data, follow these steps:
We recommend checking out this FAQ covering questions commonly asked by Yandex Music podcast statistics users.
1. Set up your connection
1.1 Set up DataLens
Yandex DataLens is deployed on the Yandex Cloud platform.
Get ready to work with DataLens guided by your experience:
- You are a new user (you only want to use Yandex DataLens for podcast analysis).
- You are already using Yandex DataLens (for other purposes).
To get started with DataLens:
- Log in to your Yandex account. If you do not have an account, create one.
- Open the DataLens home page.
- Click Start in cloud.
- Confirm that you have read the Terms of use and click Log in.
-
Log in to your Yandex account.
-
Open the DataLens home page.
-
Click Start in cloud.
-
Select one of these options:
-
If you already have an organization, select it from the drop-down menu in the Organizations tab and click DataLens.
Note
To activate a DataLens instance, the user must have the
adminorownerrole. For more information about roles, see Access management in Yandex Identity Hub. -
If you have a cloud but no organization, click Add new DataLens. In the window that opens, enter a name and description for your organization and click Create organization and DataLens. For more information about working with organizations, see Getting started with organizations.
-
If you encounter a technical issue with the service, contact Yandex Cloud support. To ask for advice, discuss a solution to your issue, or explore current best practices, join the DataLens chat in Telegram.
1.2. Create a connection
Warning
Only users with permissions for a Yandex Music podcast can create connections and process podcast analytics. If you do not have access to any podcast, no data will be displayed on the dashboard.
You will get access after uploading a podcast to Yandex Music. The podcast is linked to the Yandex email address you specified when uploading it.
-
Follow the link you received in the email after filling out the form for your connection.
-
Enter a name for the connection, e.g.,
My Podcast(you can use any name). -
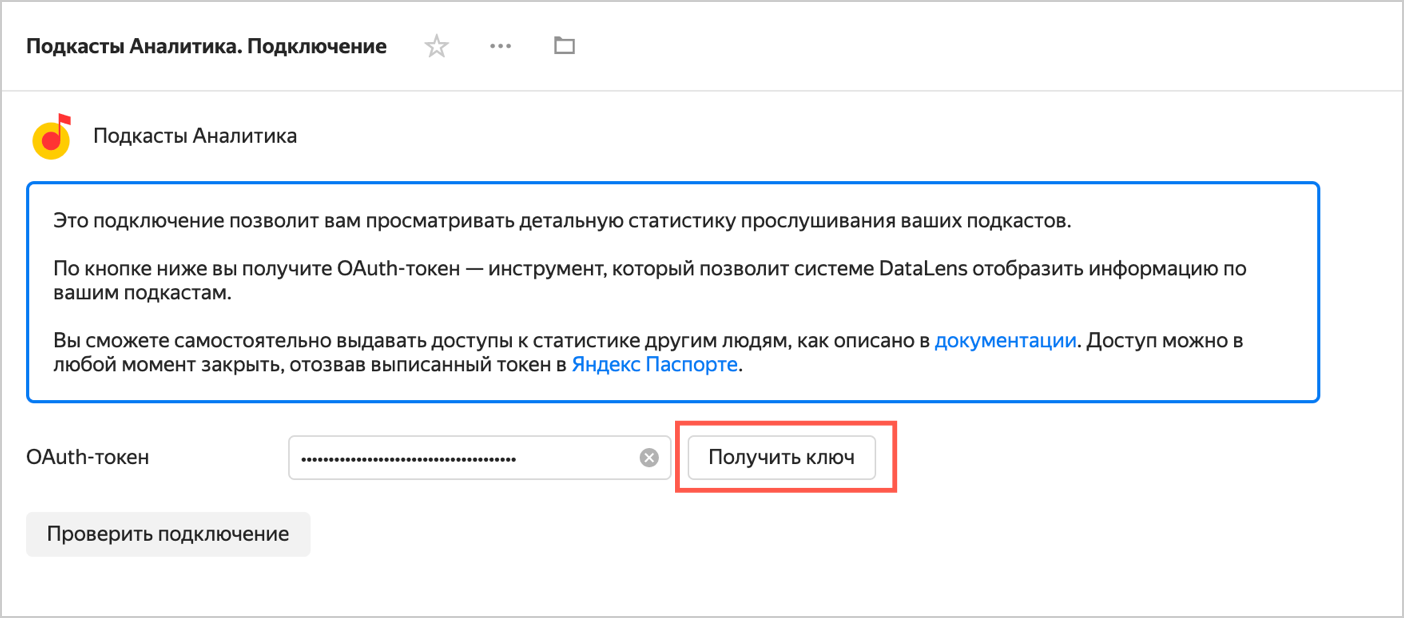
Click Get key. If this is your first time creating a connection to Yandex Music podcasts, grant the service the required permissions.
-
Click Check connection.
-
After successfully checking the connection, click Create.
-
Go to the Dashboards menu and open the
Yandex Music podcast analyticsdashboard. If there is no data, make sure your current account has access to podcasts by contacting the support team.
1.3. Review podcast statistics in DataLens
-
After you created the connection, a folder containing a set of standard objects that your statistics are based on opens:
 The
The Yandex Music podcast analyticsdashboard is the main statistics page featuring all the widgets, such as charts, tables, and filters. Save the page link to quickly access the dashboard.Other objects
-
 Connection: Set of parameters for accessing podcast data. It is the key the user needs to open the statistics.
 -
 Datasets: Sets of dimensions and measures used to create charts.
D01. Podcast listens: Dataset with data on listens.D02. Podcast subscribers: Dataset with data on subscribers.
-
 Charts: Set of individual visualizations (diagrams and tables) used on the dashboard.
 -
The
Metrica Live Demo Dashboardand theSales Dashboardare demos that may open in your connection. You can delete them if you need to.
-
-
Open the
Yandex Music podcast analyticsdashboard.-
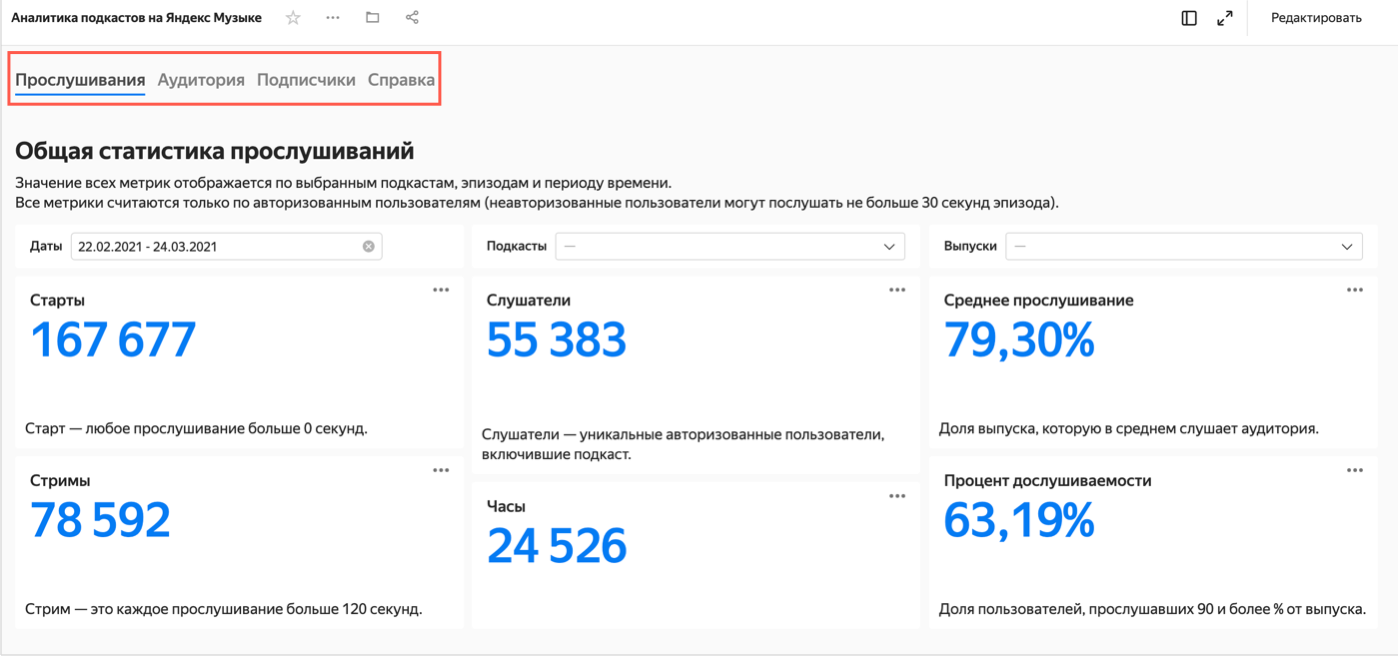
The dashboard has four tabs:
- Listens: General listening statistics, listening dynamics, statistics on the number of times individual episodes were listened to, and distribution of listening by day of week and time of day.
- Audience: Podcast audience statistics, including socio-demographic data on listeners.
- Subscribers: Audience statistics, subscribe/unsubscribe dynamics, and socio-demographic data on subscribers.
- Reference: Reference on estimated measures and terms used in data and dashboards.
-
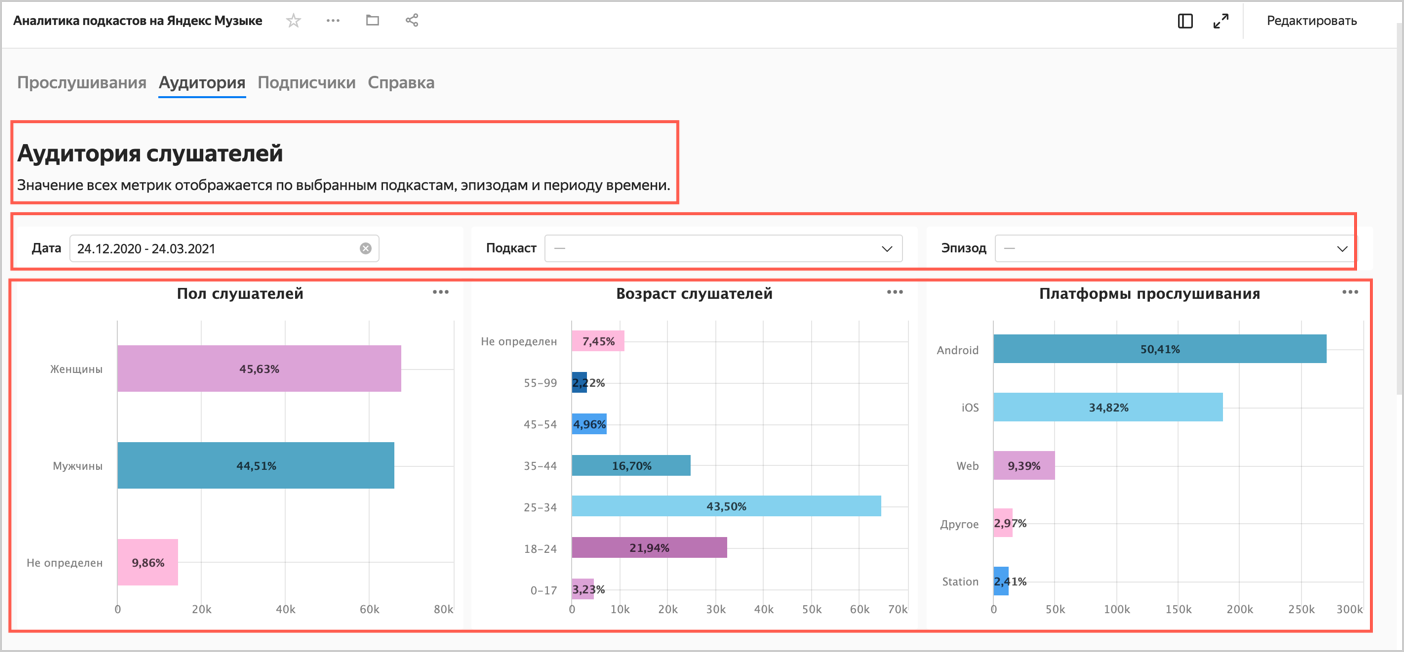
Each tab contains:
- Text widgets: Headers, comments, and tooltips.
- Selectors: Filters by different dimensions that can be used to filter the contents of dashboards.
- Charts: Graphs, tables, and other visualizations.
-
You can edit it and add standard objects as needed. For example, delete an unnecessary chart from the dashboard or add a new one, change an existing chart, or add a selector to the dashboard.
2. Edit a dashboard and chart, and create new ones
2.1. Edit a dashboard
You can change the order of charts and selectors, resize them, discard some data and, vice versa, put together the most relevant information. Try to edit the dashboard after making a copy of it:
-
In the left-hand menu, go to the Dashboards section.
-
Next to the
Yandex Music podcast analyticsdashboard, click and select Copy. -
Open the dashboard copy and go to the
Audiencetab. -
Click Edit in the top-right corner.
-
Let's say you want to delete the
Listening platformschart. To do this, click in the top-right corner of the chart and select Delete.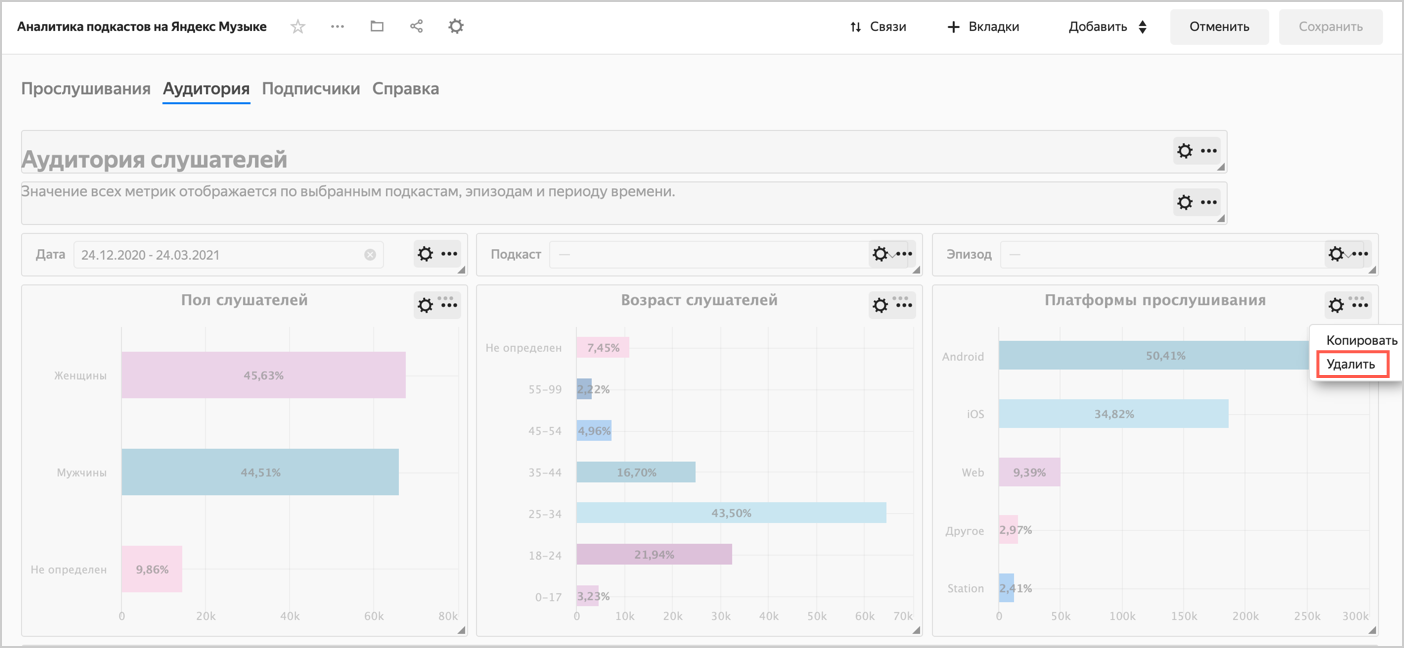
-
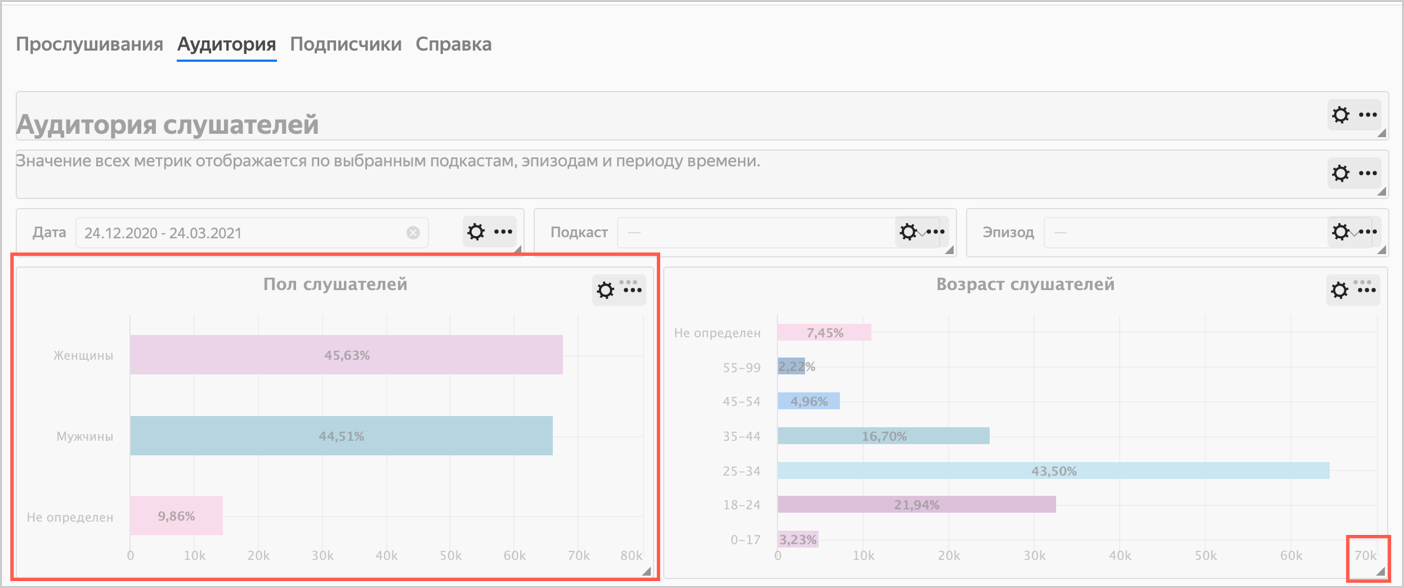
Position the
Listener genderandListener agecharts so that they fill in the empty space left after deleting the chart in the previous step.- Drag the chart by clicking it. Resize the chart using the triangle in the bottom-right corner.
-
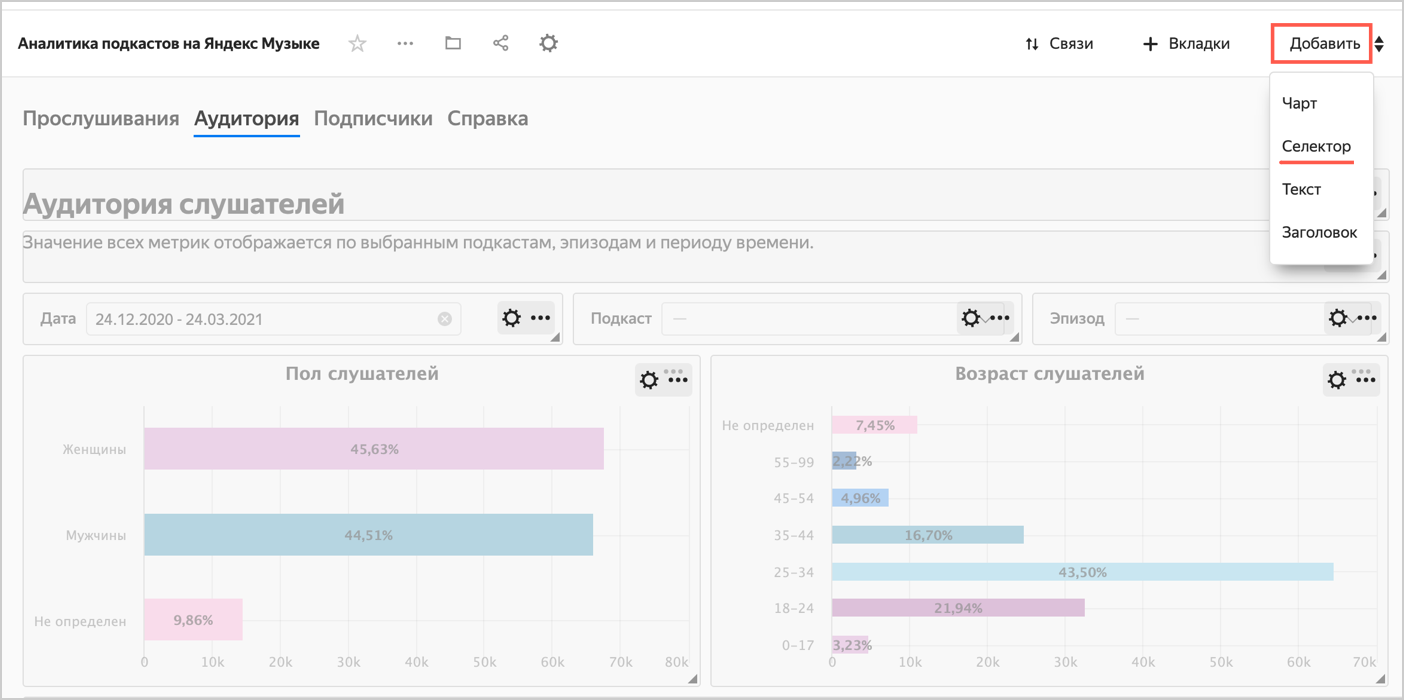
Click Add and choose Selector.
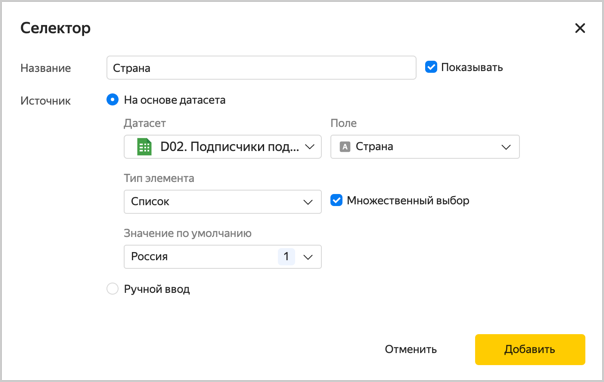
- Select the dataset named
D02.Podcast subscribers. - Select the
Countryfield. This will automatically populate the Title with the name of the selected field. - Activate the Show next to the selector title option.
- Click the Show checkbox next to the selector header.
- Enable Multiple choice.
- In the Default value list, select
Russia(or any other country). - Click Add.
- Select the dataset named
-
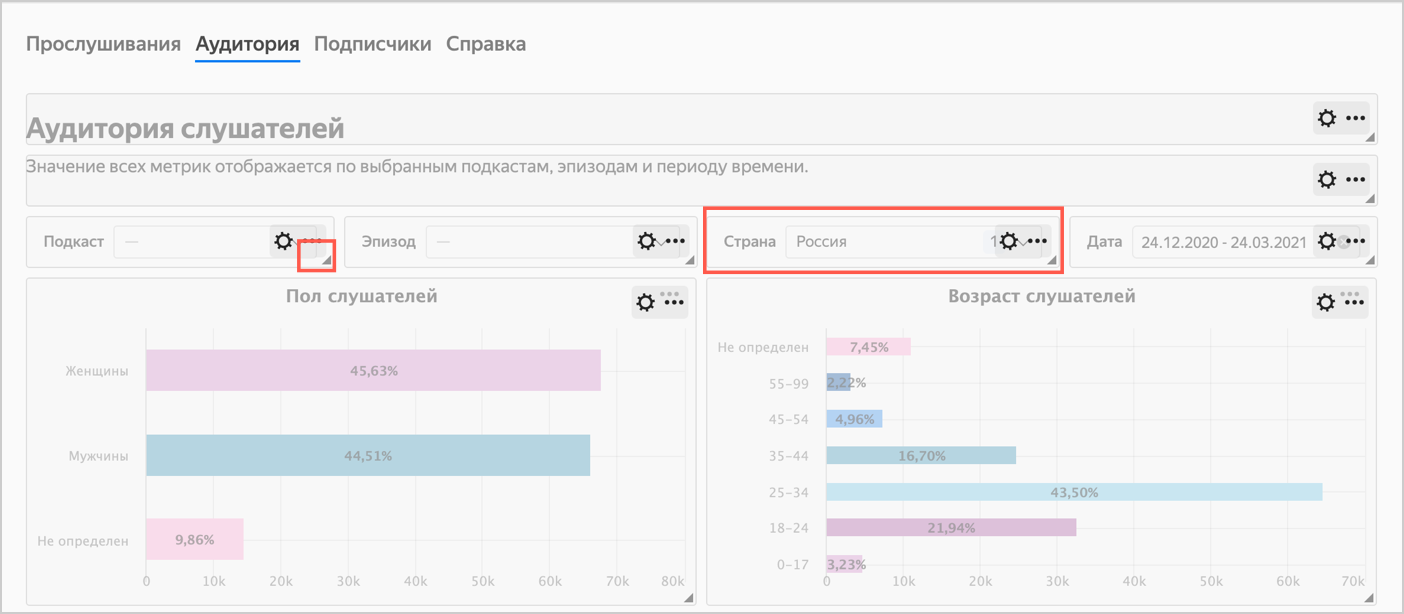
Move the selector to the top. You can resize the charts if needed.
-
Place the selectors on the same line, resizing them.
-
Click Save in the top-right corner of the dashboard.
2.2. Edit a chart
You can edit and configure any charts. Let's say we want to see on the chart the relative activity of listeners of different genders during the day.
-
Open the
Yandex Music podcast analyticsdashboard and click theListenstab. -
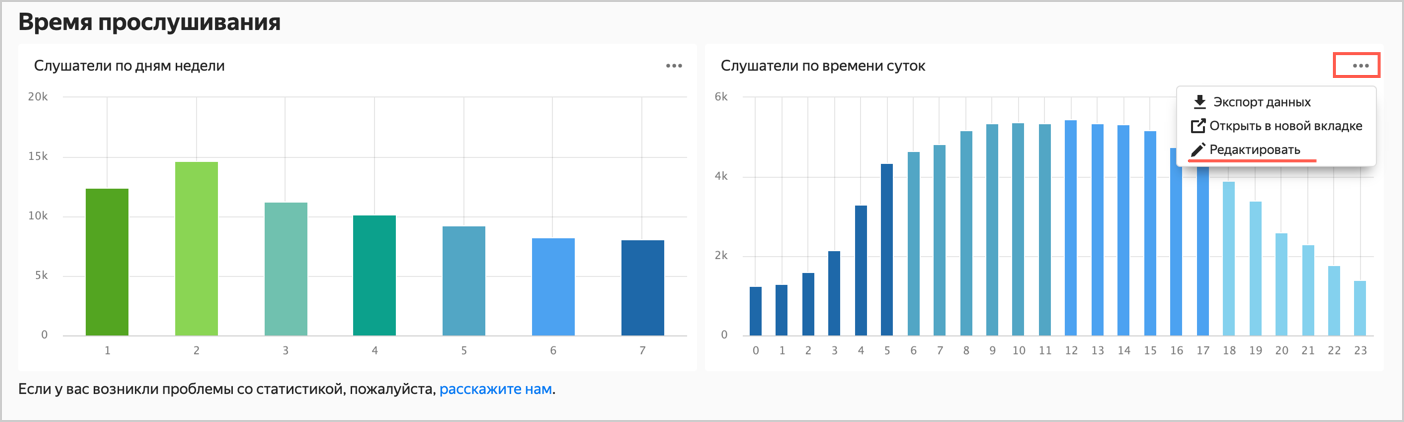
Scroll the dashboard down to the
Listening duration by time of daychart. -
Click in the top-right corner of the chart and select Edit.
-
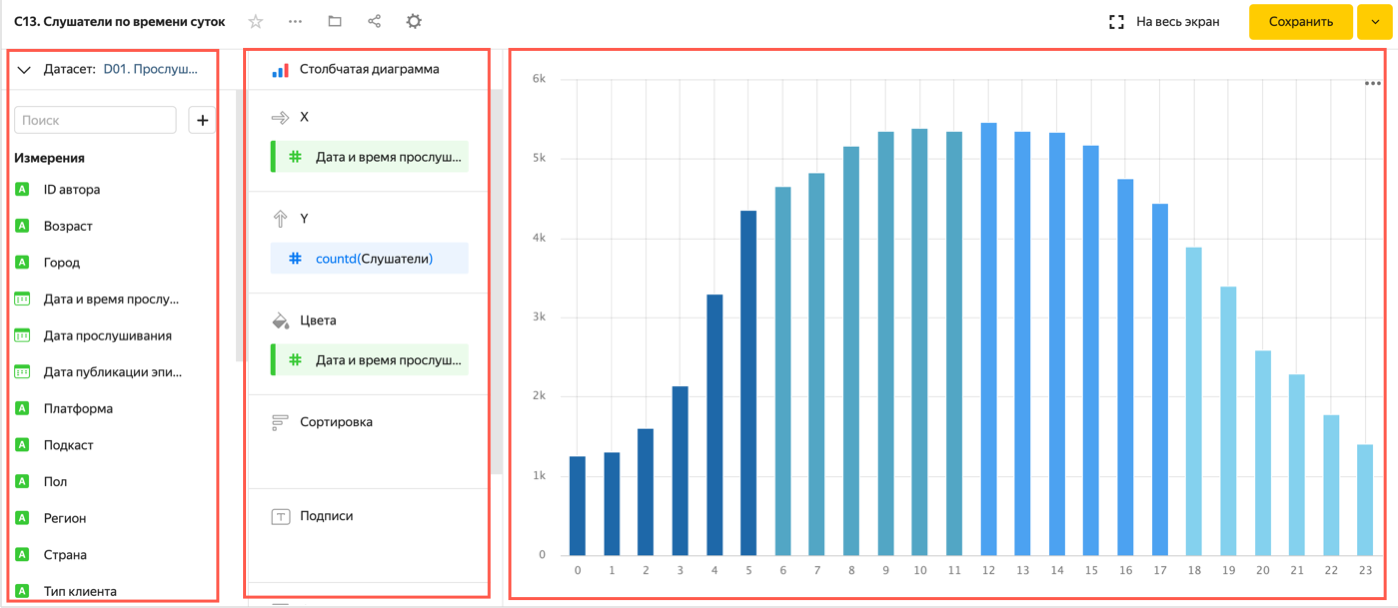
The chart configuration area (wizard) consists of these three main parts:
- Selection panel with a list of available dimensions and measures for building a chart.
- Visualization settings panel with various sections you can use to configure your chart.
- Chart preview.
-
Delete the
Listening date and timedimension from the Colors section. -
Add a dimension named
Genderto the Colors section.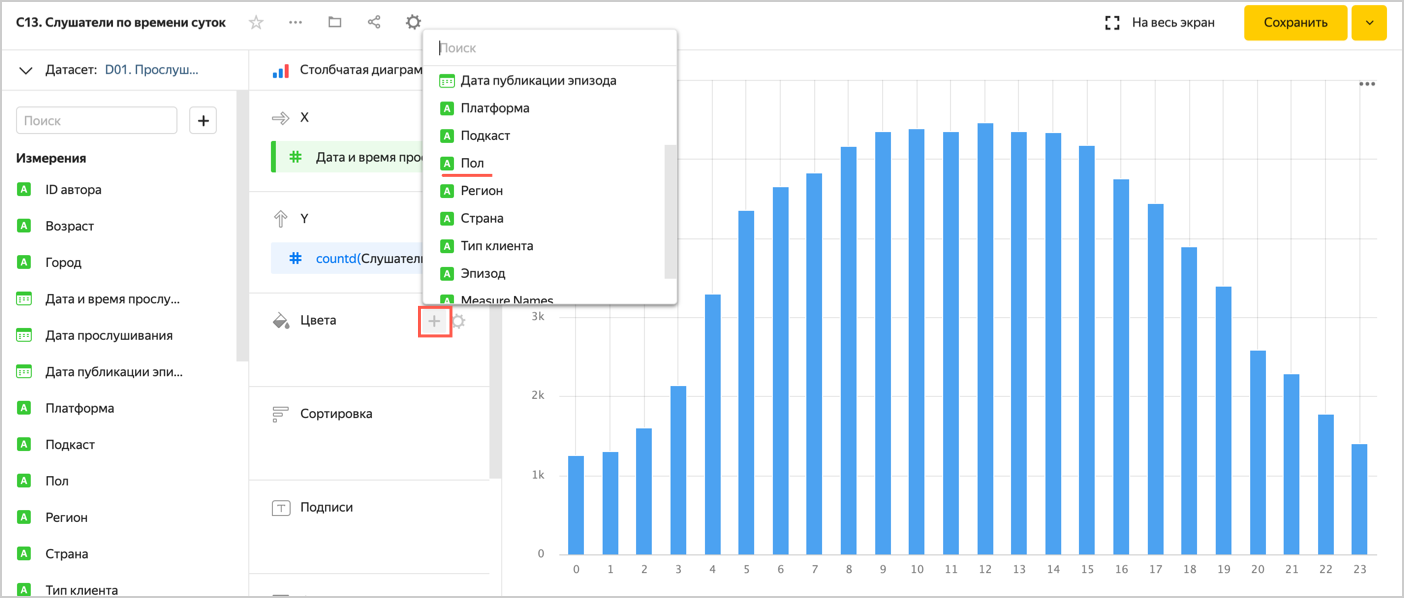
-
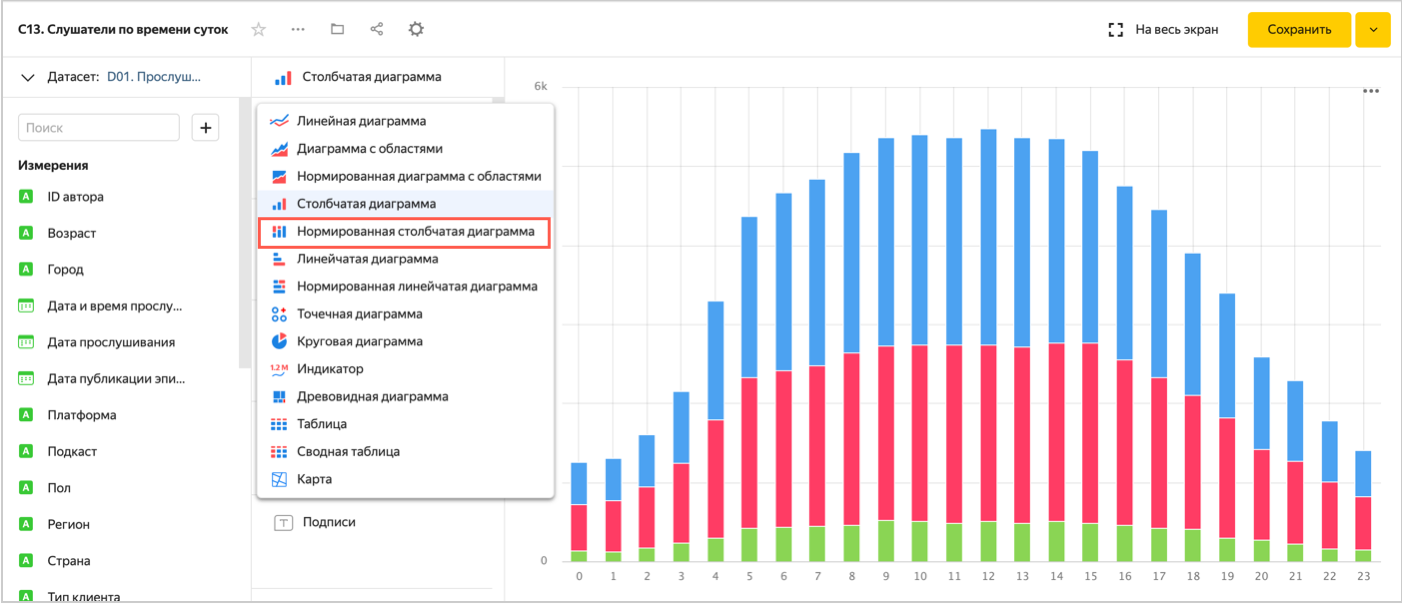
Select a different visualization type: Normalized column chart.
-
Now, each column shows the relative distribution of
ListenersbyGenderin terms ofTime of day. Click Save in the top-right corner of the chart.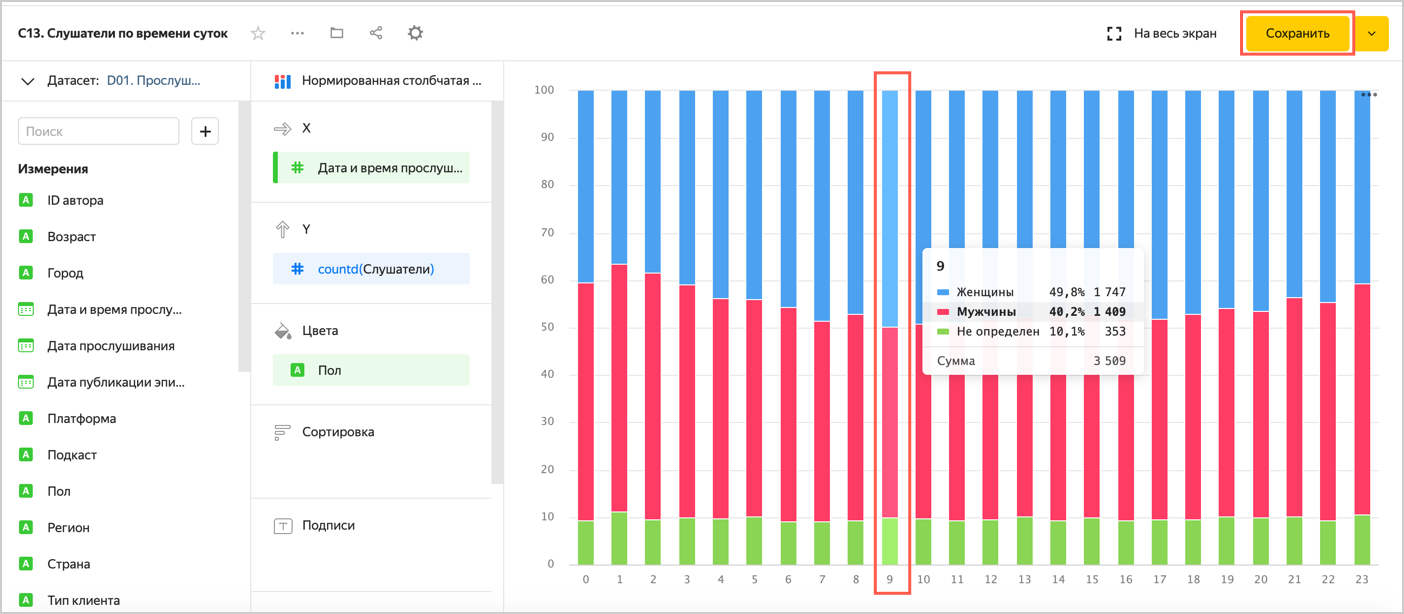
Refresh the dashboard page to apply the chart changes.
2.3. Create a new chart and add it to the dashboard
Let's say we want to build a chart with the total number of listens by stream over the entire period.
-
Open the service home page.
-
Click Create chart.
-
Go to the
Podcastsfolder. -
Select the
D01. Podcast listensdataset.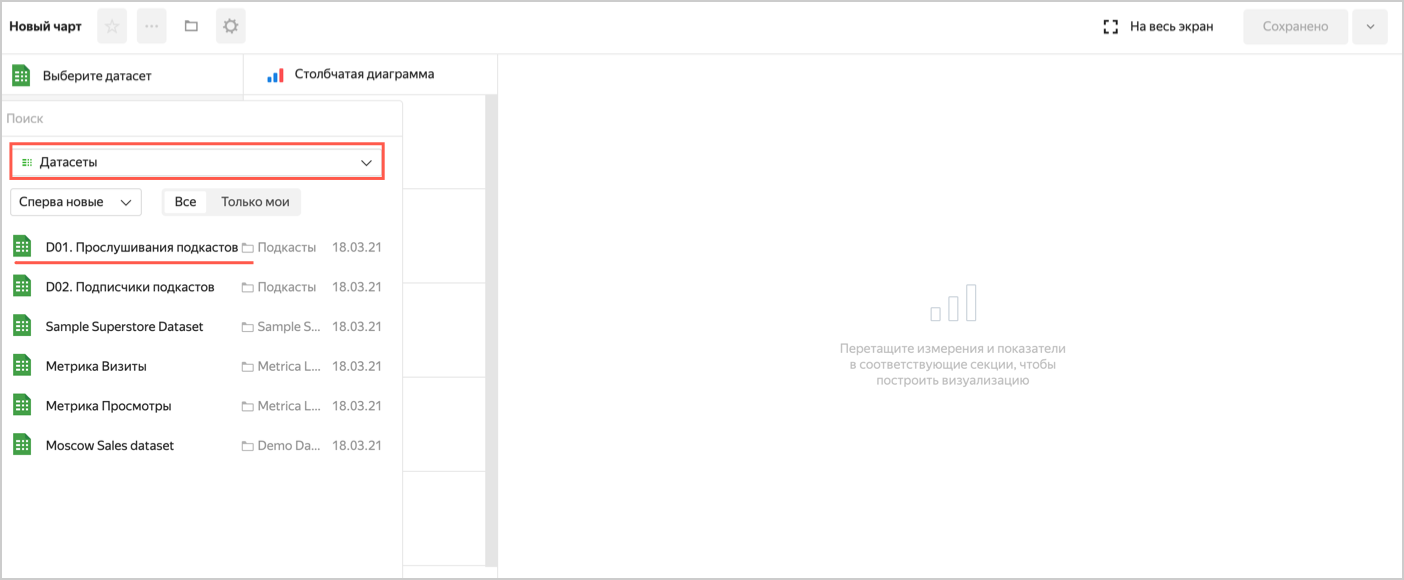
-
Select Area chart as the visualization type.
-
Add a dimension named
Listening dateto the X section. -
Add a measure named
Listenersto the Y section. -
Add the
Listening datedimension to the Filters section.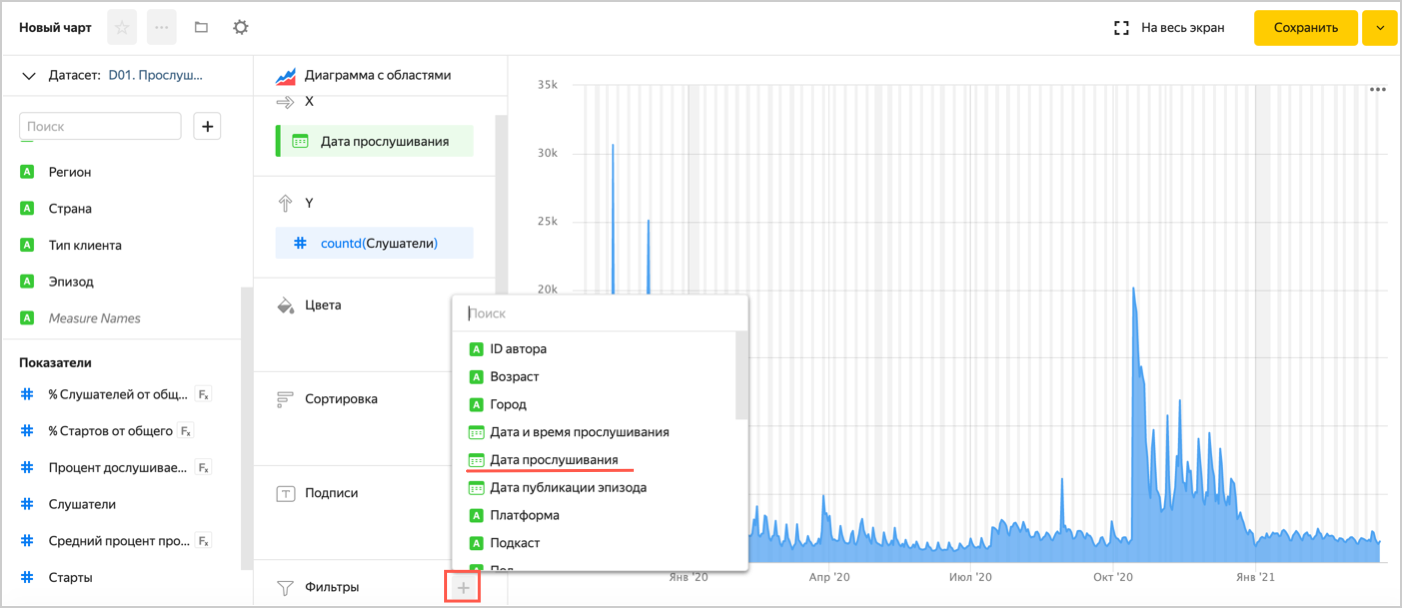
-
Click
 in the
 Listening datefield under Filters.- In the Preset list, select Last 365 days and click Apply filter.
-
-
Click
in the Listening datefield under X.- In the Grouping list, select Month and click Apply.
-
Add the
Episodedimension to the Colors section. -
If you have too many episodes, hide the legend at the bottom of the chart. To do this, click ⟶ Hide, then Apply.
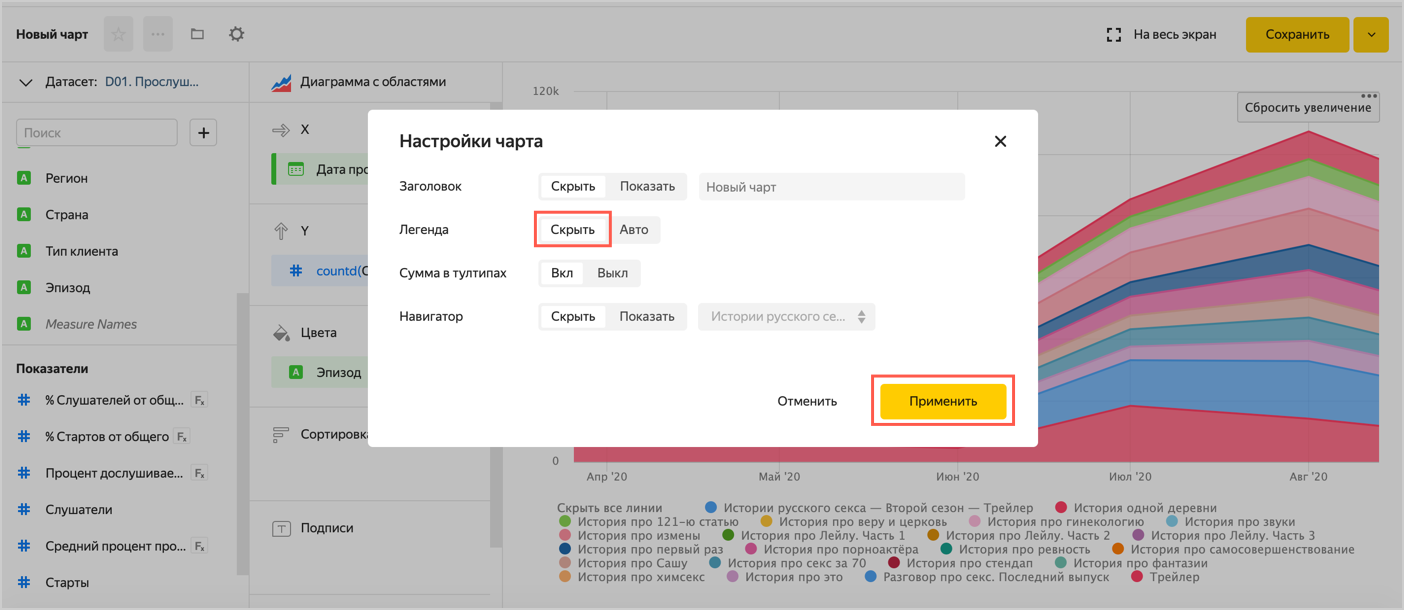
-
Click Save in the top-right corner of the chart.
- Enter the name
Episode listening dynamicsand click Apply filter.
Note
If the
Listening datefield filter is added to the dashboard, filtering by this field in the chart is ignored. - Enter the name
-
Go to the chart's top panel and click the navigation icon.
-
In the window that opens, select the
Yandex Music podcast analyticsdashboard. -
In the top-right corner of the dashboard, click Edit.
-
Click Add ⟶ Chart.
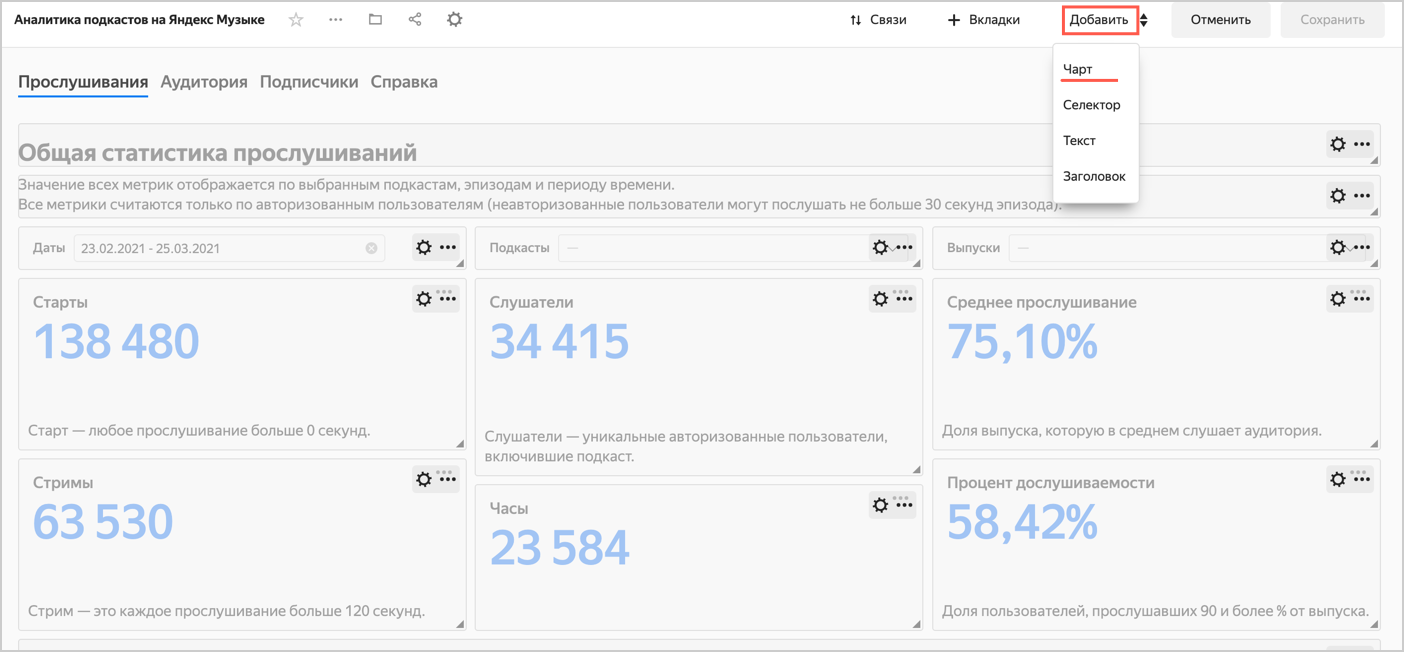
-
In the window that opens, click Select.
- Select the
Listening dynamics by episodechart. This will automatically populate the Title field with the name of the selected chart. - Click Add.
- Select the
-
Place the chart next to the table in the
Episode listening statisticssection and click Save.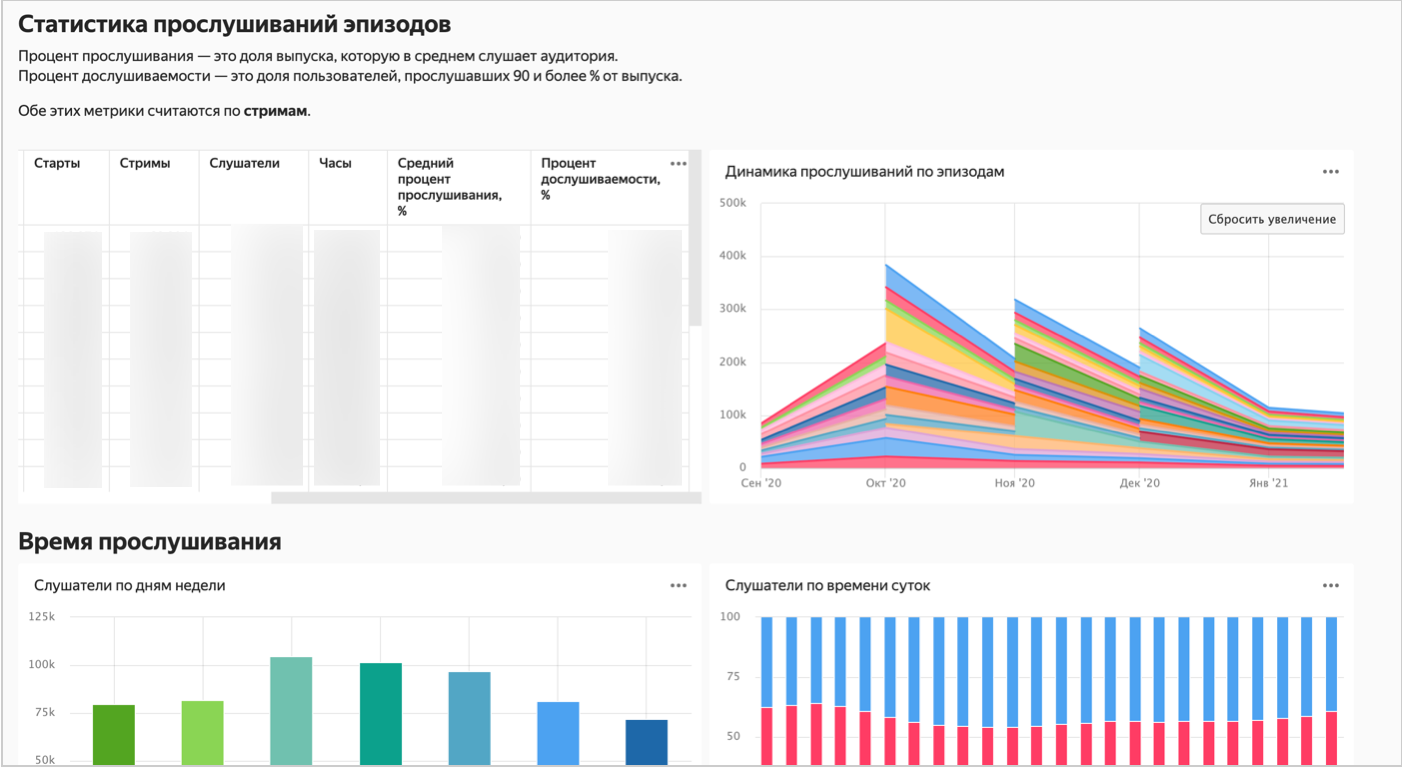
3. Share podcast analytics
Yandex DataLens has a single service plan where access is free for individual users and teams are billed based on the number of seats.
Optionally, purchase additional seats for users you want to share podcast analytics with.
For more information, see our pricing policy for DataLens.
3.1. Grant access to DataLens
You can grant access to your personal dashboard to other users. To do this, you only need a Yandex account.
Set up access to Yandex DataLens:
-
Go to Access management.
-
In the top-right corner, click Add user.
-
Enter the user's Yandex email address. The new user will appear in the list of users.
-
Click next to the new user and select Change roles.
-
Under Roles in folders, select a folder. In the Roles column, click . Assign the
datalens.instances.userrole.
After that, you can share a link to the dashboard with the new user. -
Make sure the new user has the permissions to access the dashboard with podcast statistics depending on its location:
WorkbookDirectoryWorkbook permissions apply to all objects within the workbook. Grant access to the workbook the podcast statistics dashboard is in:
-
At the top of the workbook, click Access.
-
Permissions must be assigned to a specific user or a group the user is a member of. If there are no permissions, click Add user.
-
In the window that opens, select a user or user group and specify an access permission for the workbook:
Restricted view: Allows viewing the workbook’s nested charts and dashboards and the info on the access permissions for it.View: Allows viewing all the workbook’s nested objects and the info on the access permissions for them.Edit: Allows editing the workbook and all its nested objects.Administration: Allows managing the workbook, access to it, and all its nested objects.
-
Click Save. The user or user group will get permissions for this object.
Note
The user will be able to view statistics immediately, and you can set up additional permissions for the user's account in a few hours.
Learn more about roles in DataLens.
-
Open the dashboard.
-
At the top right, click → Access permissions.
-
Permissions must be assigned to the All group or a specific user. If there are no permissions, click Dashboard permissions.
-
In the Add member field, enter the username or the All group.
-
Under Current object, set access permissions for the
Yandex Music podcast analyticsdashboard:Execute: Allows queries to the object.View: Viewing only.Edit: Viewing and editing.Administration: Viewing, editing, and management.
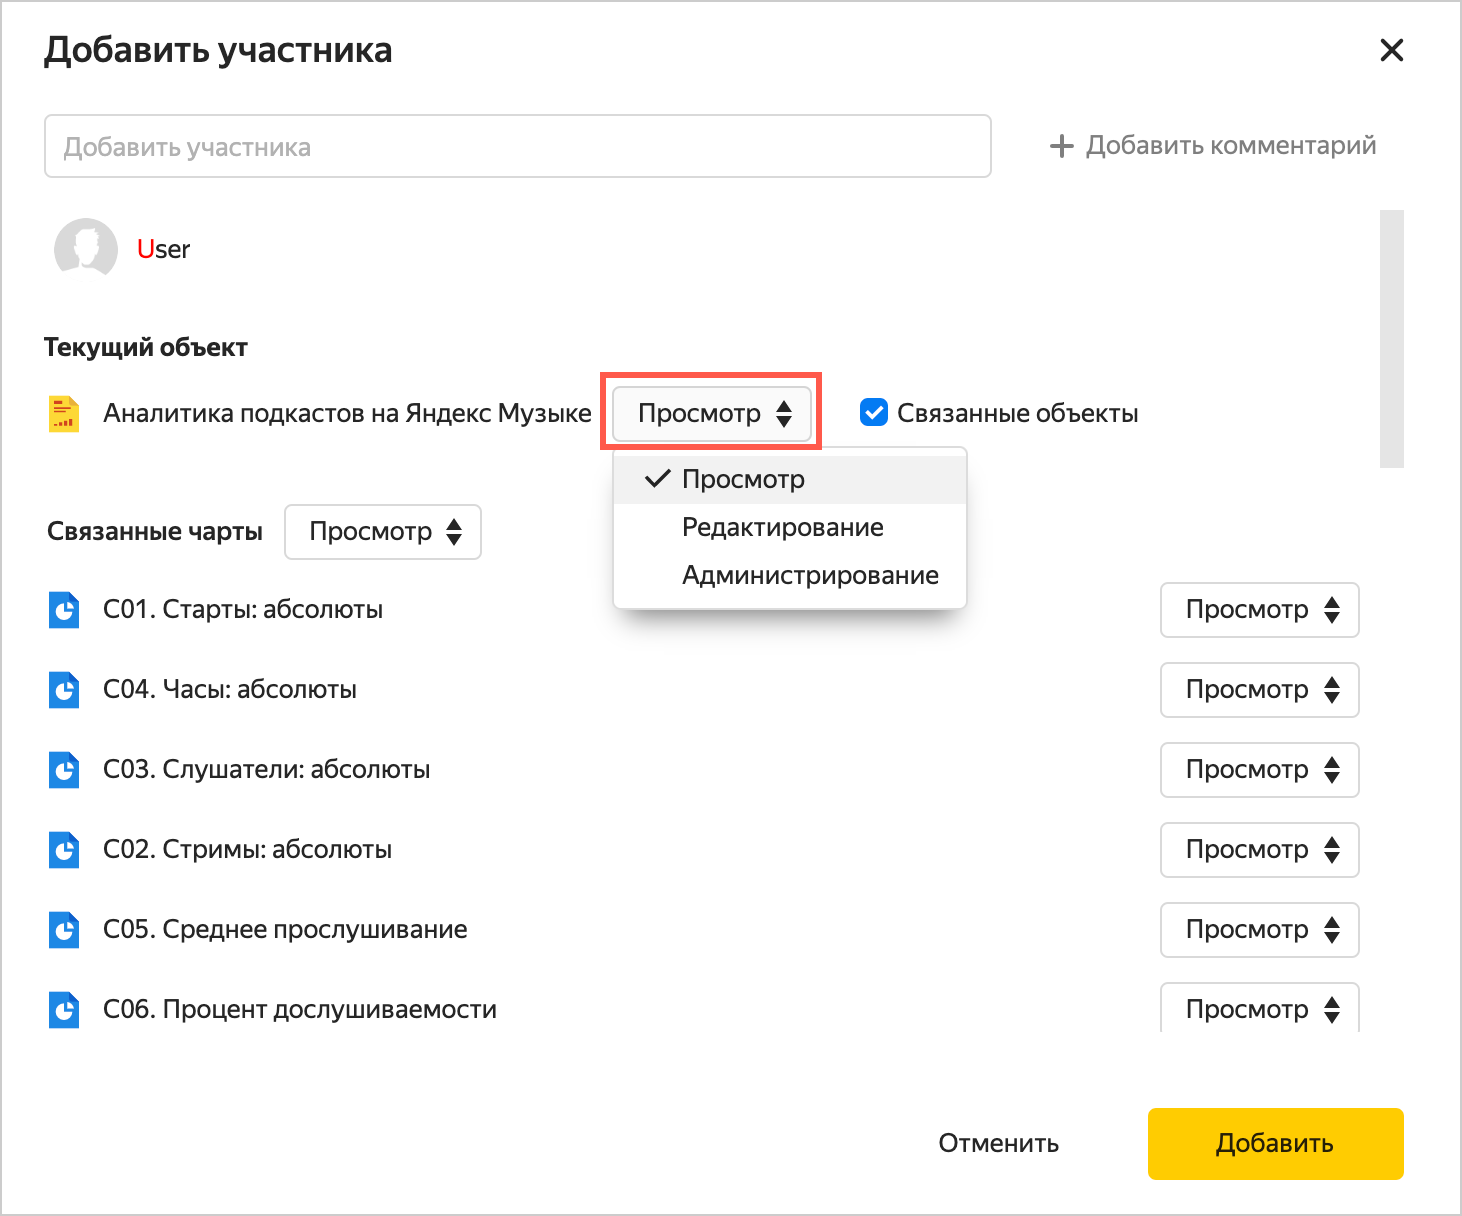
-
Enable the Linked objects option to grant permissions for other objects linked to the dashboard, i.e., the connection, datasets, and charts.
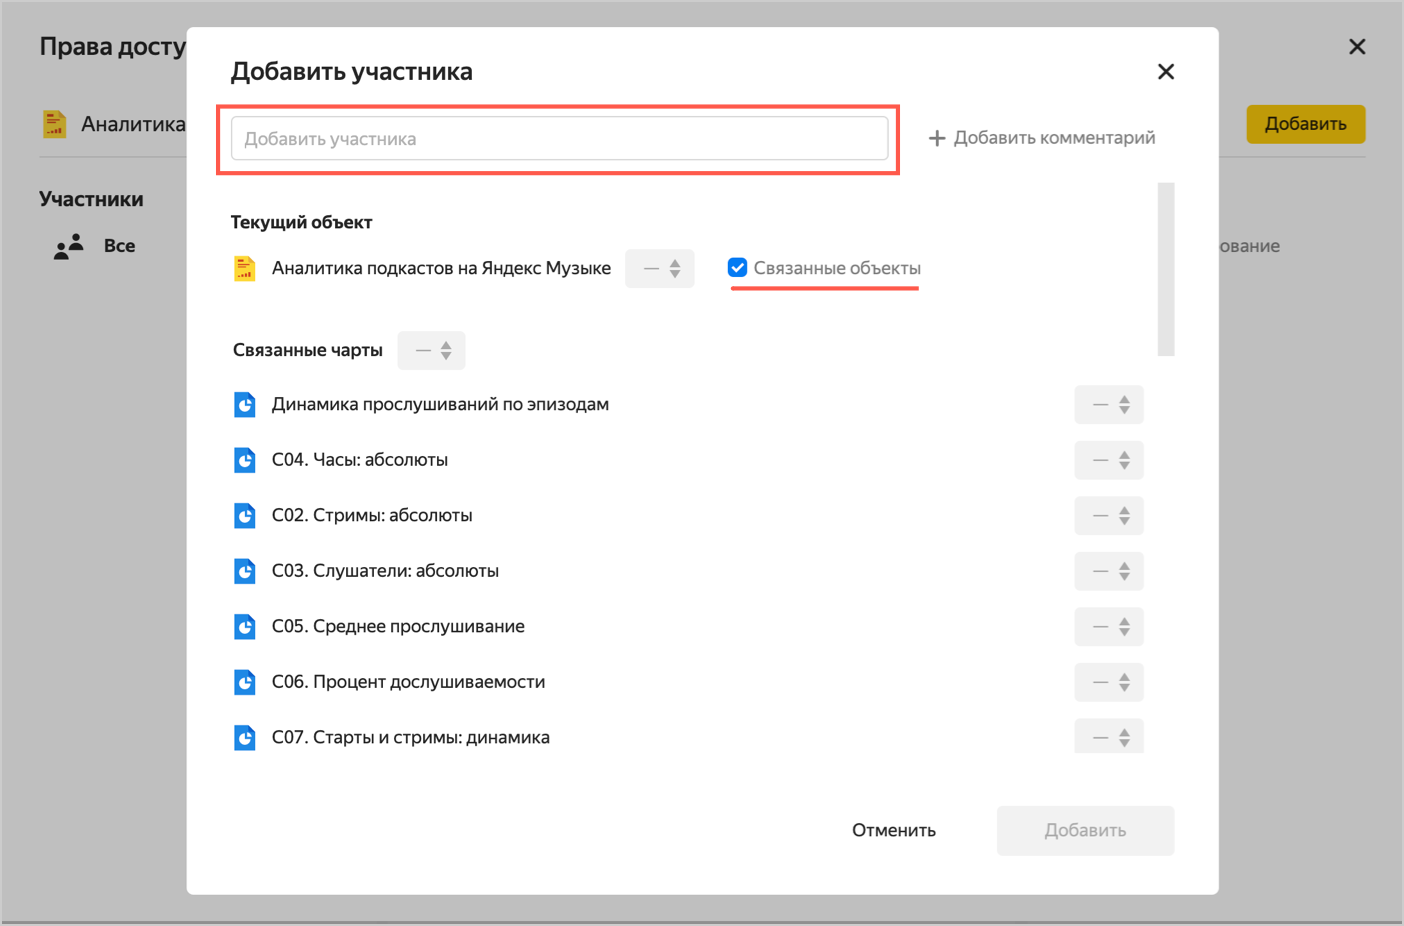
Note
The user will be able to view statistics immediately, and you can set up additional permissions for the user's account in a few hours.
You can set up permissions for each object separately.
-
3.2. Share analytics on a particular podcast or episode
You can grant a user, such as a partner or advertiser, access to statistics for an individual podcast or episode rather than to the entire podcaster statistics dashboard. For that, the user will also need a Yandex account.
If you want the user to be able to request data on an episode via charts without viewing or editing the connection or dataset settings, restrict shared access.
Then, grant the user access to these objects: Podcasts Analytics. Connection, D01. Podcast listens, and D02. Podcast subscribers. Specify which podcast or episode you want to grant access to.
3.2.1. Restrict shared access
To restrict shared access:
- Open the workbook with the
Yandex Music podcast analyticsdashboard. - At the top of the workbook, click Access.
- Click Add user.
- In the window that opens, select the
All users in the <organization_name> organizationand specify theRestricted viewaccess permission for the workbook. Shared access will be restricted: other users will be able to view statistics on the dashboard, e.g., only for individual episodes, but will not be able to change these settings.
- Open the
Yandex Music podcast analyticsdashboard. - Go to the chart's top panel and click the navigation icon.
- In the window that opens, select
Podcasts Analytics. Connection. Click → Access permissions. - Click the All group and set the
Executepermissions. Shared access will be restricted: other users will be able to view statistics on the dashboard, e.g., only for individual episodes, but will not be able to change these settings.
Repeat the action for D01. Podcast listens and D02. Podcast subscribers.
If you do not want to share podcast subscriber analytics with users, you can revoke permissions for the D02. Podcast subscribers dataset from the All group.
3.2.2. Restrict access to data (podcasts/episodes)
When setting up permissions for individual podcasts and episodes, specify the following:
- Users who will get the permissions for a podcast or episode.
- Users who will have full access.
In this step, retain permissions to all podcasts for yourself and your colleagues.
Choose which data you want to restrict access to:
-
Open the
D01. Podcast listensdataset. -
In the
Podcastfield menu, click Permissions.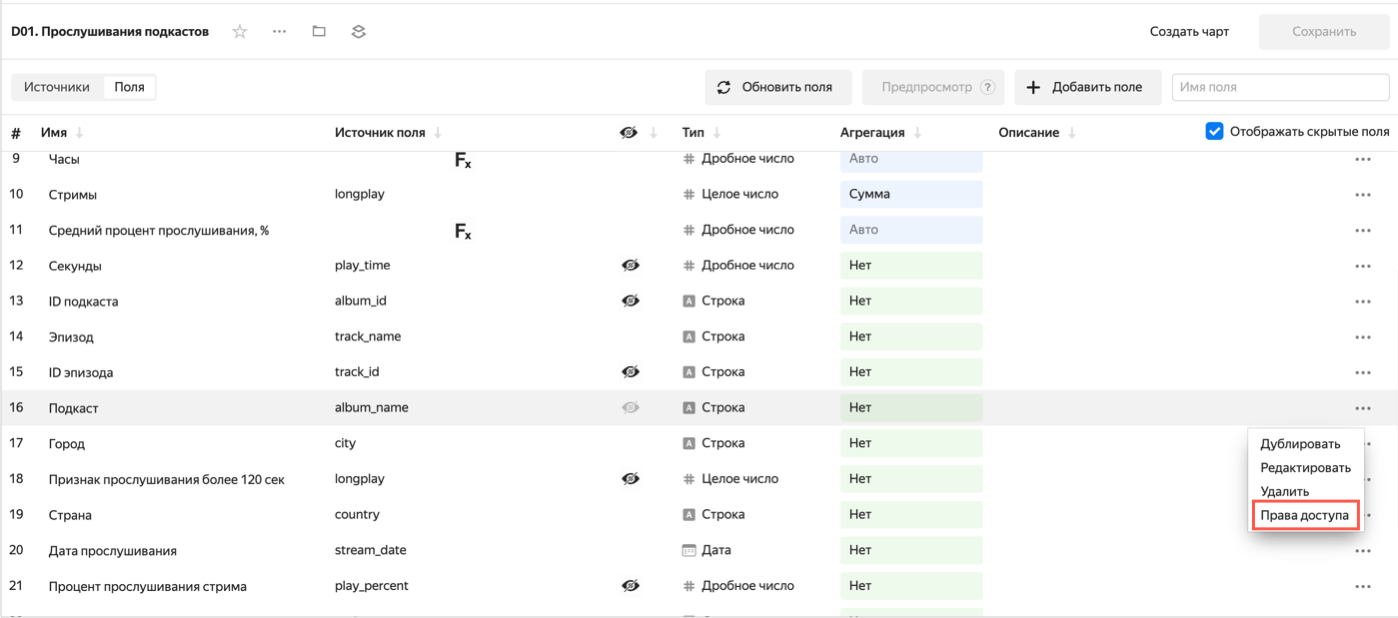
-
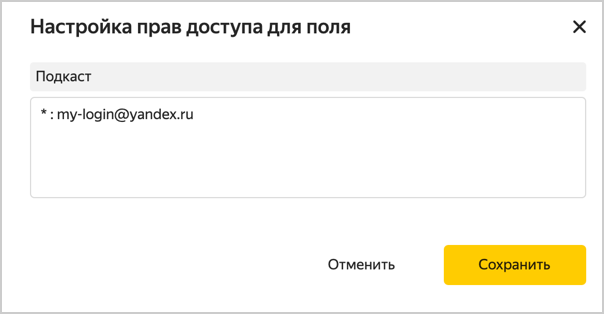
In the Configuring access permissions for a field window, set a filter as shown in this example:
* : my-login@yandex.com
Where:*: Access to all podcasts.my-login@yandex.com: Your username.
-
Click Save. After you save the dataset, its data will only be available to
my-login@yandex.com. -
You can specify the usernames of other users who need access to all podcasts and episodes in a comma-separated list, e.g.,
* : my-login@yandex.com, friend-login@yandex.com.
-
Open the
D01. Podcast listensdataset. -
In the
Episodefield menu, click Permissions.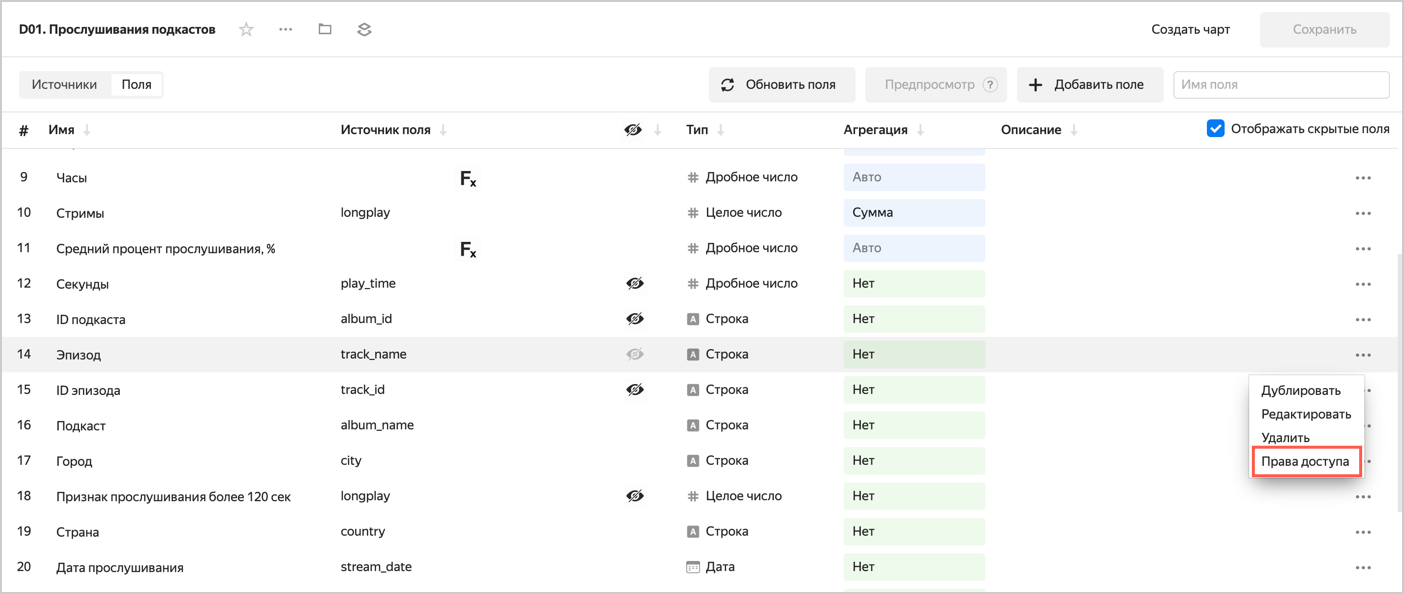
-
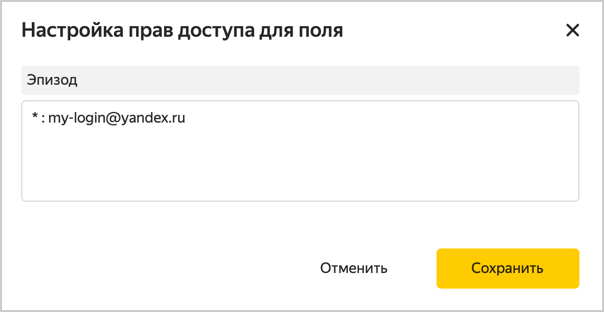
In the Configuring access permissions for a field window, set a filter as shown in this example:
* : my-login@yandex.comWhere:
*: Access to all episodes.my-login@yandex.com: Your username.
-
Click Save. After you save the dataset, its data will only be available to
my-login@yandex.com. -
You can specify the usernames of other users who need access to all podcasts and episodes in a comma-separated list, e.g.,
* : my-login@yandex.com, friend-login@yandex.com.
3.2.3. Grant access to your DataLens instance
To grant access to your DataLens instance to a user:
- Go to Access management.
- In the top-right corner, click Add user.
- Enter the user's Yandex email address. The new user will appear in the list of users.
- Click next to the new user and select Change roles.
- Under Roles in folders, select a folder. In the Roles column, click . Assign the
datalens.instances.userrole.
Note
The user will be able to view statistics immediately, and you can set up additional permissions for the user's account in a few hours.
3.2.4. Grant restricted access to data to an individual user
-
Open the
D01. Podcast listensdataset. -
Choose which data you want to restrict access to for an individual user:
PodcastsEpisodes-
In the
Podcastfield menu, click Permissions. -
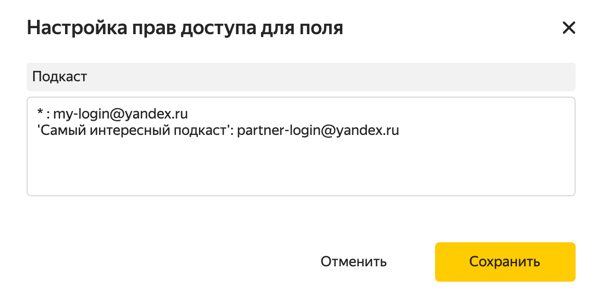
In the Configuring access permissions for a field window, set a filter as shown in this example:
'The most interesting podcast': partner-login@yandex.comWhere:
The most interesting podcast: Podcast name.partner-login@yandex.com: Partner username.
-
Open the
D01. Podcast listensdataset. -
In the
Episodefield menu, click Permissions. -
In the Configuring access permissions for a field window, set a filter as shown in this example:
'Episode No. 5': partner-login@yandex.comWhere:
Episode No. 5: Episode name.partner-login@yandex.com: Partner username.
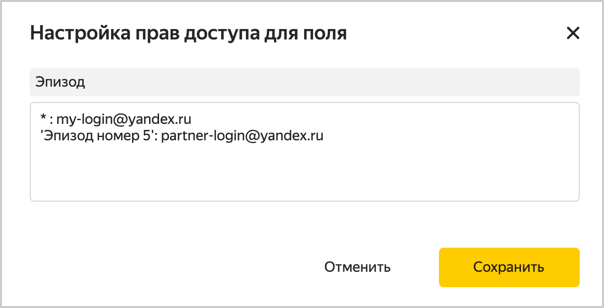
If you want to grant permission for multiple episodes, add additional lines for each episode individually.
Learn more about data-level permissions here.Note
Specify the same names as in the service (filtering is case-sensitive).
A user's permissions will remain valid until they are revoked.
-
-
Share a link to the
Yandex Music podcast analyticsdashboard with the user. To do this, click → Copy link on the dashboard.
3.3. Revoke a user's access permissions
You can revoke a user's permissions:
- Open the workbook with the
Yandex Music podcast analyticsdashboard and click Access at the top right. - Under Direct permissions, click next to the user or user group to revoke the permissions from.
- In the window that opens, click Revoke role.
-
Go to
Podcasts Analytics. Connection. -
Click and select Access permissions.
-
Select the user to revoke the permissions from.
-
In the window that opens, click Revoke permissions.
-
To completely deny the user access to your podcaster statistics dashboard:
- Go to Access management.
- Find the user, click the icon next to the new user, and select Delete.
4. Make a dashboard or chart public
Data in DataLens is only available to users of a specific instance. If you want to provide unrestricted public access to podcast analytics, publish your dashboard or a particular chart.
- Open the
Yandex Music podcast analyticsdashboard. - At the top of the dashboard interface, click .
- In the public access settings window that opens, enable Access via link.
- Confirm publishing and click Next.
- Select the charts you want to publish with the dashboard.
- Copy the public link and click Apply.
- On the navigation page, find a chart, e.g.,
C07. Starts and streams: Dynamics, and open it. - At the top of the chart interface, click .
- In the public access settings window that opens, enable Access via link.
- Confirm publishing and click Next.
- Copy the public link and click Apply.
5. Add a chart or dashboard to your website
You can embed the published charts into a website or app using the iframe element. Follow these steps:
- Follow the public link to the chart.
- Click in the top-right corner of the chart and select Embed code.
- Copy the
iframeembed code in the light or dark theme. - Embed the code into your website.
Note
You can only embed individual charts. Embedding the entire dashboard is not supported.
FAQ
Why can I only connect with a Yandex account?
Using your Yandex account in Yandex Music and DataLens ensures enhanced data security.
I know for a fact that some of my friends have listened to the podcast but the statistics show a lower number. Why?
Data is updated daily at 13:00. If someone listens to a podcast after this time, the data will only appear in the statistics the next day. Plus, playbacks of less than one second are not included in the statistics.
There are more service subscribers than DataLens shows. Why?
New subscribers appear in the service instantly, while in the statistics, only the next day. If a person has subscribed to a podcast today, the number of subscribers in the statistics will increase tomorrow.
Why are some of my podcast episodes not included in the statistics?
The statistics only show episodes with a history of listens. The episode you cannot see now will appear on the charts as soon as somebody listens to it.
Are editorial promos shown in the statistics?
Promo periods and titles are not displayed in the statistics separately; however, a spike in listens may indicate that the podcast was promoted.
Can I edit a standard dashboard?
Yes, you can edit a dashboard and linked objects.
I deleted a dashboard accidentally. How do I restore it?
Recreate a connection and the dashboard will appear again.
Why are chart settings so complicated?
DataLens is a full-fledged data analysis and visualization tool. Use its wide range of settings to create different types of visualizations that meet a variety of user requirements.
What else can I use DataLens for?
There are many ways you can use DataLens. You can connect to your own data sources, build charts and dashboards, and share them with your colleagues.