Adding a chart to a dashboard in Yandex DataLens
Follow these steps to add a chart to a dashboard:
Warning
If you use the new DataLens object model with workbooks and collections:
- In the left-hand panel, select Collections and workbooks.
- Open the workbook you need and select an object.
Proceed with this guide from Step 2.
-
In the left-hand panel, click Dashboards and select the dashboard you need. If you do not have a dashboard, create one.
-
At the top of the page, click Edit.
-
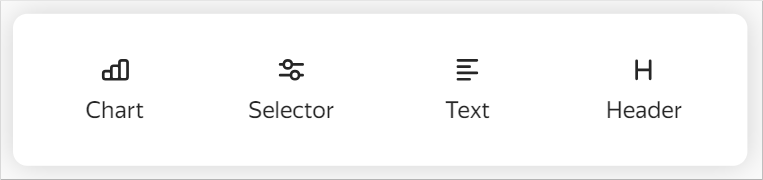
In the panel at the bottom of the page, click Chart and drag it where you want it to be.
-
Specify the widget settings. Pay close attention to the following fields:
-
Header. It sets the widget name. If the Show option is enabled (by default), the name is displayed at the top of the widget.
-
Chart. It sets the widget you are adding. Select the chart:
From the list of objectsUsing a linkClick Select. Select the chart from the list of objects. If the chart is already selected, you can proceed to edit it by clicking Open next to the chart.
Click Specify link. Enter the chart URL in the input field. Click OK on the right.
-
Description. This option allows adding a description for the widget. The description is displayed at the bottom of the widget. You can use either a visual editor or Markdown.
-
Tooltip. This option allows adding a tooltip to the widget. With this option on, the icon will appear next to the chart header. Hovering over the icon will bring up the tooltip. You can use either a visual editor or Markdown.
-
Auto height. It sets the automatic height for a widget of the Table type. If it is disabled, you can set the widget height on the page using the mouse.
-
Filtering. It enables cross-chart filtering on the dashboard.
-
Background. It sets the widget background color and opacity for the light and dark theme individually.
-
Rounding. It sets the widget corner rounding.
-
-
Optionally, under Parameters, list chart parameters and set their default values. If you do not set the default values, an error will be displayed on the dashboard.
-
Click Add. The widget will appear on the dashboard.