Example of using the Activities tab in Editor
Editor is a JavaScript-based data and selector visualization tool. With Editor, you can upload data from one or multiple sources, manage chart parameters, and configure visualizations. You can use datasets and connections as data sources.
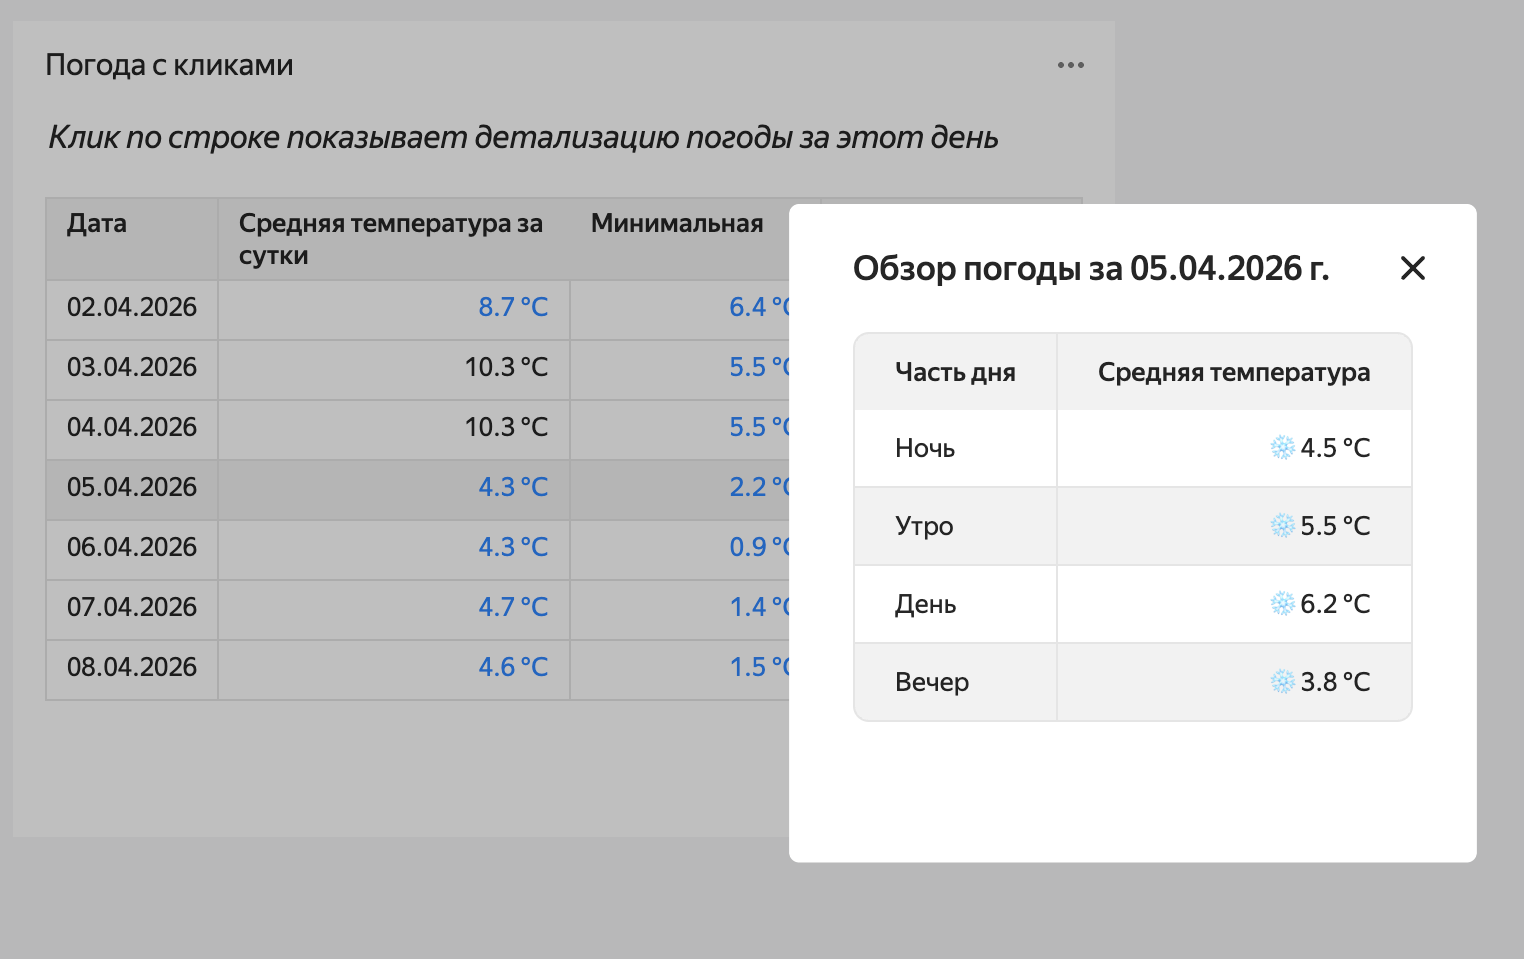
This tutorial demonstrates how the Activities tab works: you will build a table that expands to display detailed information upon clicking a row.
As your data source, you will use a connection via API Connector to retrieve weather information from a demo database.
Note
In this tutorial, all objects will be created and stored in a workbook. If using legacy folder navigation, create an individual folder to work in.
Create a folder
- Go to the DataLens home page.
- In the left-hand panel, select All objects or Personal folder.
- In the top-right corner, click Create → Folder.
- Enter a name for the folder.
- Click Create.
To visualize and explore data, set up DataLens and follow the steps below:
Getting started
To get started with DataLens:
- Log in to your Yandex account. If you do not have an account, create one.
- Open the DataLens home page.
- Click Start in cloud.
- Confirm that you have read the Terms of use and click Log in.
-
Log in to your Yandex account.
-
Open the DataLens home page.
-
Click Start in cloud.
-
Select one of these options:
-
If you already have an organization, select it from the drop-down menu in the Organizations tab and click DataLens.
Note
To activate a DataLens instance, the user must have the
adminorownerrole. For more information about roles, see Access management in Yandex Identity Hub. -
If you have a cloud but no organization, click Add new DataLens. In the window that opens, enter a name and description for your organization and click Create organization and DataLens. For more information about working with organizations, see Getting started with organizations.
-
If you encounter a technical issue with the service, contact Yandex Cloud support. To ask for advice, discuss a solution to your issue, or explore current best practices, join the DataLens chat in Telegram.
Create a workbook
- Go to the DataLens home page.
- In the left-hand panel, select Collections and workbooks.
- In the top-right corner, click Create → Create workbook.
- Enter a name for the workbook:
Activities in Editor. - Click Create.
Create a connection
-
Navigate to the workbook created in the previous step and click Create → Connection.
-
Under Files and services, select API Connector.
-
Configure the connection as follows:
- Host name:
api.open-meteo.com. - Port:
443. - URL path:
v1/forecast/. - Allowed methods: Only specify
GET.
Leave the other parameters unchanged.
- Host name:
-
Click Create connection. Enter a connection name and click Create.
-
Go to the
Activities in Editorworkbook and find the new connection on the Connections tab. -
Copy the connection ID by clicking → Copy ID next to it. The ID will be copied to the clipboard.
Create a chart in Editor
-
In the
Activities in Editorworkbook, click Create → Chart in Editor in the top-right corner. On the page that opens, select the Table visualization type. -
Link the chart with the connection by navigating to the Meta tab and adding the connection ID to
links:{ "links": { "weatherConnection": "<connection_ID>" } }Where:
<connection_ID>: Connection ID copied in the previous step.weatherConnection: Any alias name you assign to the connection and use to request chart data from the source.
-
Get data from the data source. To do this, go to the Source tab and specify:
module.exports = { "weather": { // Indicating which connection to use for getting data // Use the name given to the connection on the Meta tab apiConnectionId: Editor.getId("weatherConnection"), // Request method method: "GET", // Specifying the path to the API method/page in the source path: "?latitude=55.75&longitude=37.61&daily=temperature_2m_max,temperature_2m_min" } }; -
Configure the
runActivityaction on the Config tab: clear the Config tab contents and paste the suggested code:module.exports = { size: 'l', events: { click: [{handler: {type: 'runActivity'}, scope: 'row'}], }, title: { text: 'Clicking a row shows the weather details for that day', style: { 'text-align': 'center', 'font-size': '16px', 'font-weight': 'normal', 'margin-bottom': '16px', 'font-style': 'italic', } }, }; -
On the Prepare tab, create a table:
// Getting the downloaded data const data = Editor.getLoadedData(); const {daily, daily_units} = data.weather.data.body; const {time, temperature_2m_max, temperature_2m_min} = daily; const headCommonStyles = { 'background-color': 'var(--g-color-base-neutral-light)', }; // Creating the table header and describing the column types const head = [ { id: 'id-date', name: 'Date', type: 'date', format: 'DD.MM.YYYY', css: headCommonStyles, }, { id: 'id-mean', name: 'Average daily temperature', type: 'text', css: {...headCommonStyles, width: 200}, }, { id: 'id-t-min', name: 'Minimum', type: 'text', css: headCommonStyles, }, { id: 'id-t-max', name: 'Maximum', type: 'text', css: headCommonStyles, }, ]; // Populating the table const rows = []; for (var i = 0; i < time.length; i++) { const rowTime = time[i]; const rowMin = temperature_2m_min[i]; const rowMax = temperature_2m_max[i]; const colorCold = {color: 'var(--g-color-text-info-heavy)'}; const colorWarm = {color: 'var(--g-color-text-danger-heavy)'}; const average = ((rowMin + rowMax) / 2).toFixed(1); const isAvCold = average < 10; const isAvWarm = average > 15; const isMinCold = rowMin < 10; const isMinWarm = rowMin > 15; const isMaxCold = rowMax < 10; const isMaxWarm = rowMax > 15; rows.push({ cells: [ { value: rowTime }, { value: `${average} ${daily_units.temperature_2m_min}`, css: { textAlign: 'right', ...(isAvCold ? colorCold : {}), ...(isAvWarm ? colorWarm : {}), }, }, { value: `${rowMin} ${daily_units.temperature_2m_min}`, css: { textAlign: 'right', ...(isMinCold ? colorCold : {}), ...(isMinWarm ? colorWarm : {}), }, }, { value: `${rowMax} ${daily_units.temperature_2m_max}`, css: { textAlign: 'right', ...(isMaxCold ? colorCold : {}), ...(isMaxWarm ? colorWarm : {}), }, }, ] }); } module.exports = {head, rows}; -
On the Activities tab, configure the interactive behavior for the table:
module.exports = { sources: ({params}) => { const date = params.cells[0].value; return { weather: { apiConnectionId: Editor.getId('weatherConnection'), path: `?latitude=55.75&longitude=37.61&hourly=temperature_2m&start_date=${date}&end_date=${date}`, method: "GET", }, }; }, handleResponse: ({data: responseData}) => { const data = responseData.weather.data.body.hourly; const [date] = data.time[0].split('T'); const [year, month, day] = date.split('-'); const groups = { "Night": [], "Morning": [], "Afternoon": [], "Evening": [] }; data.time.forEach((date, i) => { const temp = data.temperature_2m[i]; const hour = parseInt(date.split('T')[1]); if (hour >= 0 && hour <= 5) { groups["Night"].push(temp); } else if (hour >= 6 && hour <= 11) { groups["Morning"].push(temp); } else if (hour >= 12 && hour <= 17) { groups["Afternoon"].push(temp); } else { groups["Evening"].push(temp); } }); let content = ` | Part of day | Average temperature | | --- | ---: |`; for (const [part, temps] of Object.entries(groups)) { if (temps.length > 0) { const avg = temps.reduce((a, b) => a + b, 0) / temps.length; const emodji = avg > 15 ? '☀️' : (avg < 10 ? '❄️' : ''); content += `\n| ${part} | ${emodji} ${avg.toFixed(1)} °C |`; } } return { action: 'popup', title: `Weather overview for ${day}.${month}.${year}`, content, }; } }; -
At the top of the chart, click Execute. The preview area will display a simple table displaying the data received from the JSON API.
-
To save a chart, click Save in the top-right corner and enter a name for the chart.
Clicking a table row displays a pop-up window with more details.