Source parameterization in DataLens
Note
In this tutorial, all objects will be created and stored in a workbook. If using legacy folder navigation, create an individual folder to work in.
Create a folder
- Go to the DataLens home page.
- In the left-hand panel, select All objects or Personal folder.
- In the top-right corner, click Create → Folder.
- Enter a name for the folder.
- Click Create.
In this tutorial, you will create a connection to a data source and learn how to use dataset source parameterization in DataLens.
Parameterization will enable you to:
- Substitute a table in queries.
- Provide a parameter to the dataset's SQL as part of a query.
As our data source, we will use a ClickHouse® demo database with a Moscow retail chain's sales data.
To visualize and explore data, set up DataLens and follow the steps below:
- Create a workbook.
- Create a connection.
- Create a dataset with a table substitution parameter.
- Create a chart with a table selection parameter.
- Create a dataset with a subquery parameter.
- Create a chart with a parameter for selecting a subquery condition.
Getting started
To get started with DataLens:
- Log in to your Yandex account. If you do not have an account, create one.
- Open the DataLens home page.
- Click Start in cloud.
- Confirm that you have read the Terms of use and click Log in.
-
Log in to your Yandex account.
-
Open the DataLens home page.
-
Click Start in cloud.
-
Select one of these options:
-
If you already have an organization, select it from the drop-down menu in the Organizations tab and click DataLens.
Note
To activate a DataLens instance, the user must have the
adminorownerrole. For more information about roles, see Access management in Yandex Identity Hub. -
If you have a cloud but no organization, click Add new DataLens. In the window that opens, enter a name and description for your organization and click Create organization and DataLens. For more information about working with organizations, see Getting started with organizations.
-
If you encounter a technical issue with the service, contact Yandex Cloud support. To ask for advice, discuss a solution to your issue, or explore current best practices, join the DataLens chat in Telegram.
Create a workbook
- Go to the DataLens home page.
- In the left-hand panel, select Collections and workbooks.
- In the top-right corner, click Create → Create workbook.
- Enter
Dataset parametrisationfor the workbook name. - Click Create.
Create a connection
A connection named Sample ClickHouse will be created for database access.
-
In the top-right corner of the workbook, click Create → Connection.
-
Under Databases, select the ClickHouse® connection.
-
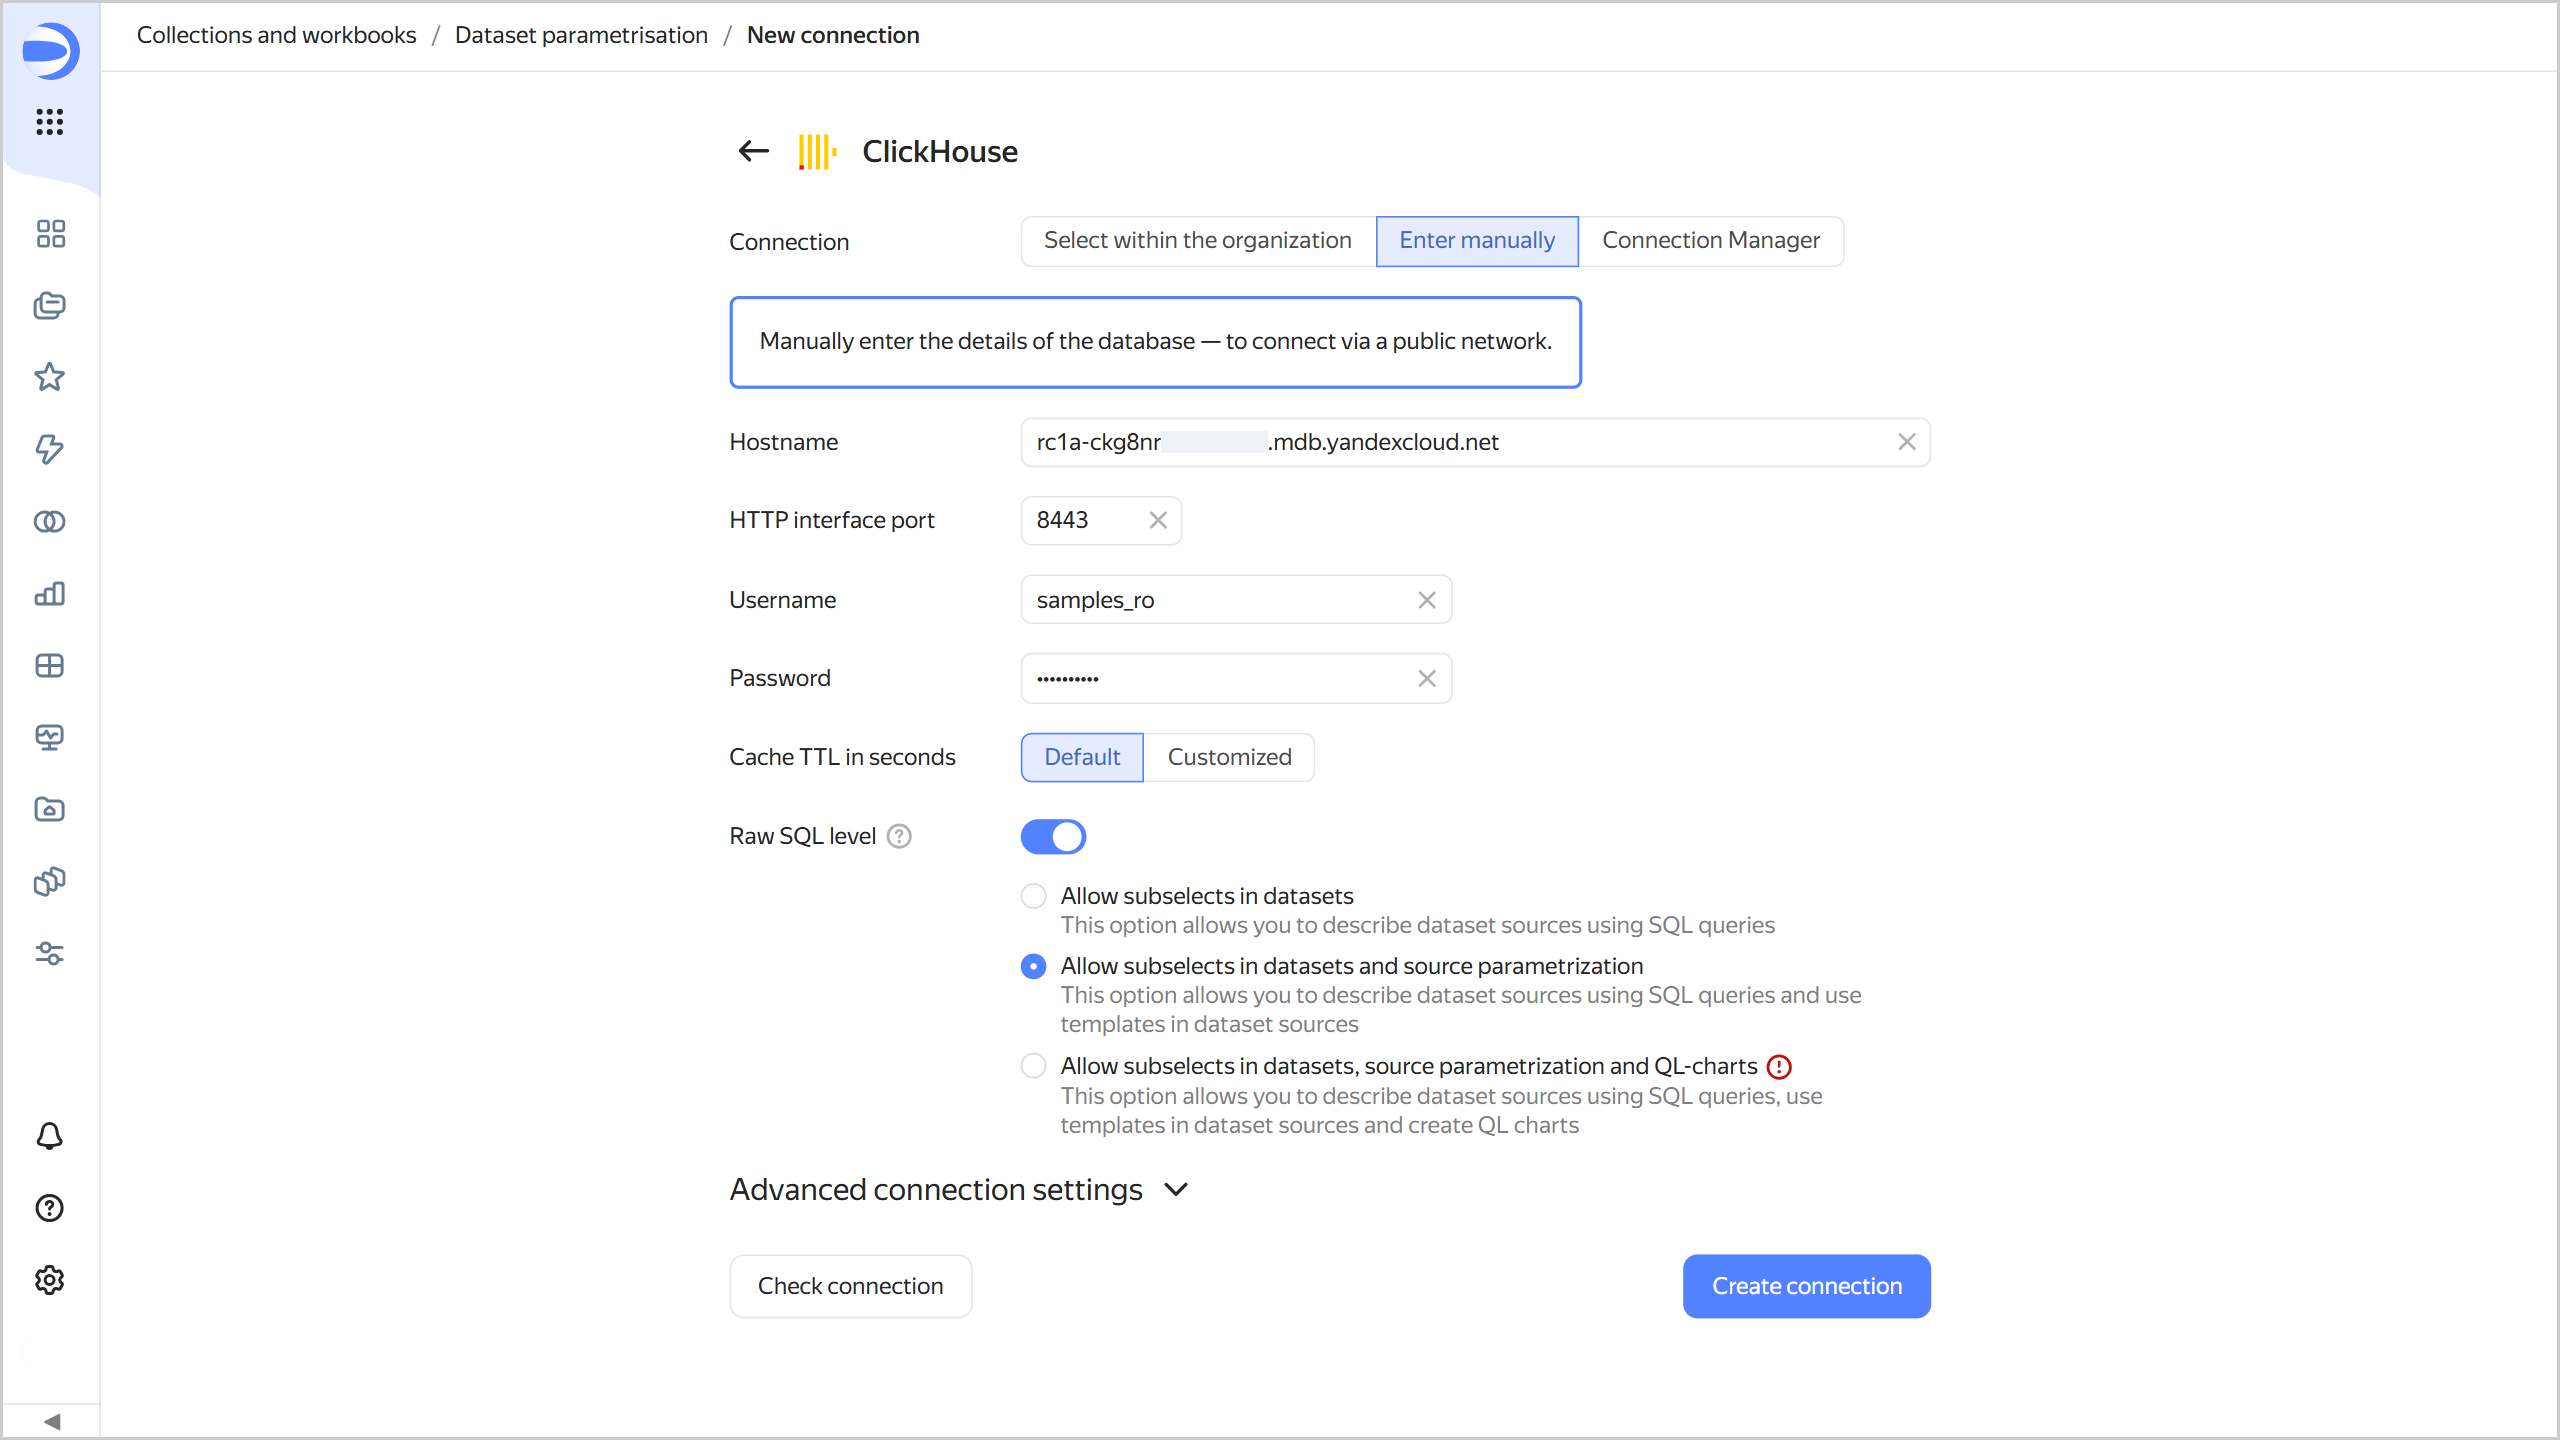
In the window that opens, select
Specify manuallyfor the connection type and provide the following connection parameters:- Host name:
rc1a-ckg8nrosr2lim5iz.mdb.yandexcloud.net - HTTP interface port:
8443(default). - Username:
samples_ro. - Password:
MsgfcjEhJk.
- Host name:
-
Enable SQL query access level and select Allow subqueries in datasets and source parameterization.
-
Click Check connection and make sure you get a green check mark.
-
Click Create connection.
-
Enter the connection name:
Sample ClickHouse. -
Click Create.
-
Wait for the connection to be saved.
Create a dataset with a table substitution parameter
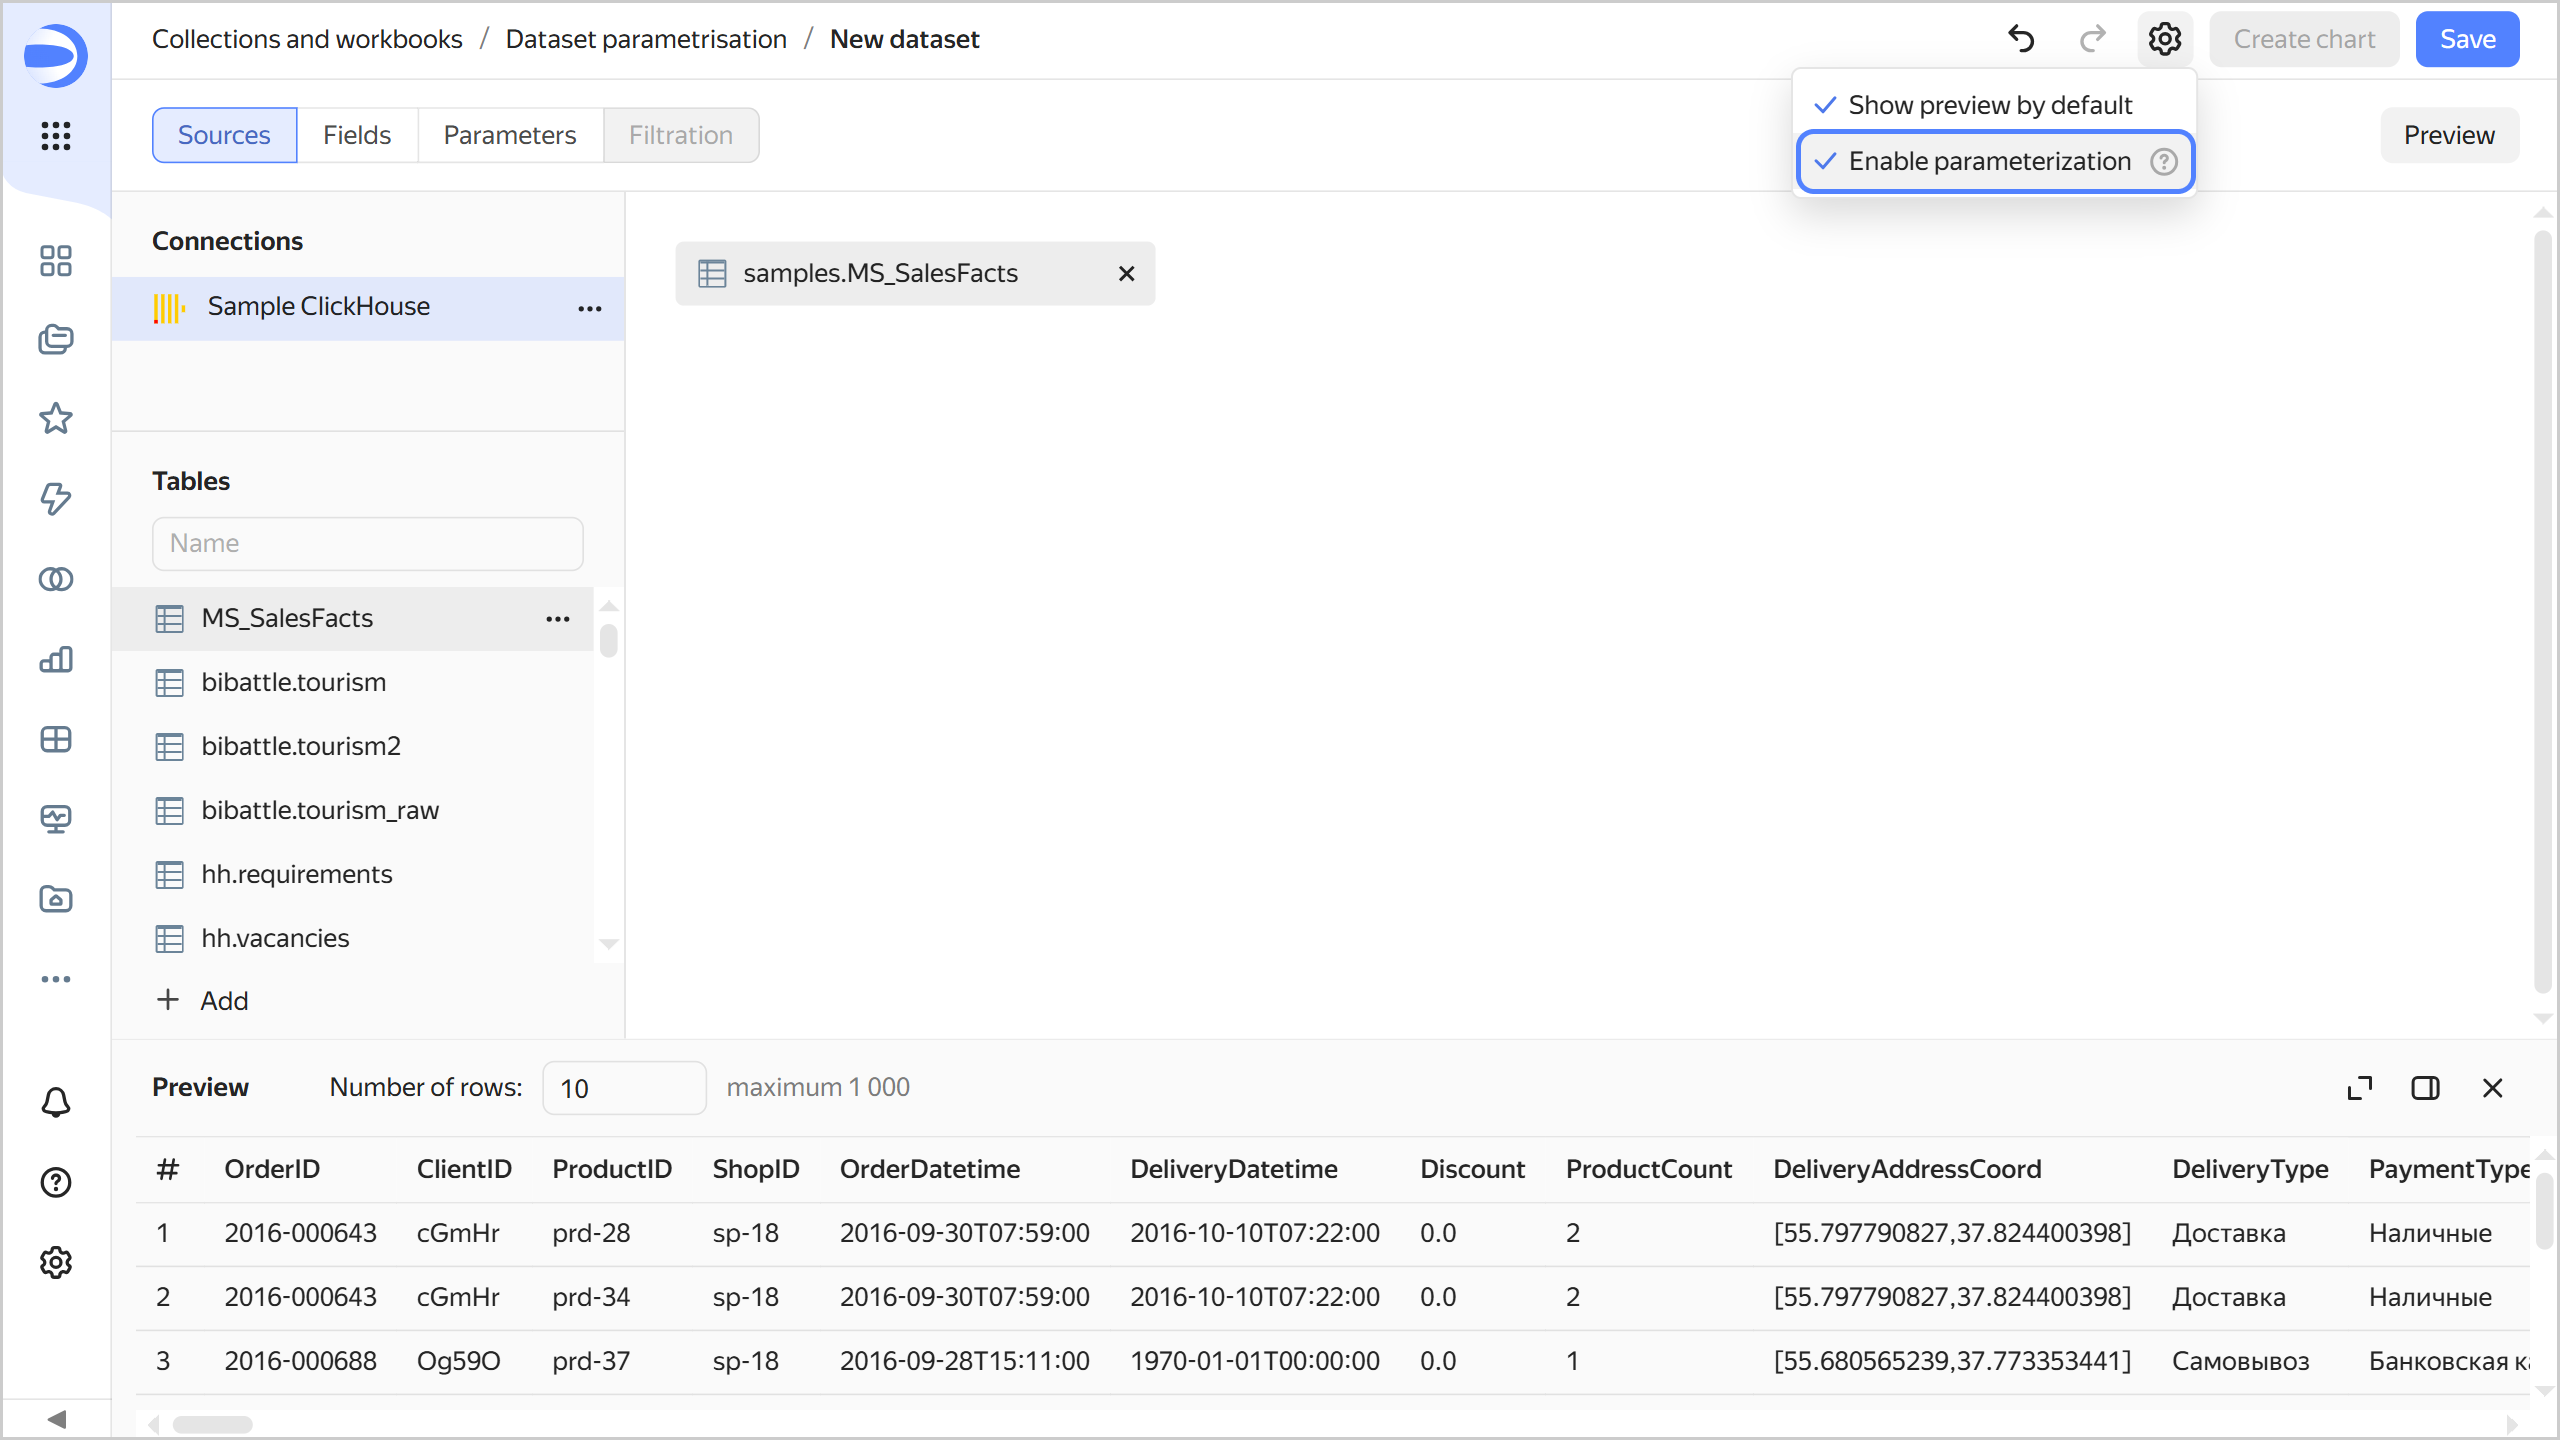
Create a dataset based on the Sample ClickHouse connection:
-
In the top-right corner of the connection page, click Create dataset.
-
Drag the
samples.MS_SalesFactstable to the workspace. -
Enable parameterization in the dataset settings. To do this, click at the top and select Enable parameterization.
-
Save the dataset:
- In the top-right corner, click Save.
- Enter
Dataset with parametrisationfor the dataset name and click Create.
-
Add a parameter with the table name:
-
Go to the Parameters tab.
-
Click Add and configure as follows:
- Name:
table_name. - Type:
String. - Default value:
MS_SalesFacts. - Enable Allow use in source settings and keep the default validation.
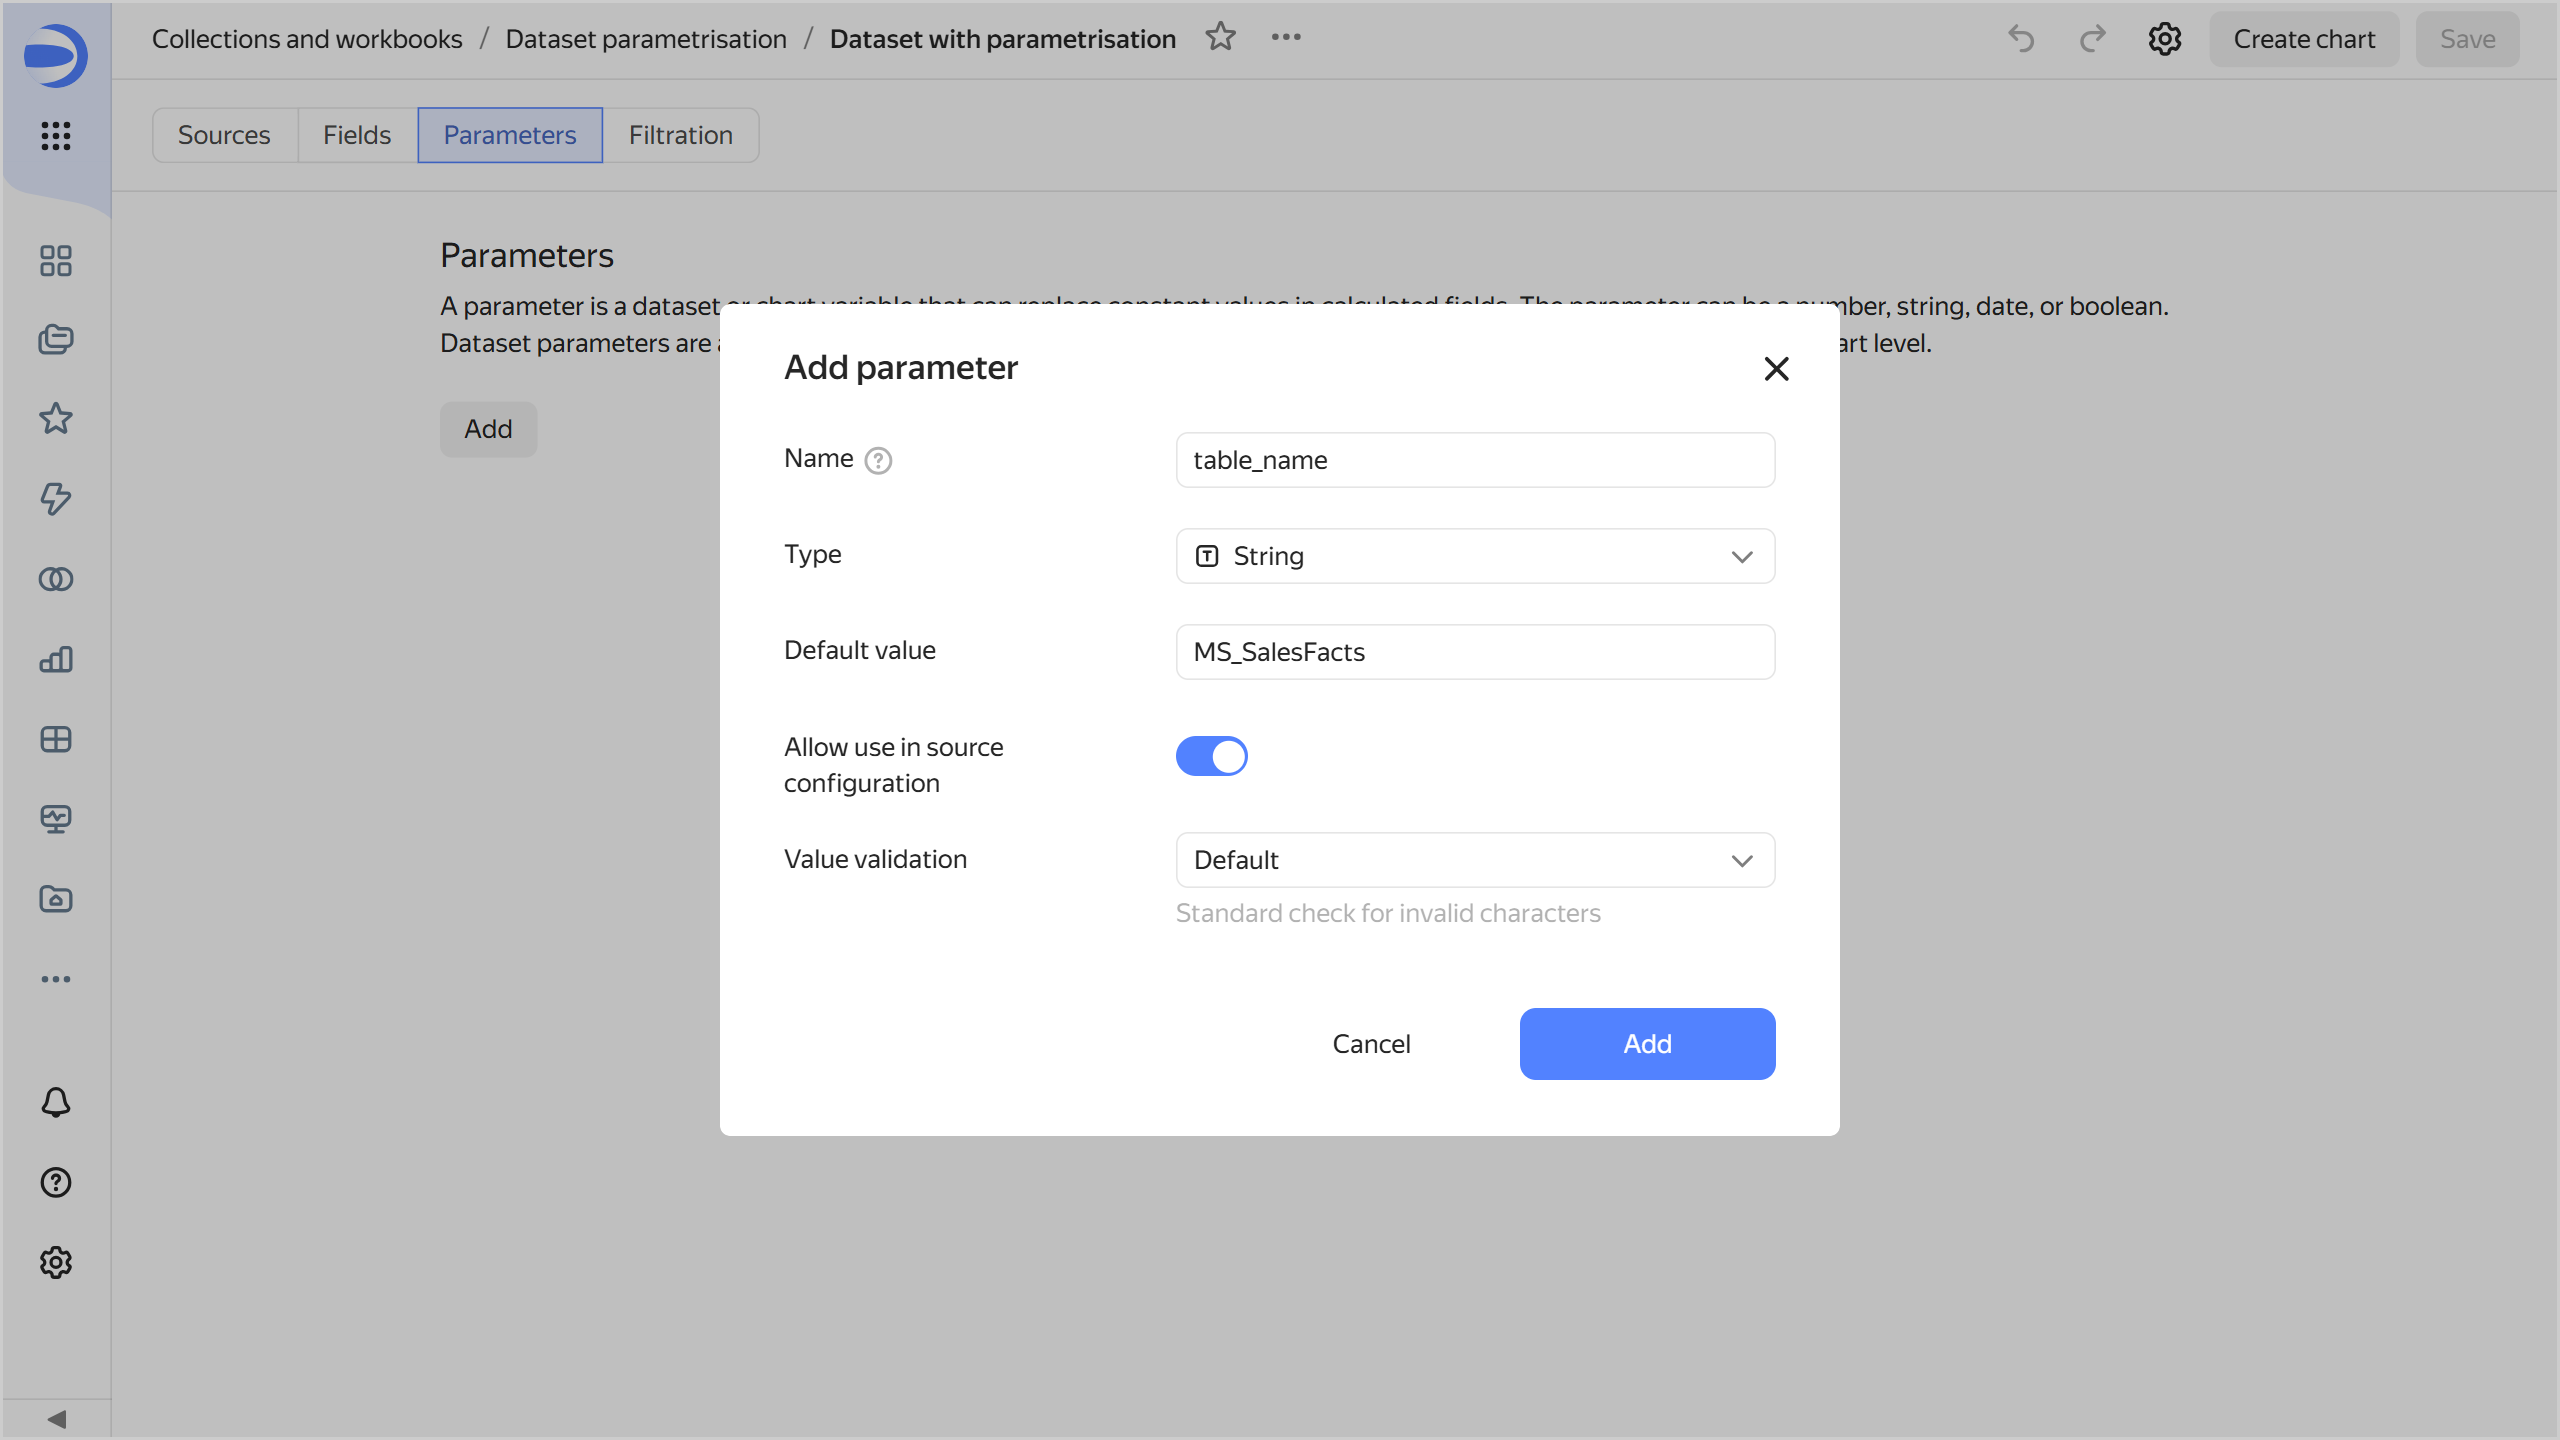
When you click Add, the system will show an error saying that the dataset validation failed. By default, the value of a parameter allowed for use in the source cannot contain
_.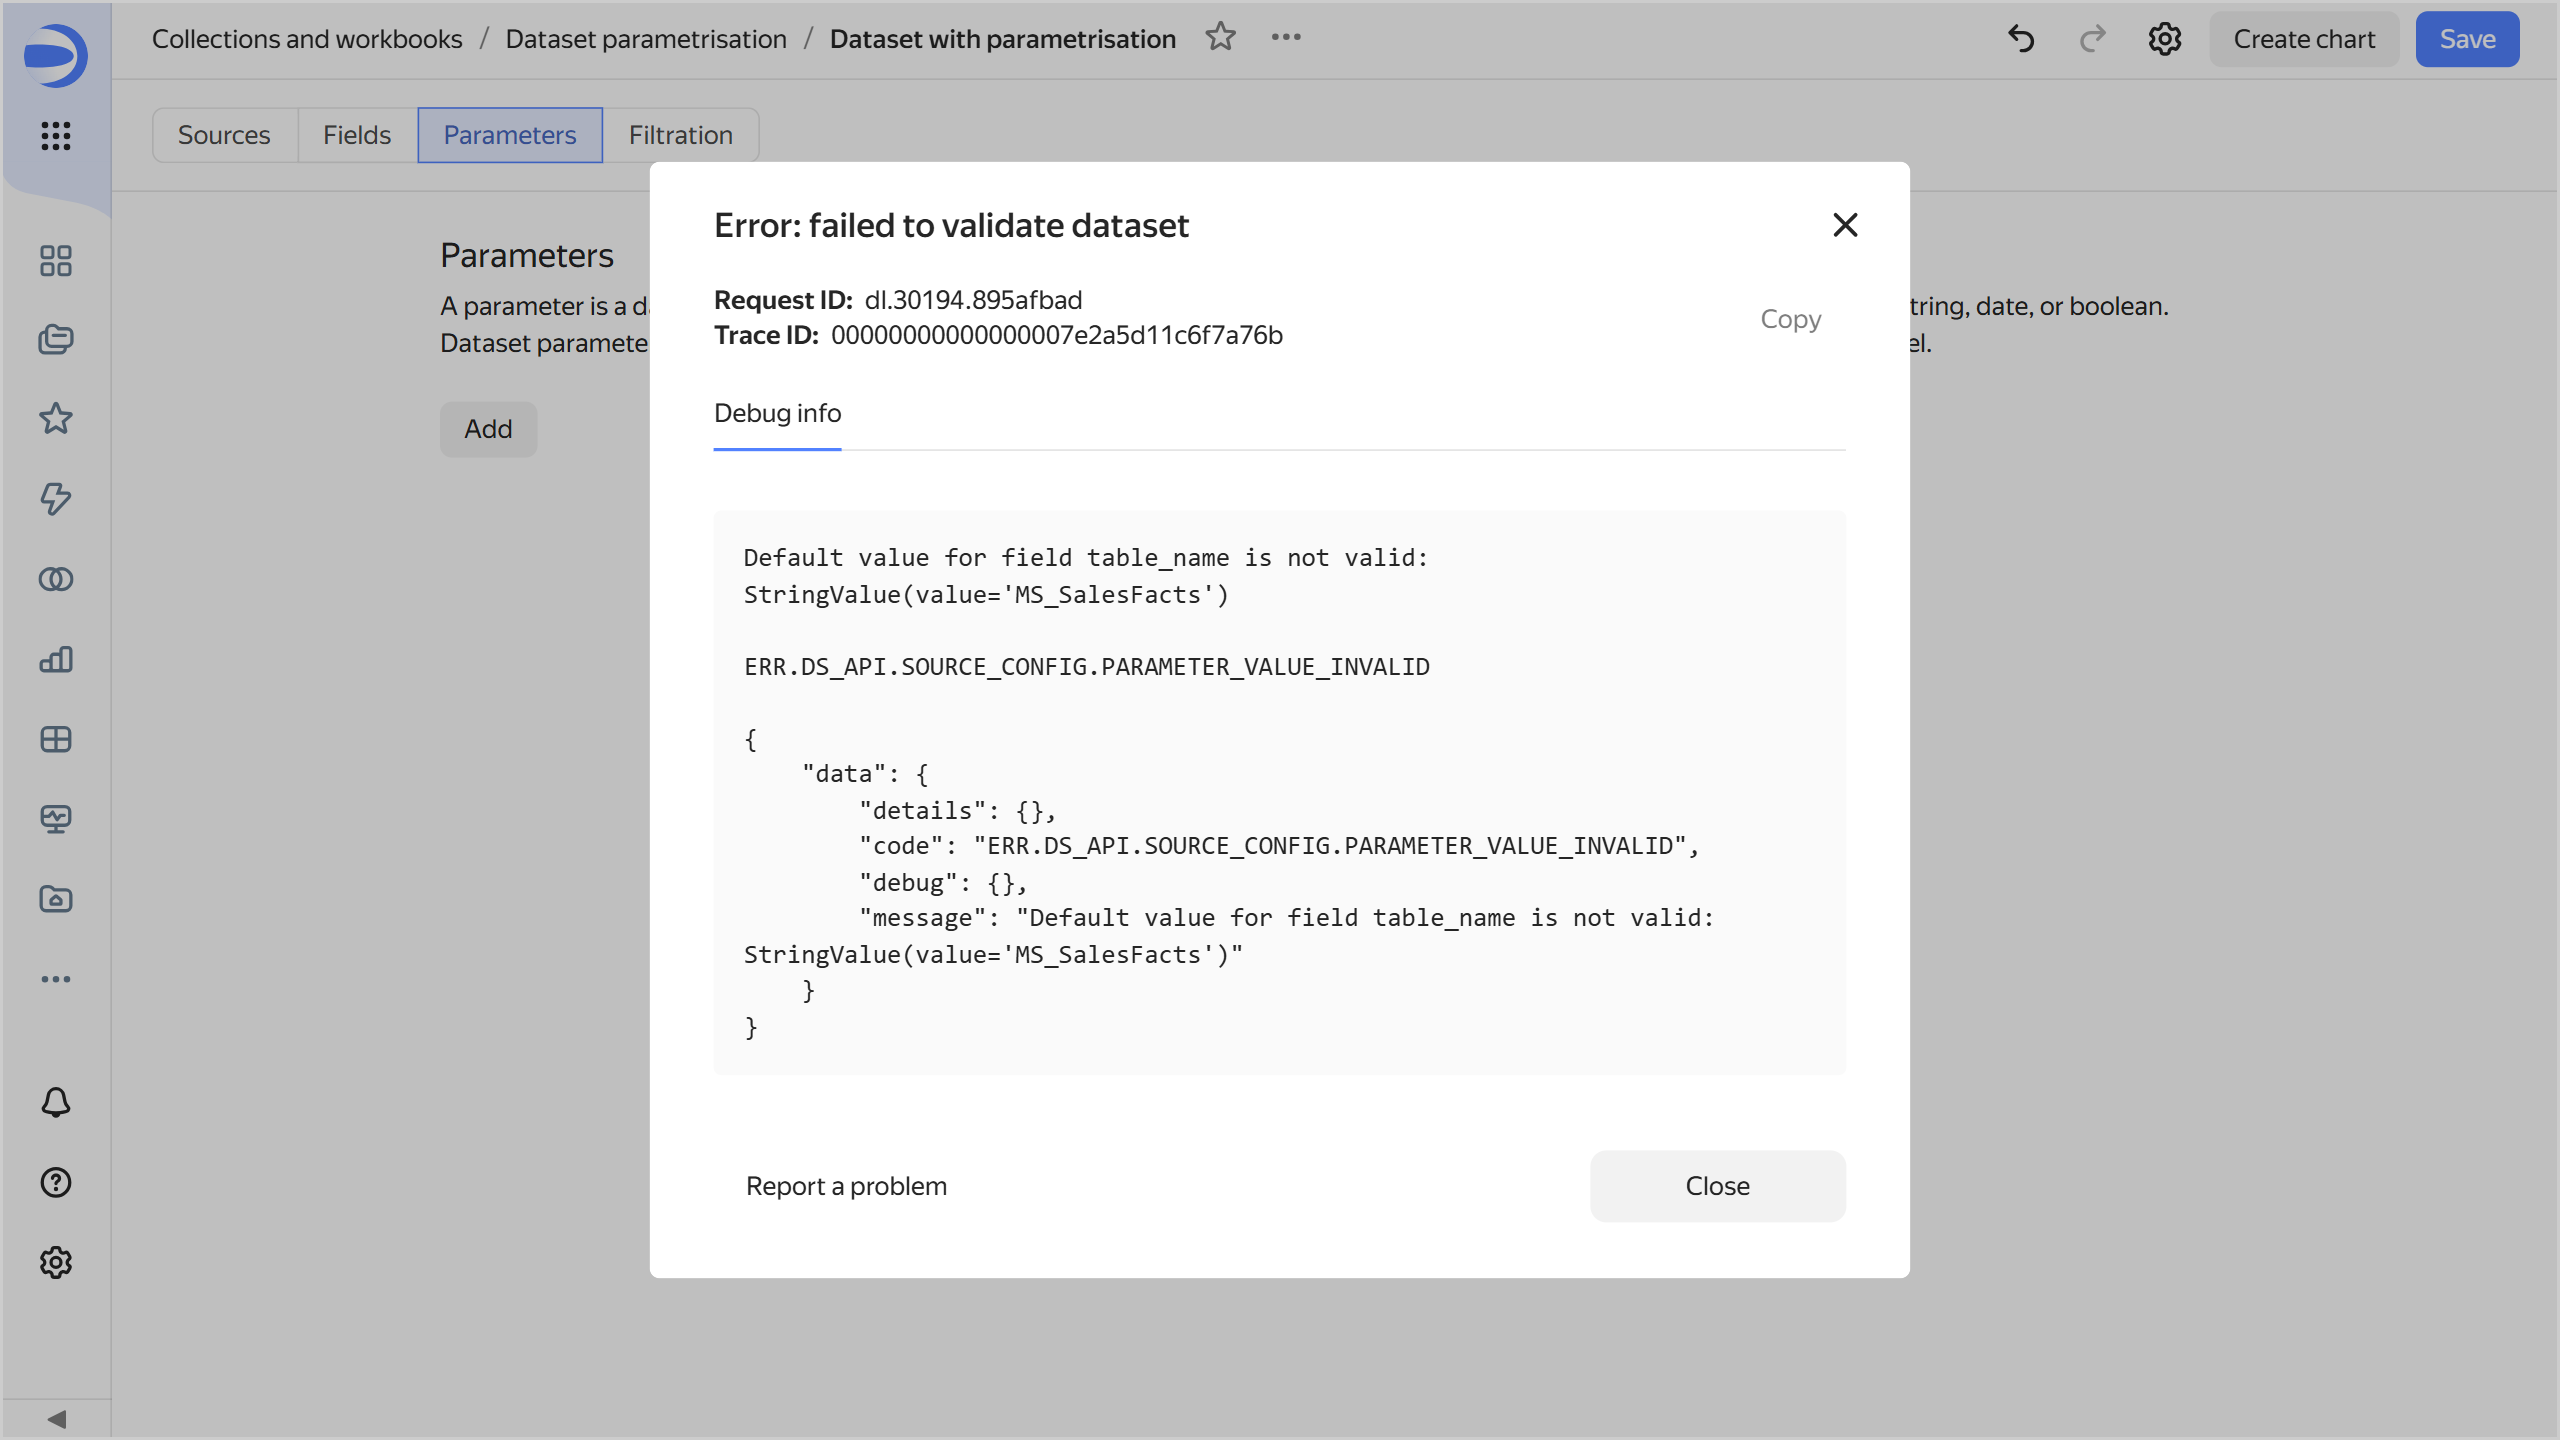
- Name:
-
-
Adjust the dataset validation settings to allow the
MS_SalesFactsvalue in the parameter. Follow these steps:-
Click Add and specify Name, Type, and Default value as in the previous step.
-
Enable Allow use in source settings and select
Regular expressionfor the value validation. -
In the field, enter this Python regular expression to enable using uppercase and lowercase letters, digits, and underscores:
^[a-zA-Z0-9_]+$
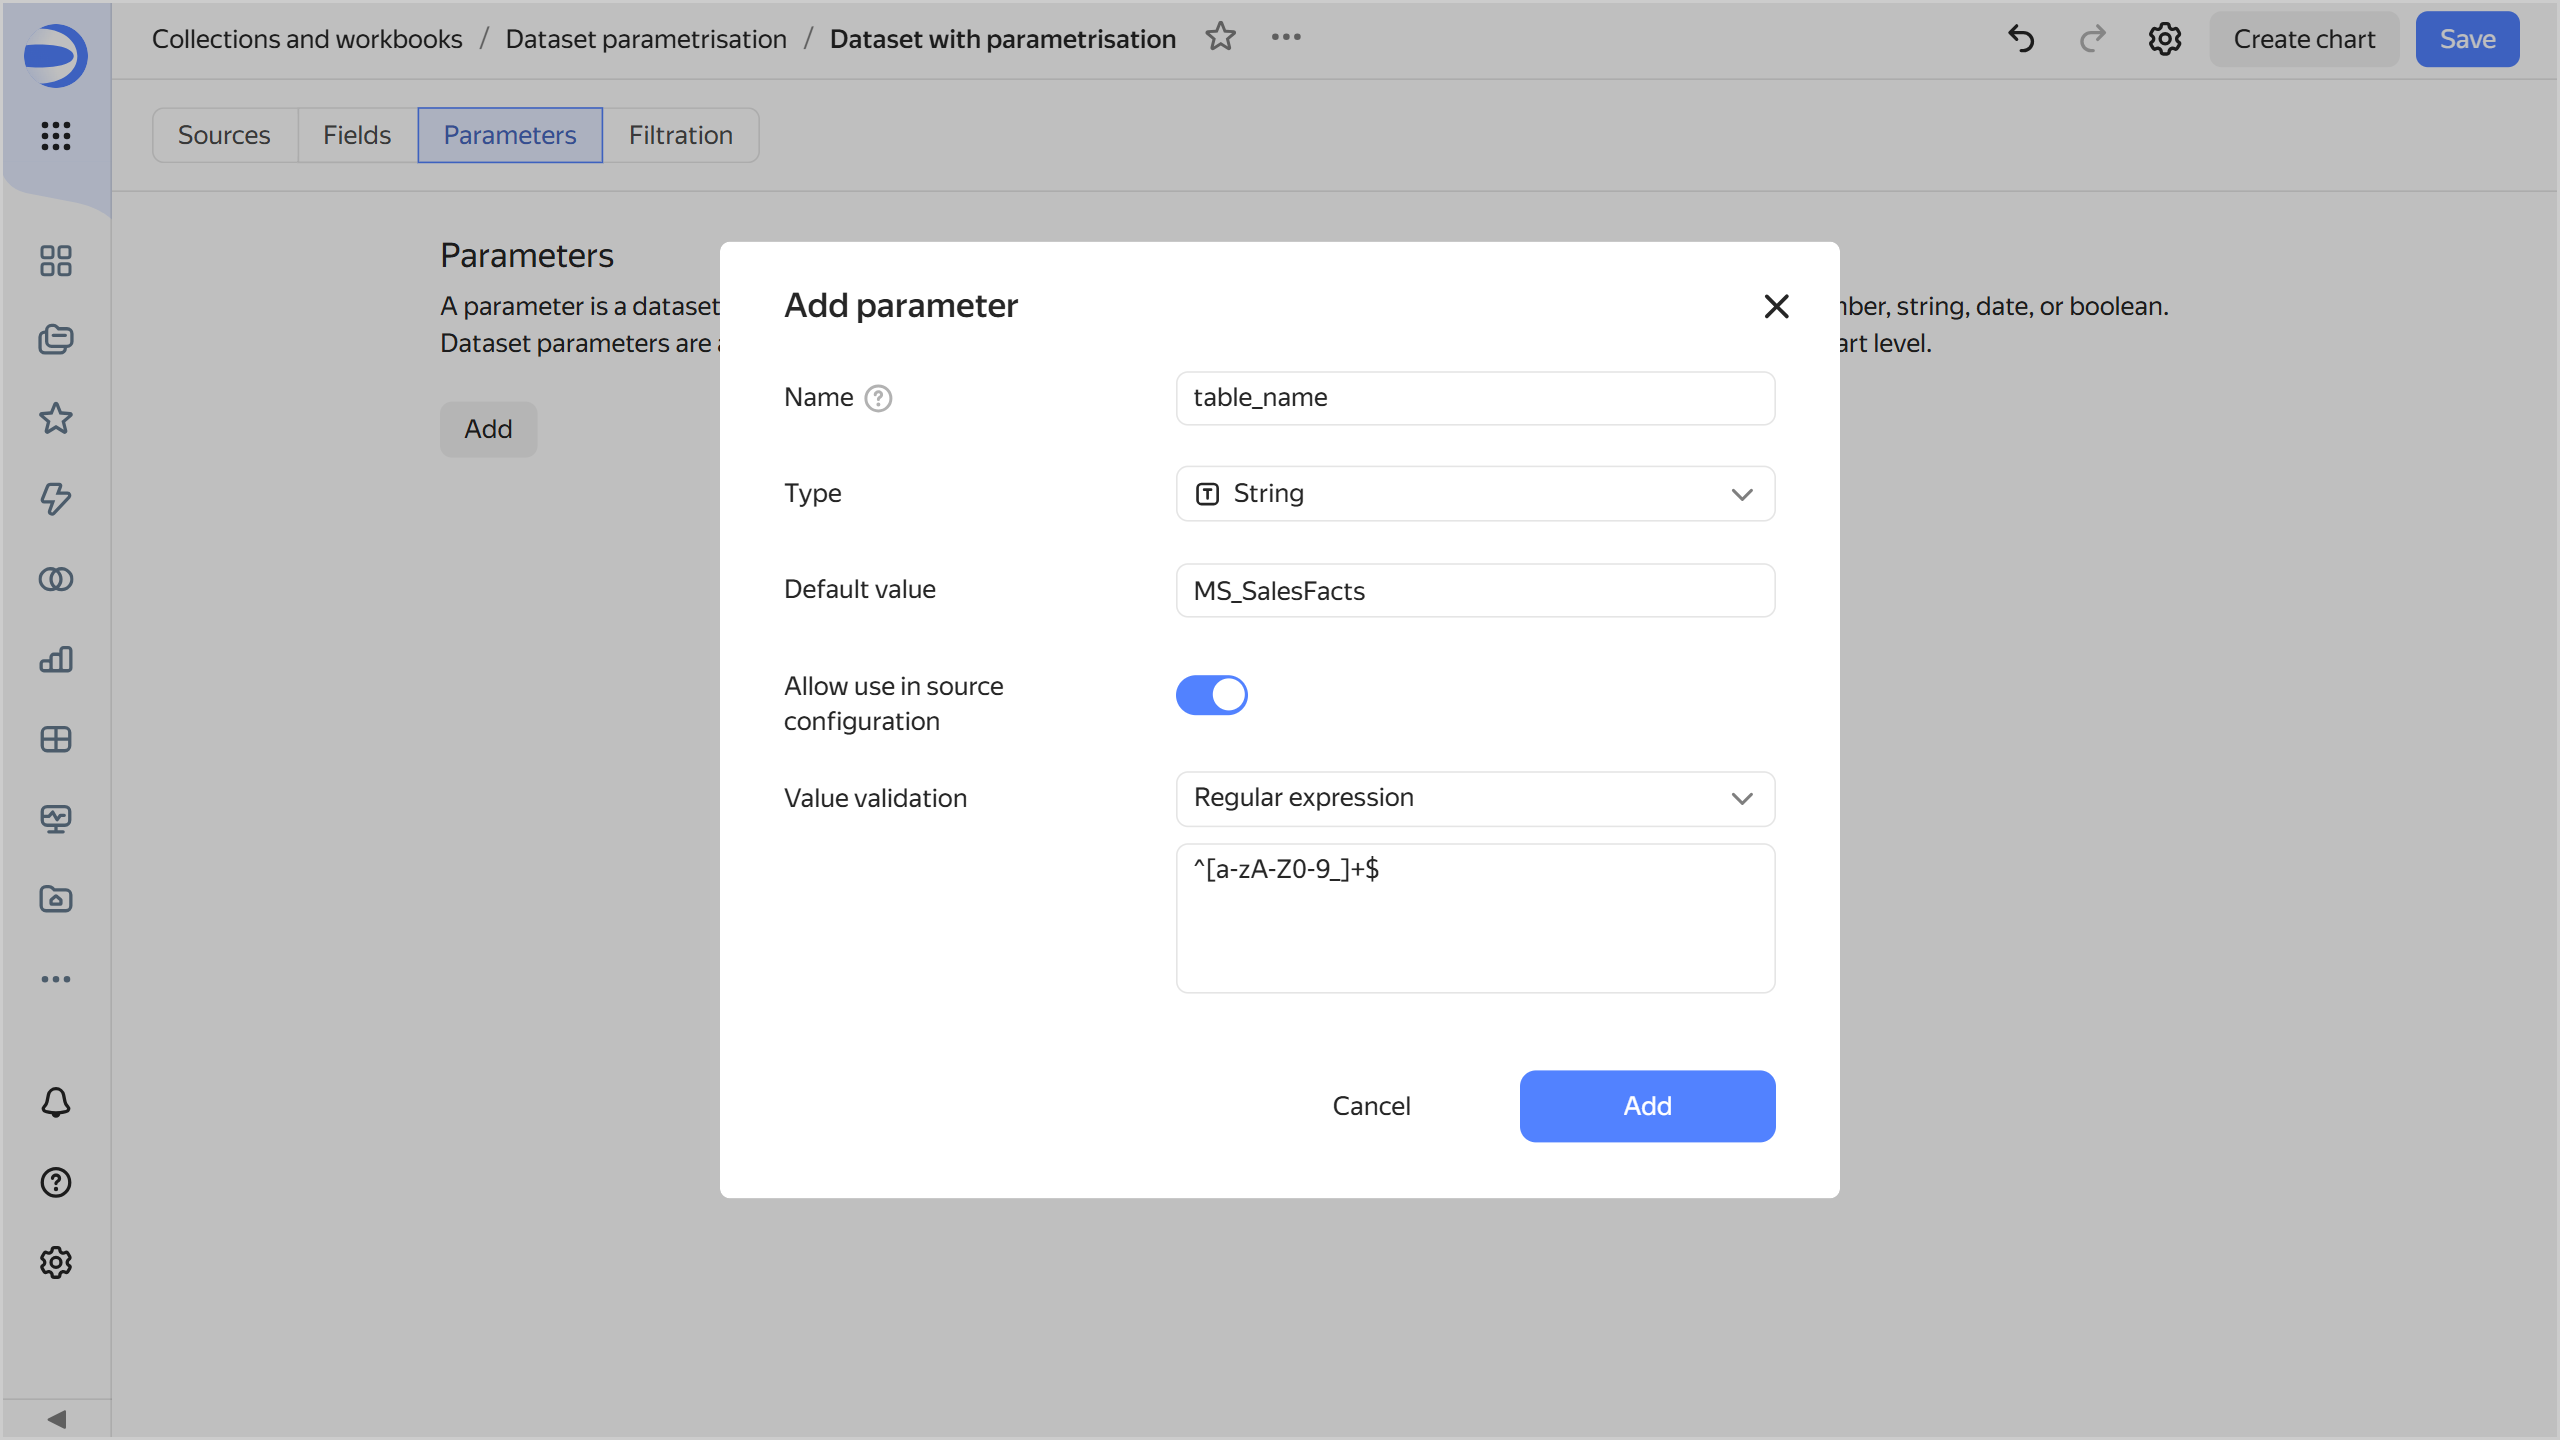
The
MS_SalesFactstable name matches this regular expression. When you click Add, the dataset validation will succeed. -
-
Save the dataset.
-
Change the settings to define the table name with a parameter:
-
Go to the Sources tab.
-
In the table list, click next to MS_SalesFacts and select Change settings.
-
Next to the Table name field set to
MS_SalesFacts, click and select thetable_nameparameter. The selected parameter will now define the table name.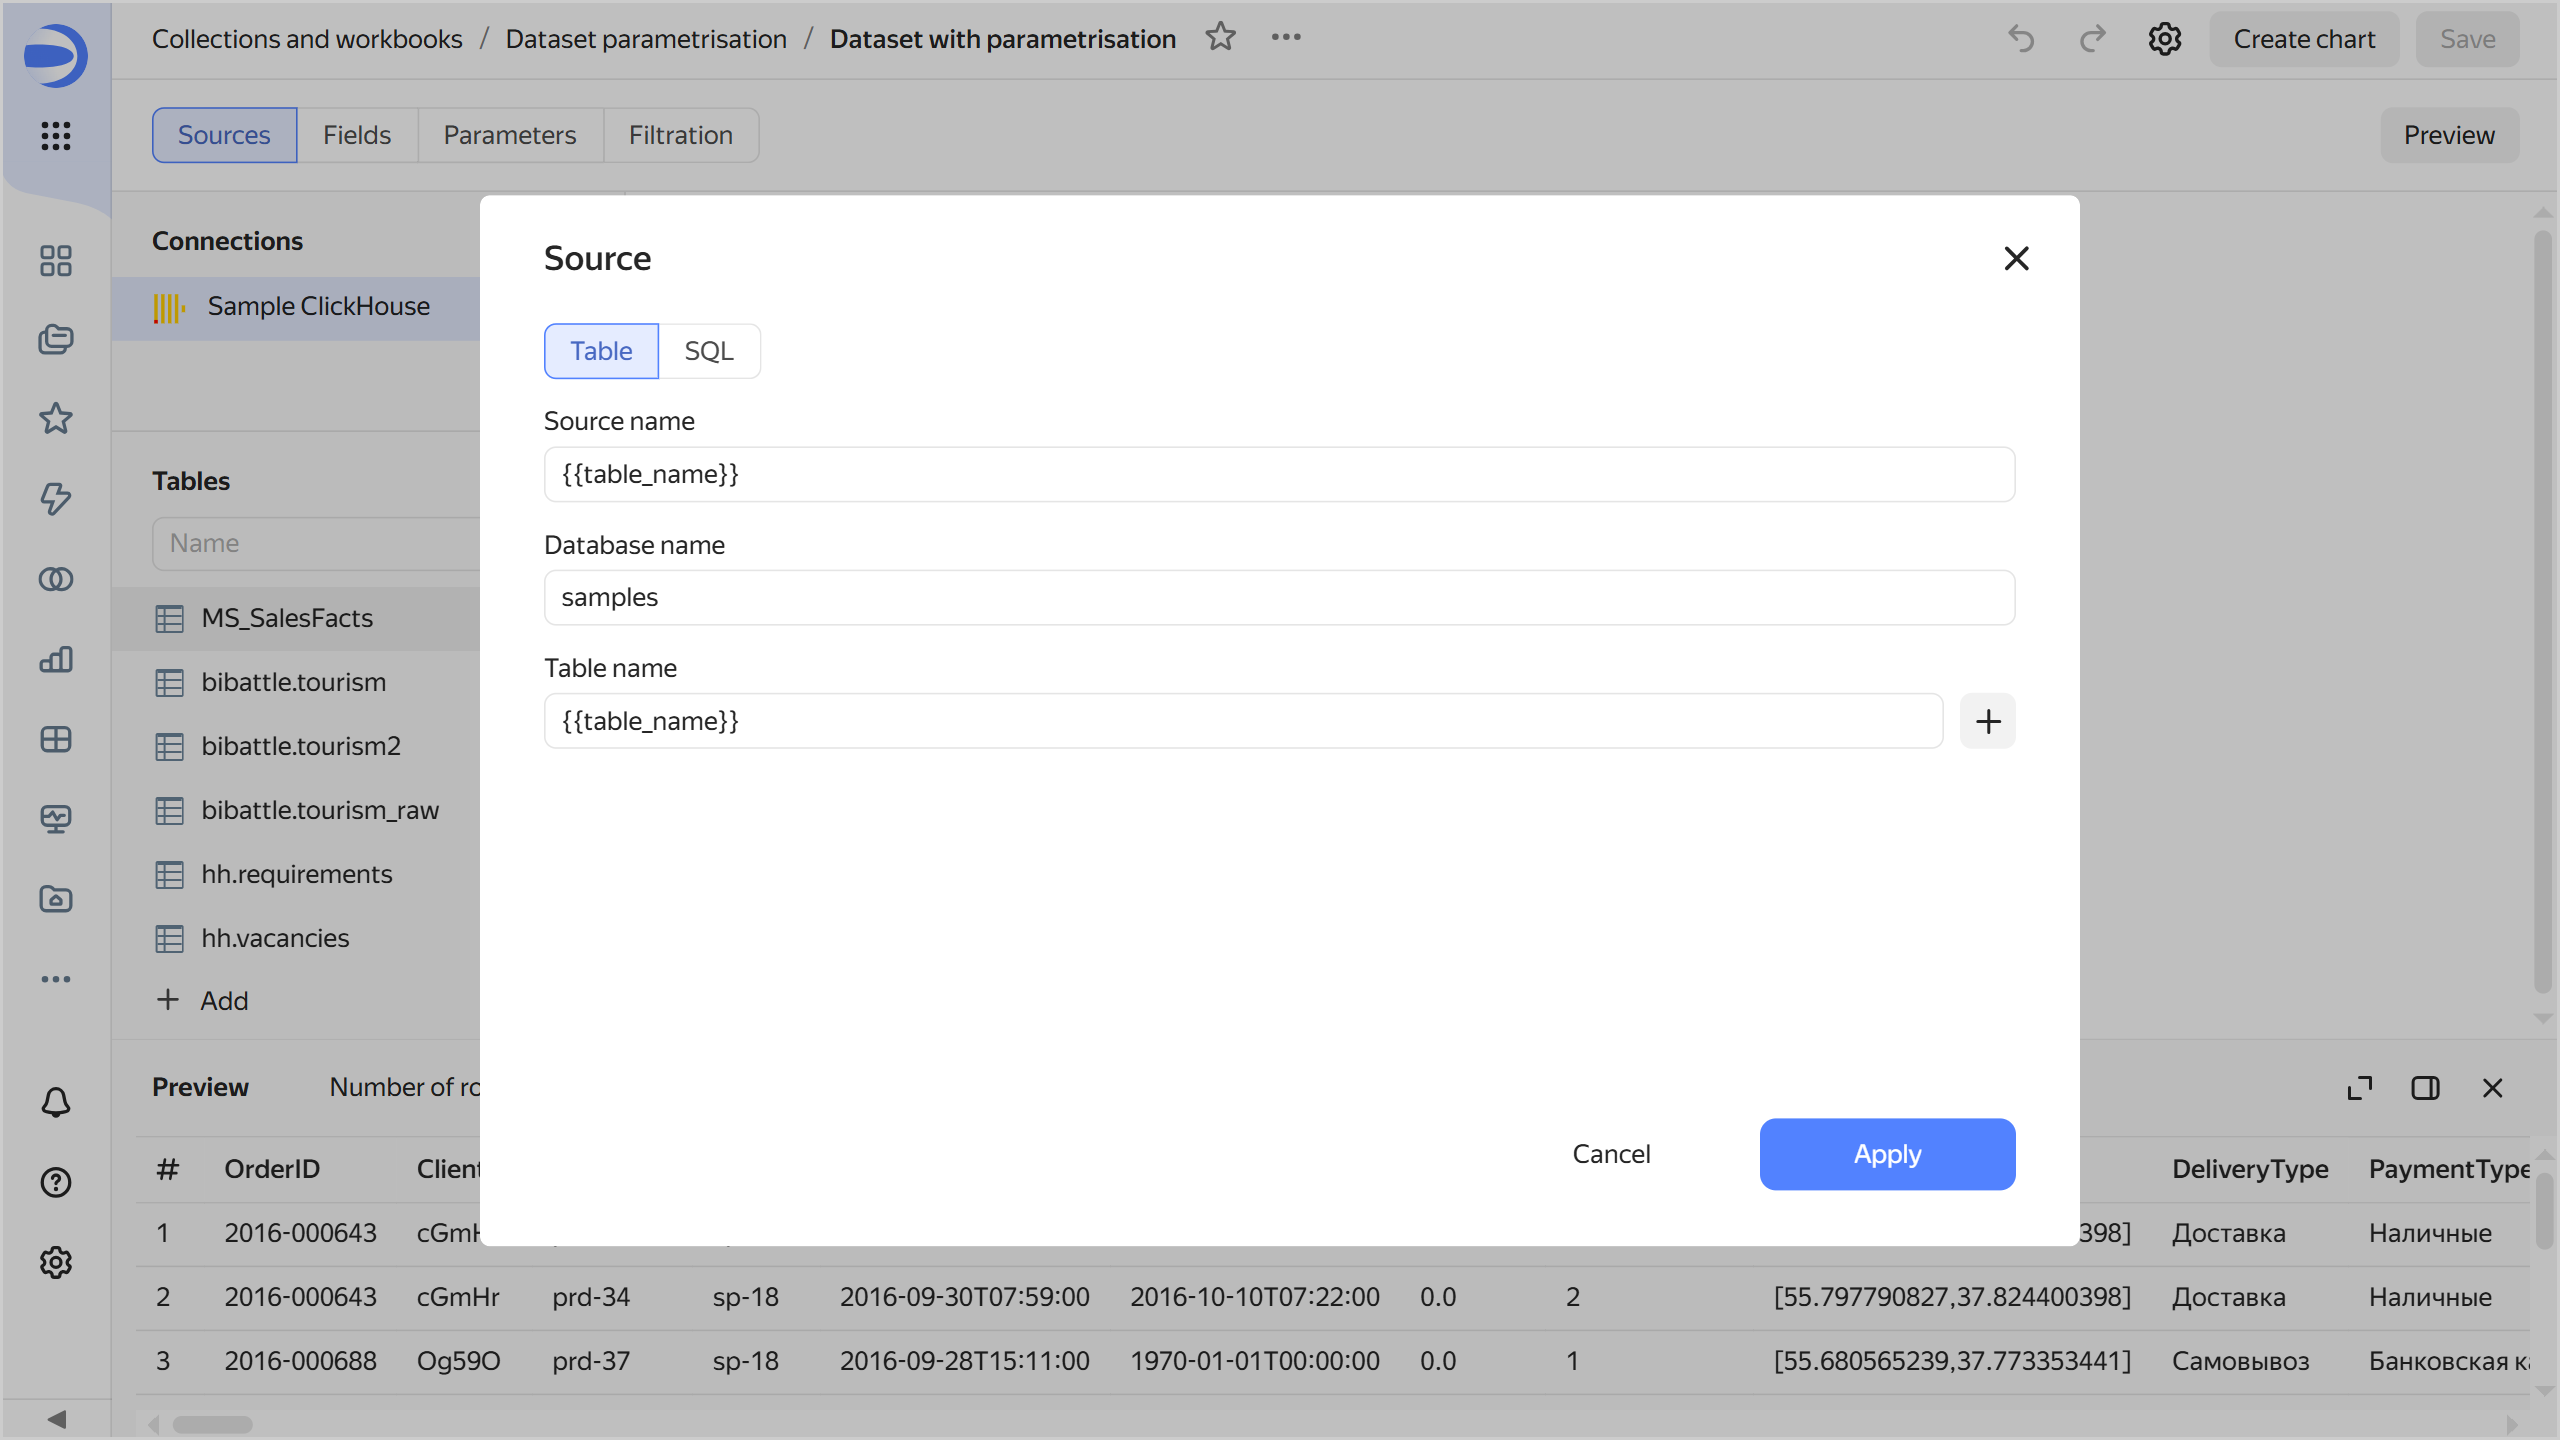
-
Click Apply and save the dataset.
-
Create a chart with a table selection parameter
-
At the top of your dataset, click Create chart.
-
Select the Table visualization type.
-
Create a calculated field:
- On the left side of the screen above the list of dataset fields, click and select Field.
- Enter
Yearfor the name. - Enter the formula:
YEAR([OrderDatetime]). - Click Create.
-
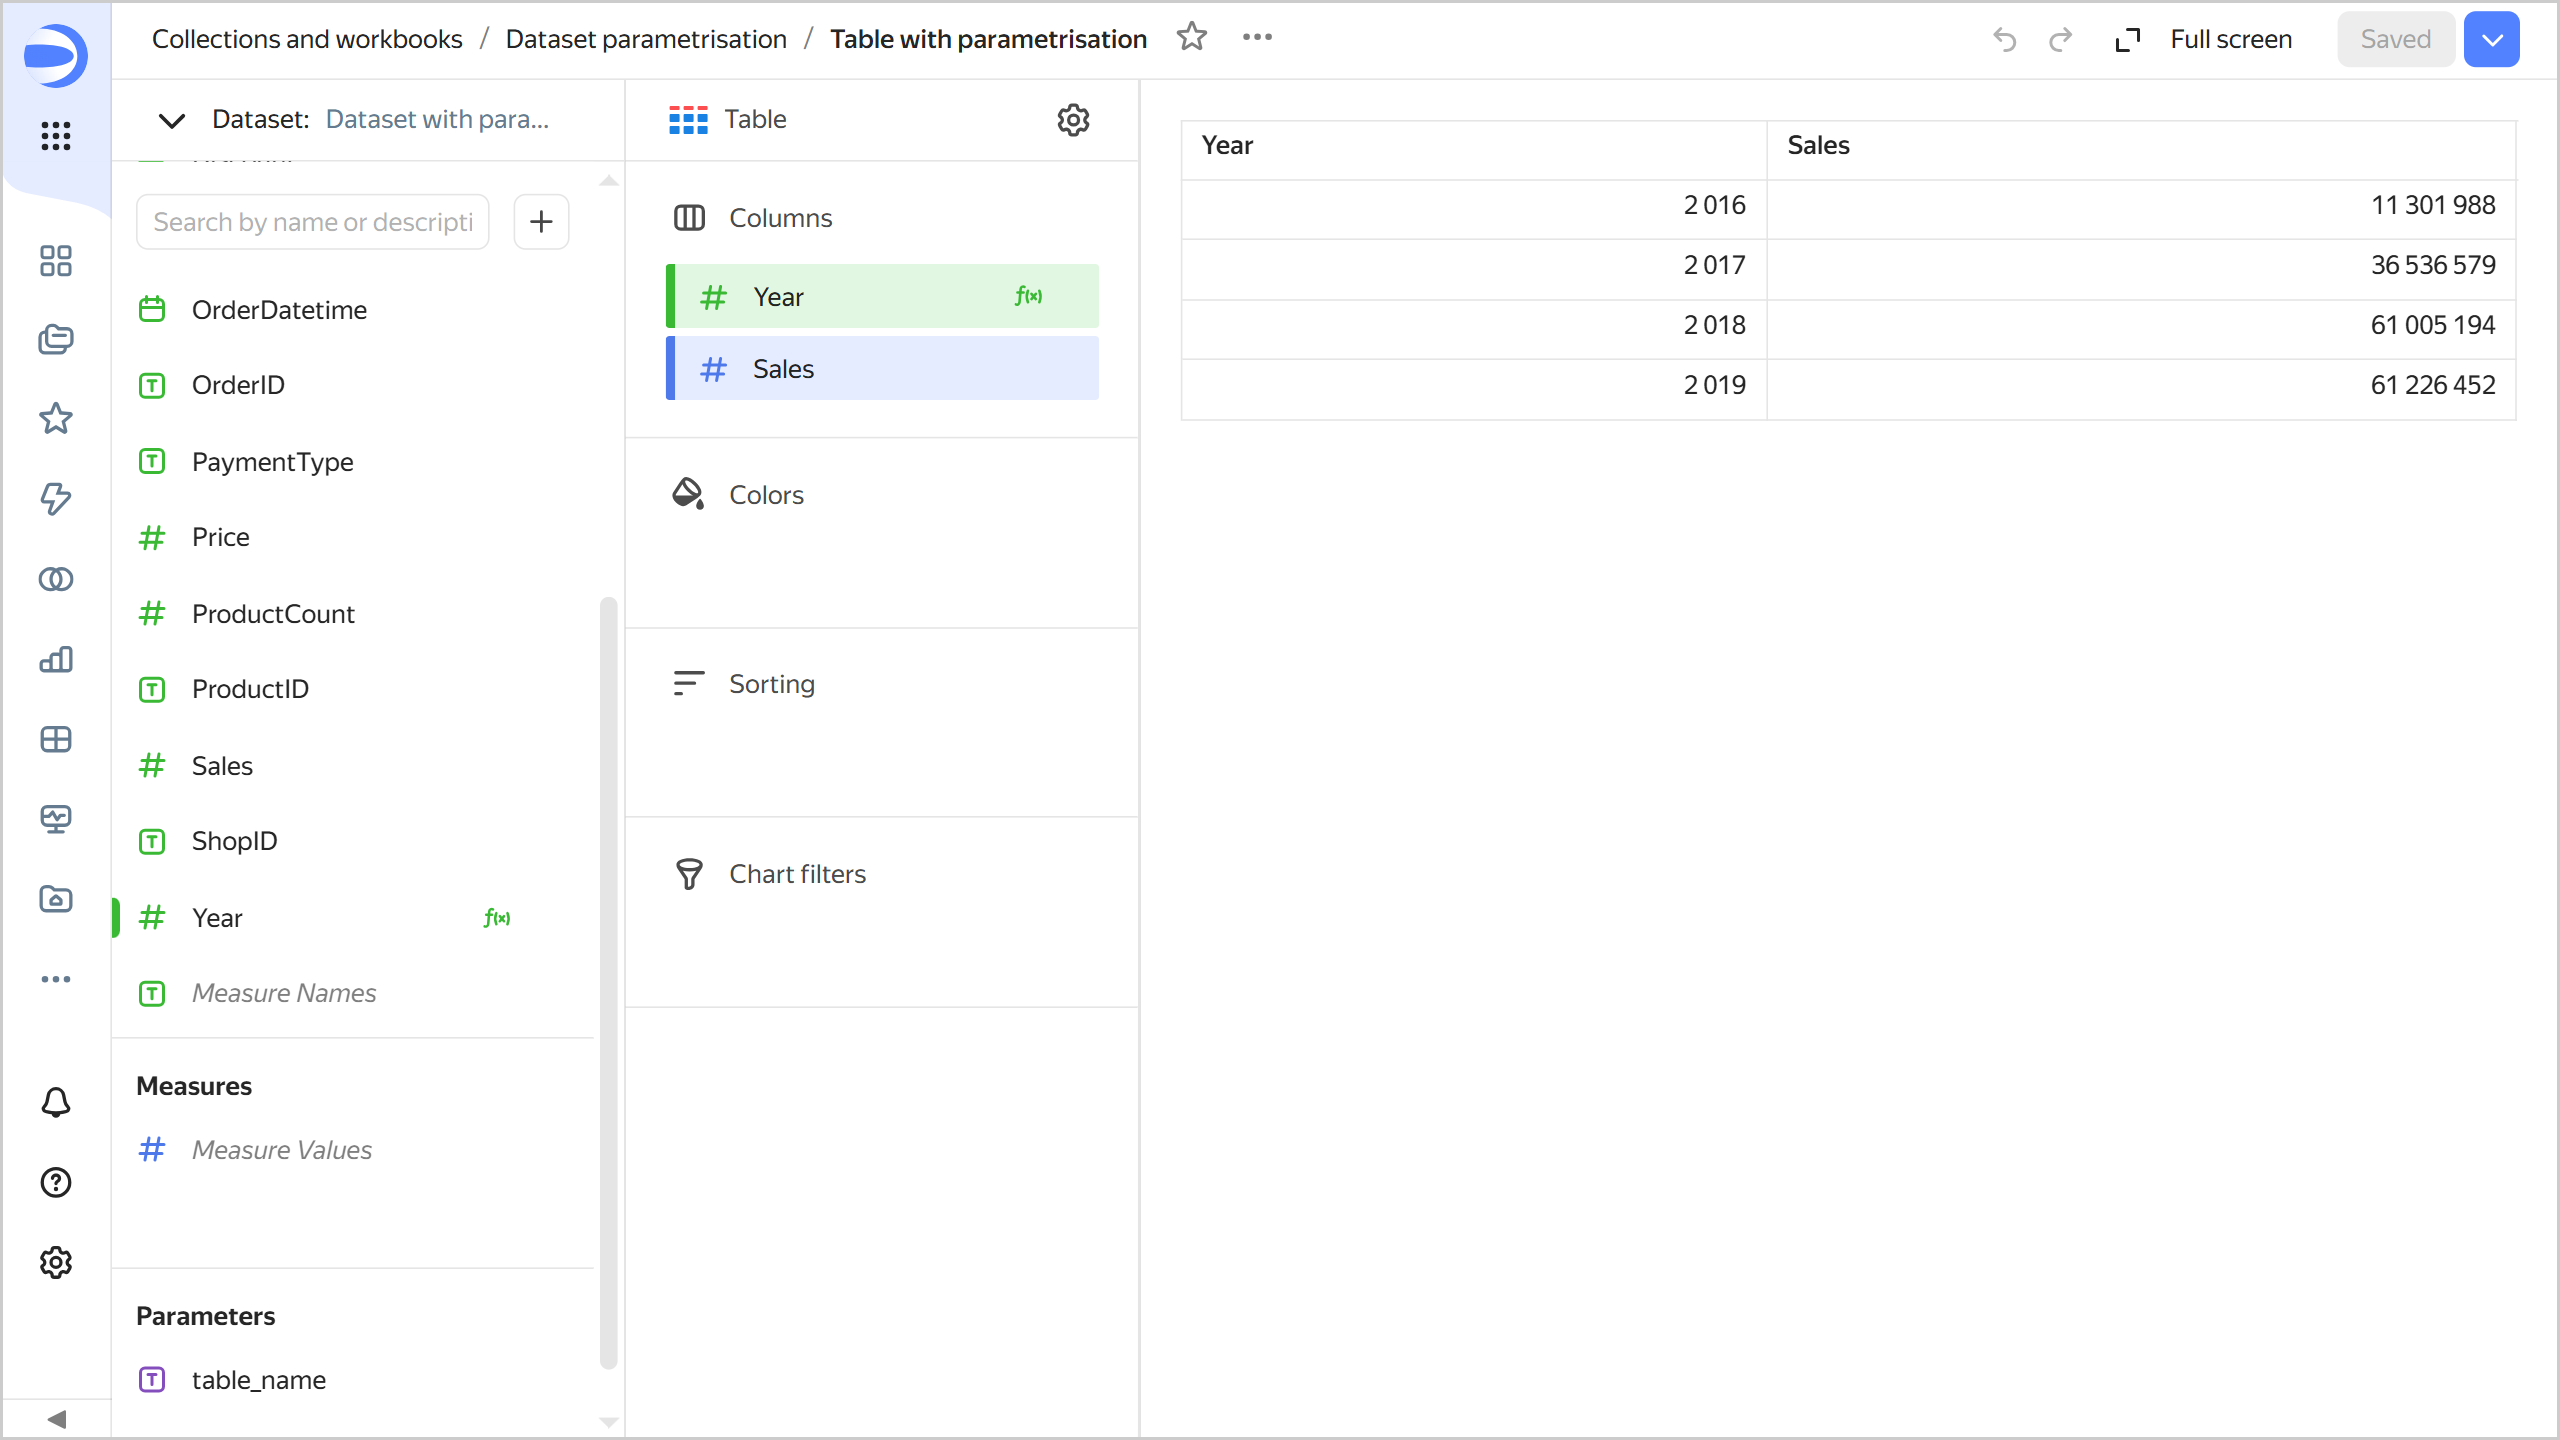
Add the new field to the chart. To do this, drag the
Yearfield from Dimensions to the Columns section. -
Add total sales to the chart. To do this, drag the
Salesfield from Dimensions to the Columns section and change its aggregation settings:- In the Columns section, click
#next to theSalesfield. - In the Aggregation field, select Sum and click Apply.
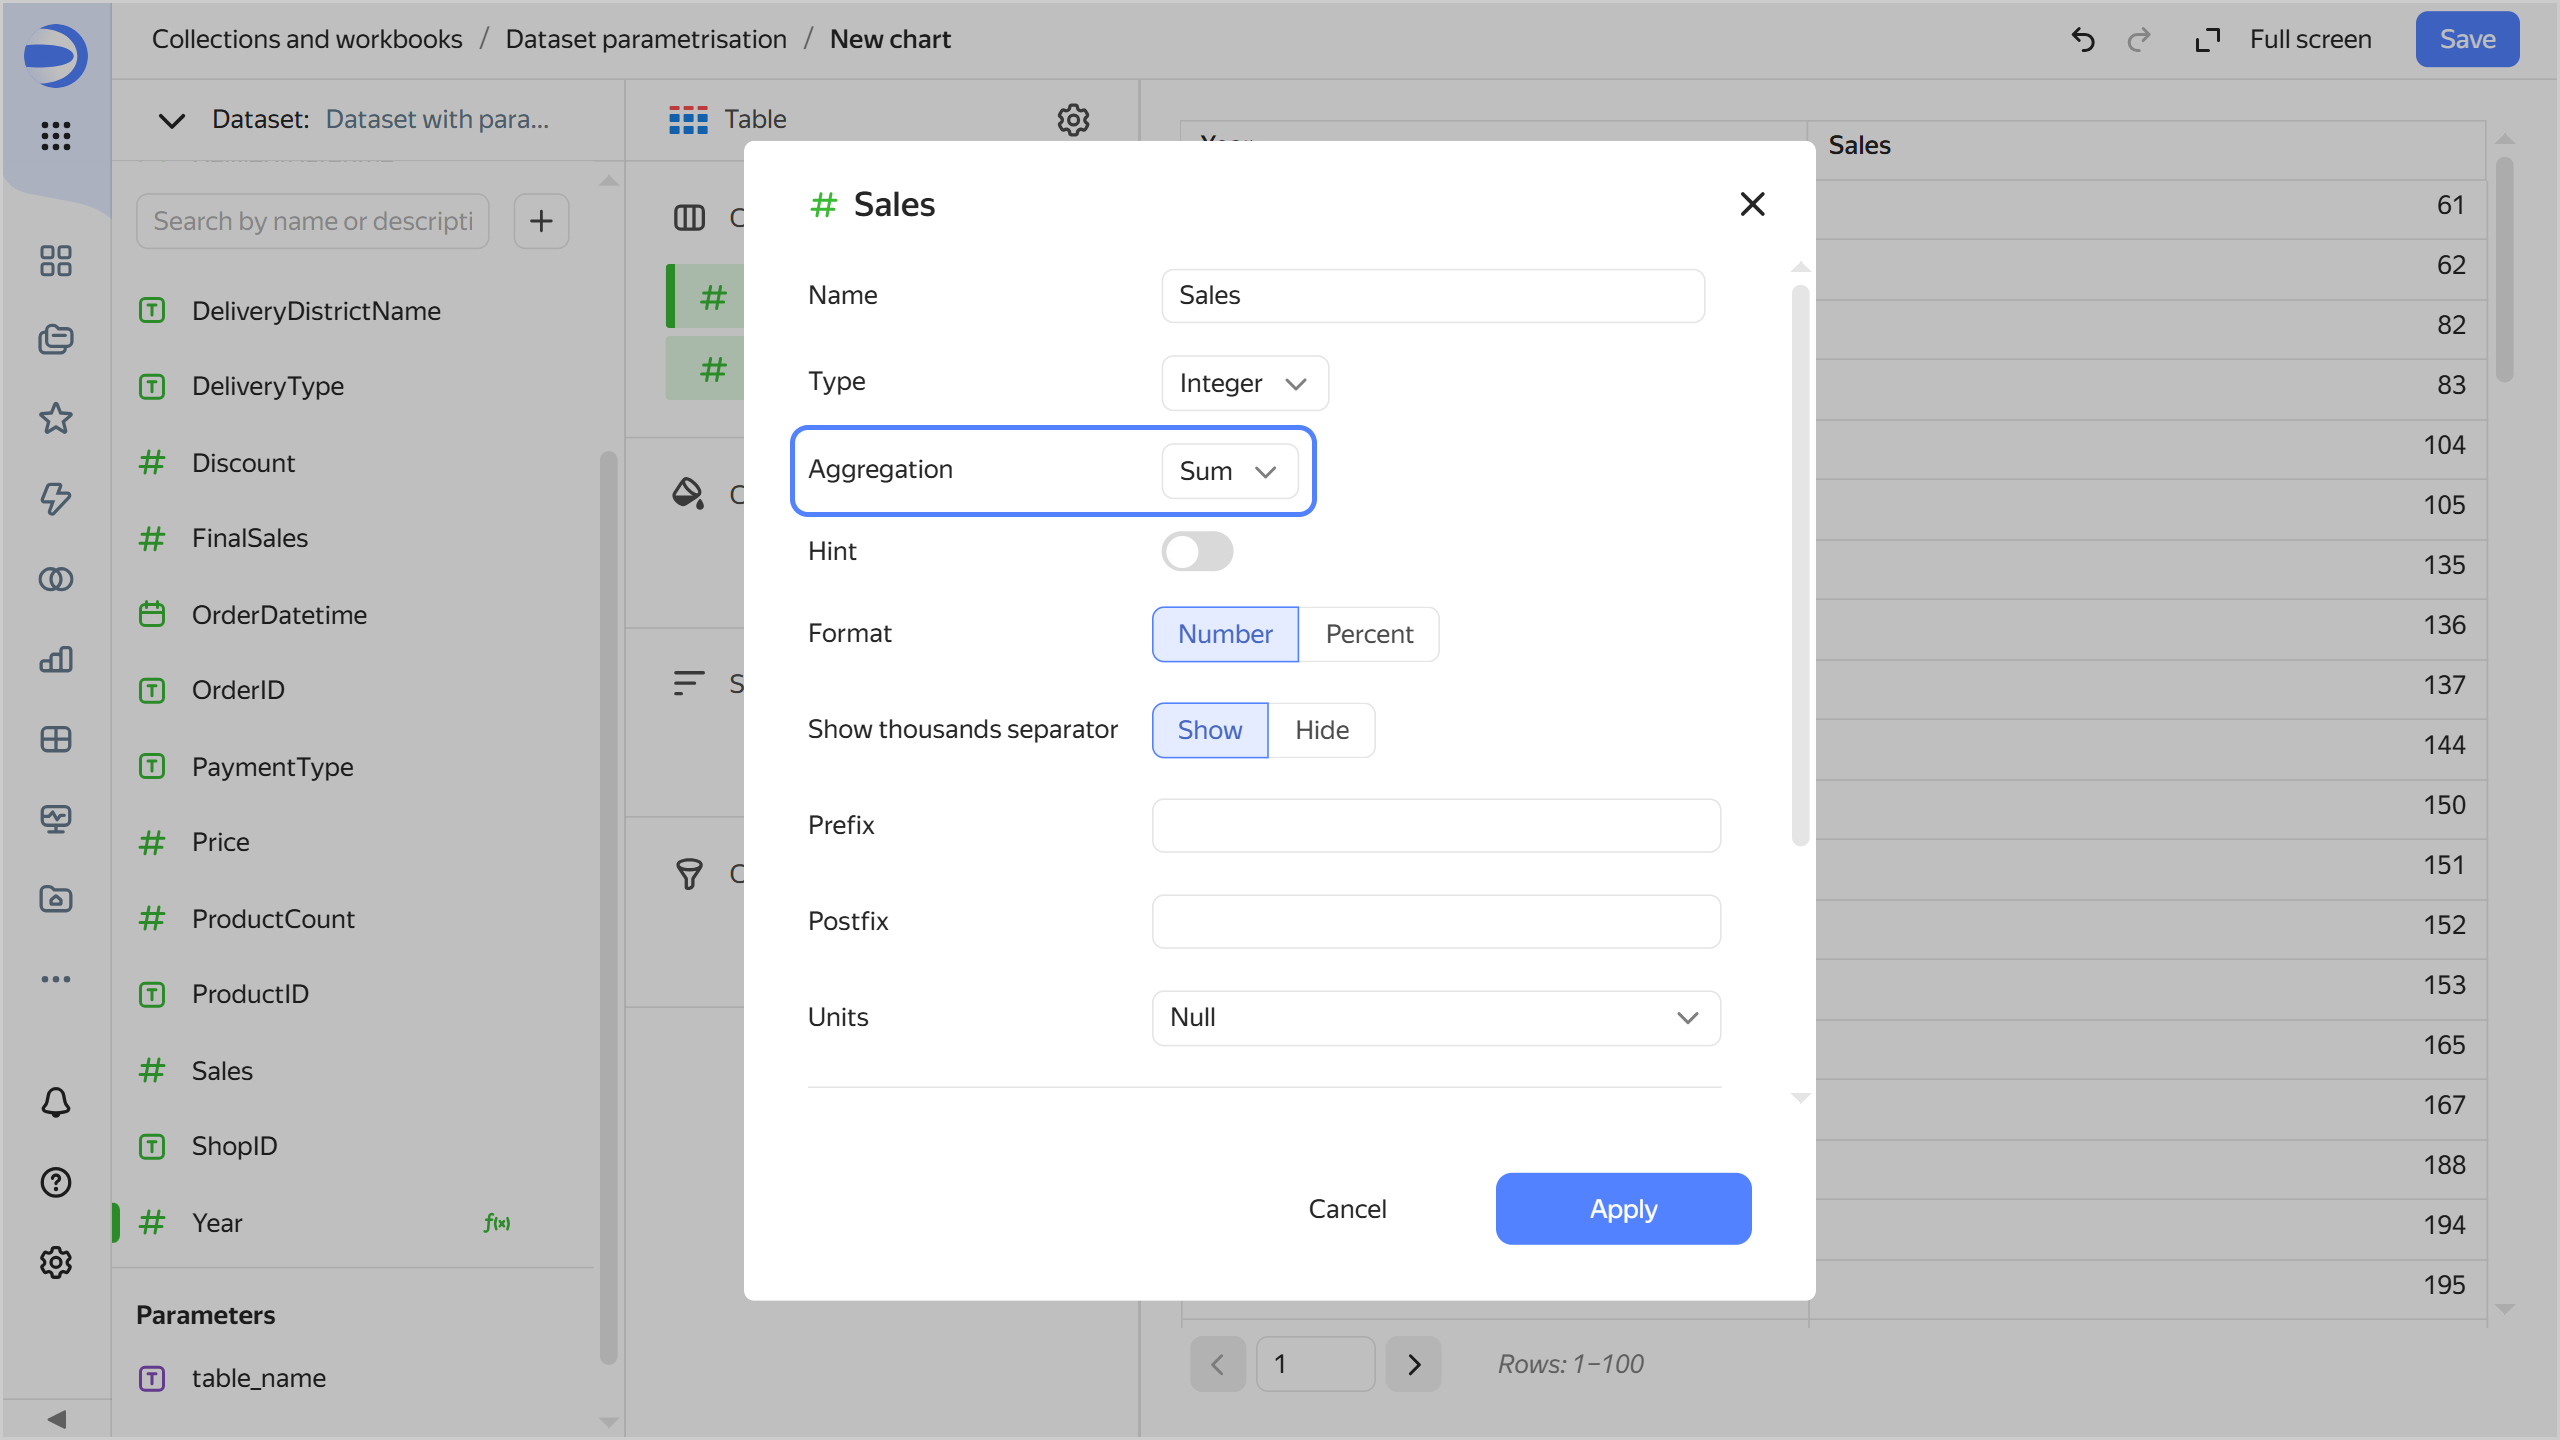
- In the Columns section, click
-
Open the chart inspector and make sure the data comes from the
MS_SalesFactstable. Do it by clicking → Inspector in the top-right corner of the chart.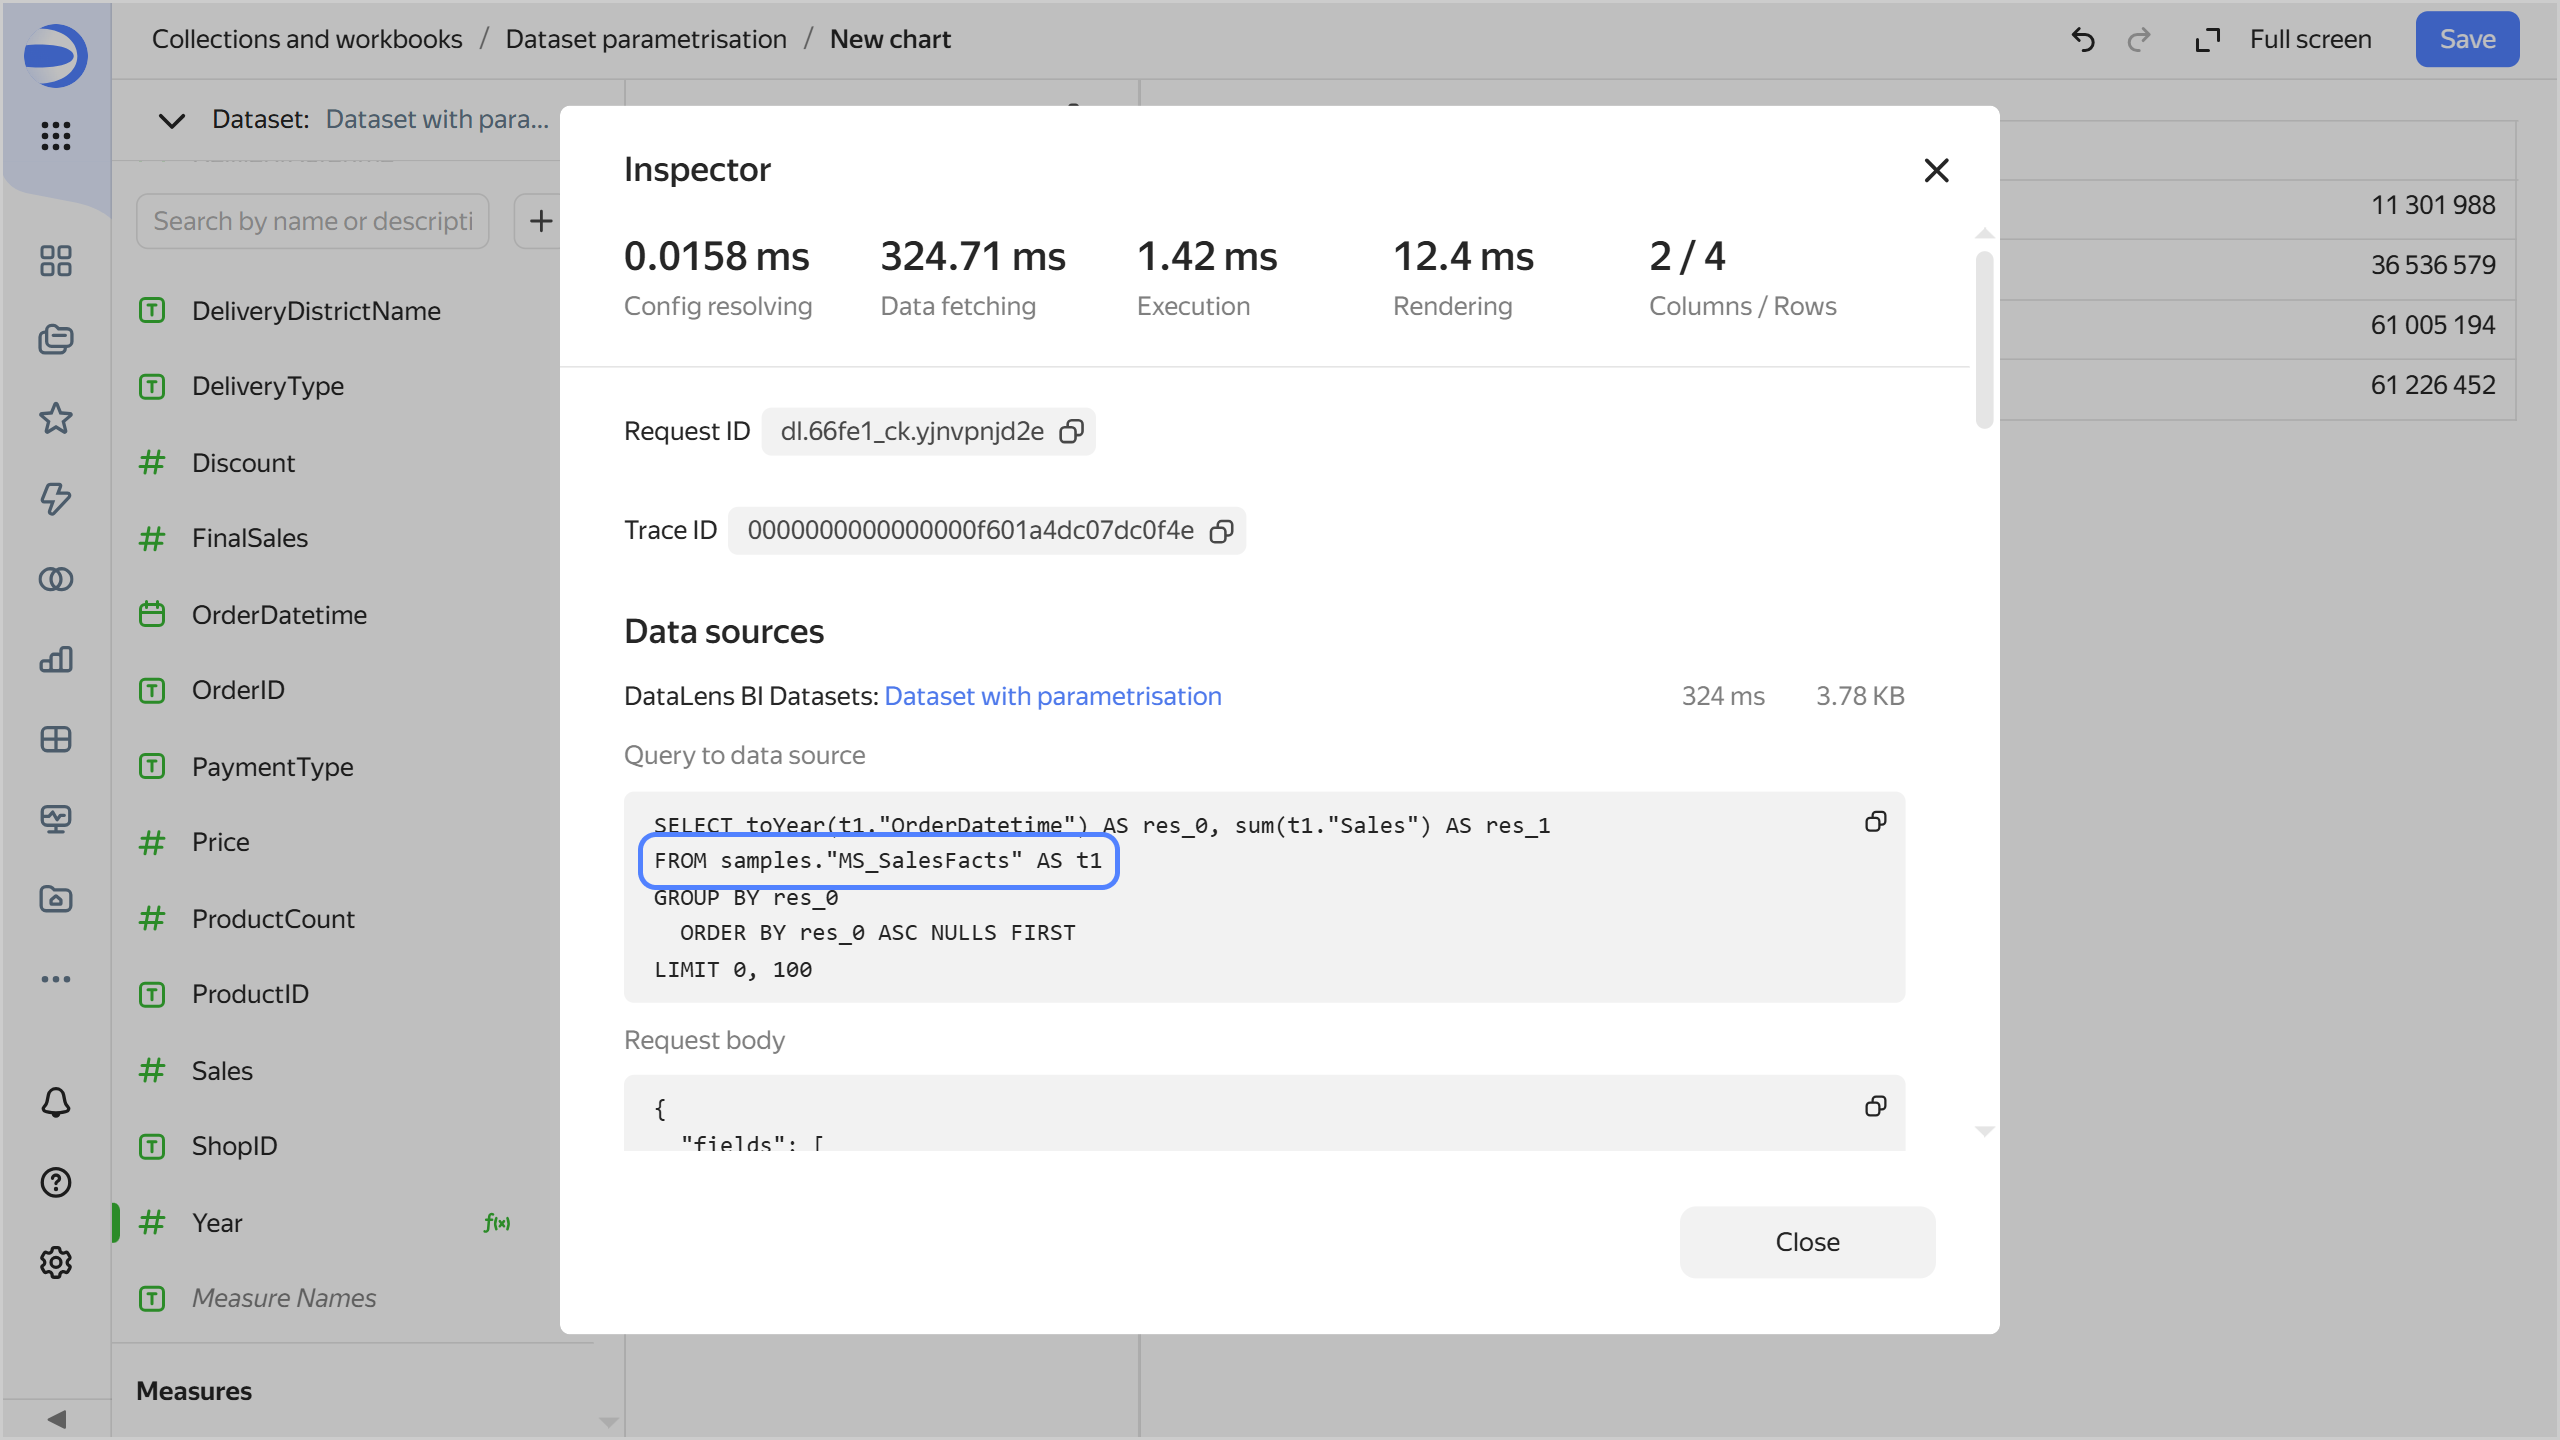
-
Save the chart:
- In the top-right corner, click Save.
- In the window that opens, enter
Table with parametrisationfor the chart name and click Save.
-
Change the table name in the relevant chart parameter:
-
Under Parameters, click the icon next to
table_name. -
Set the default value to
MS_SalesFacts_up.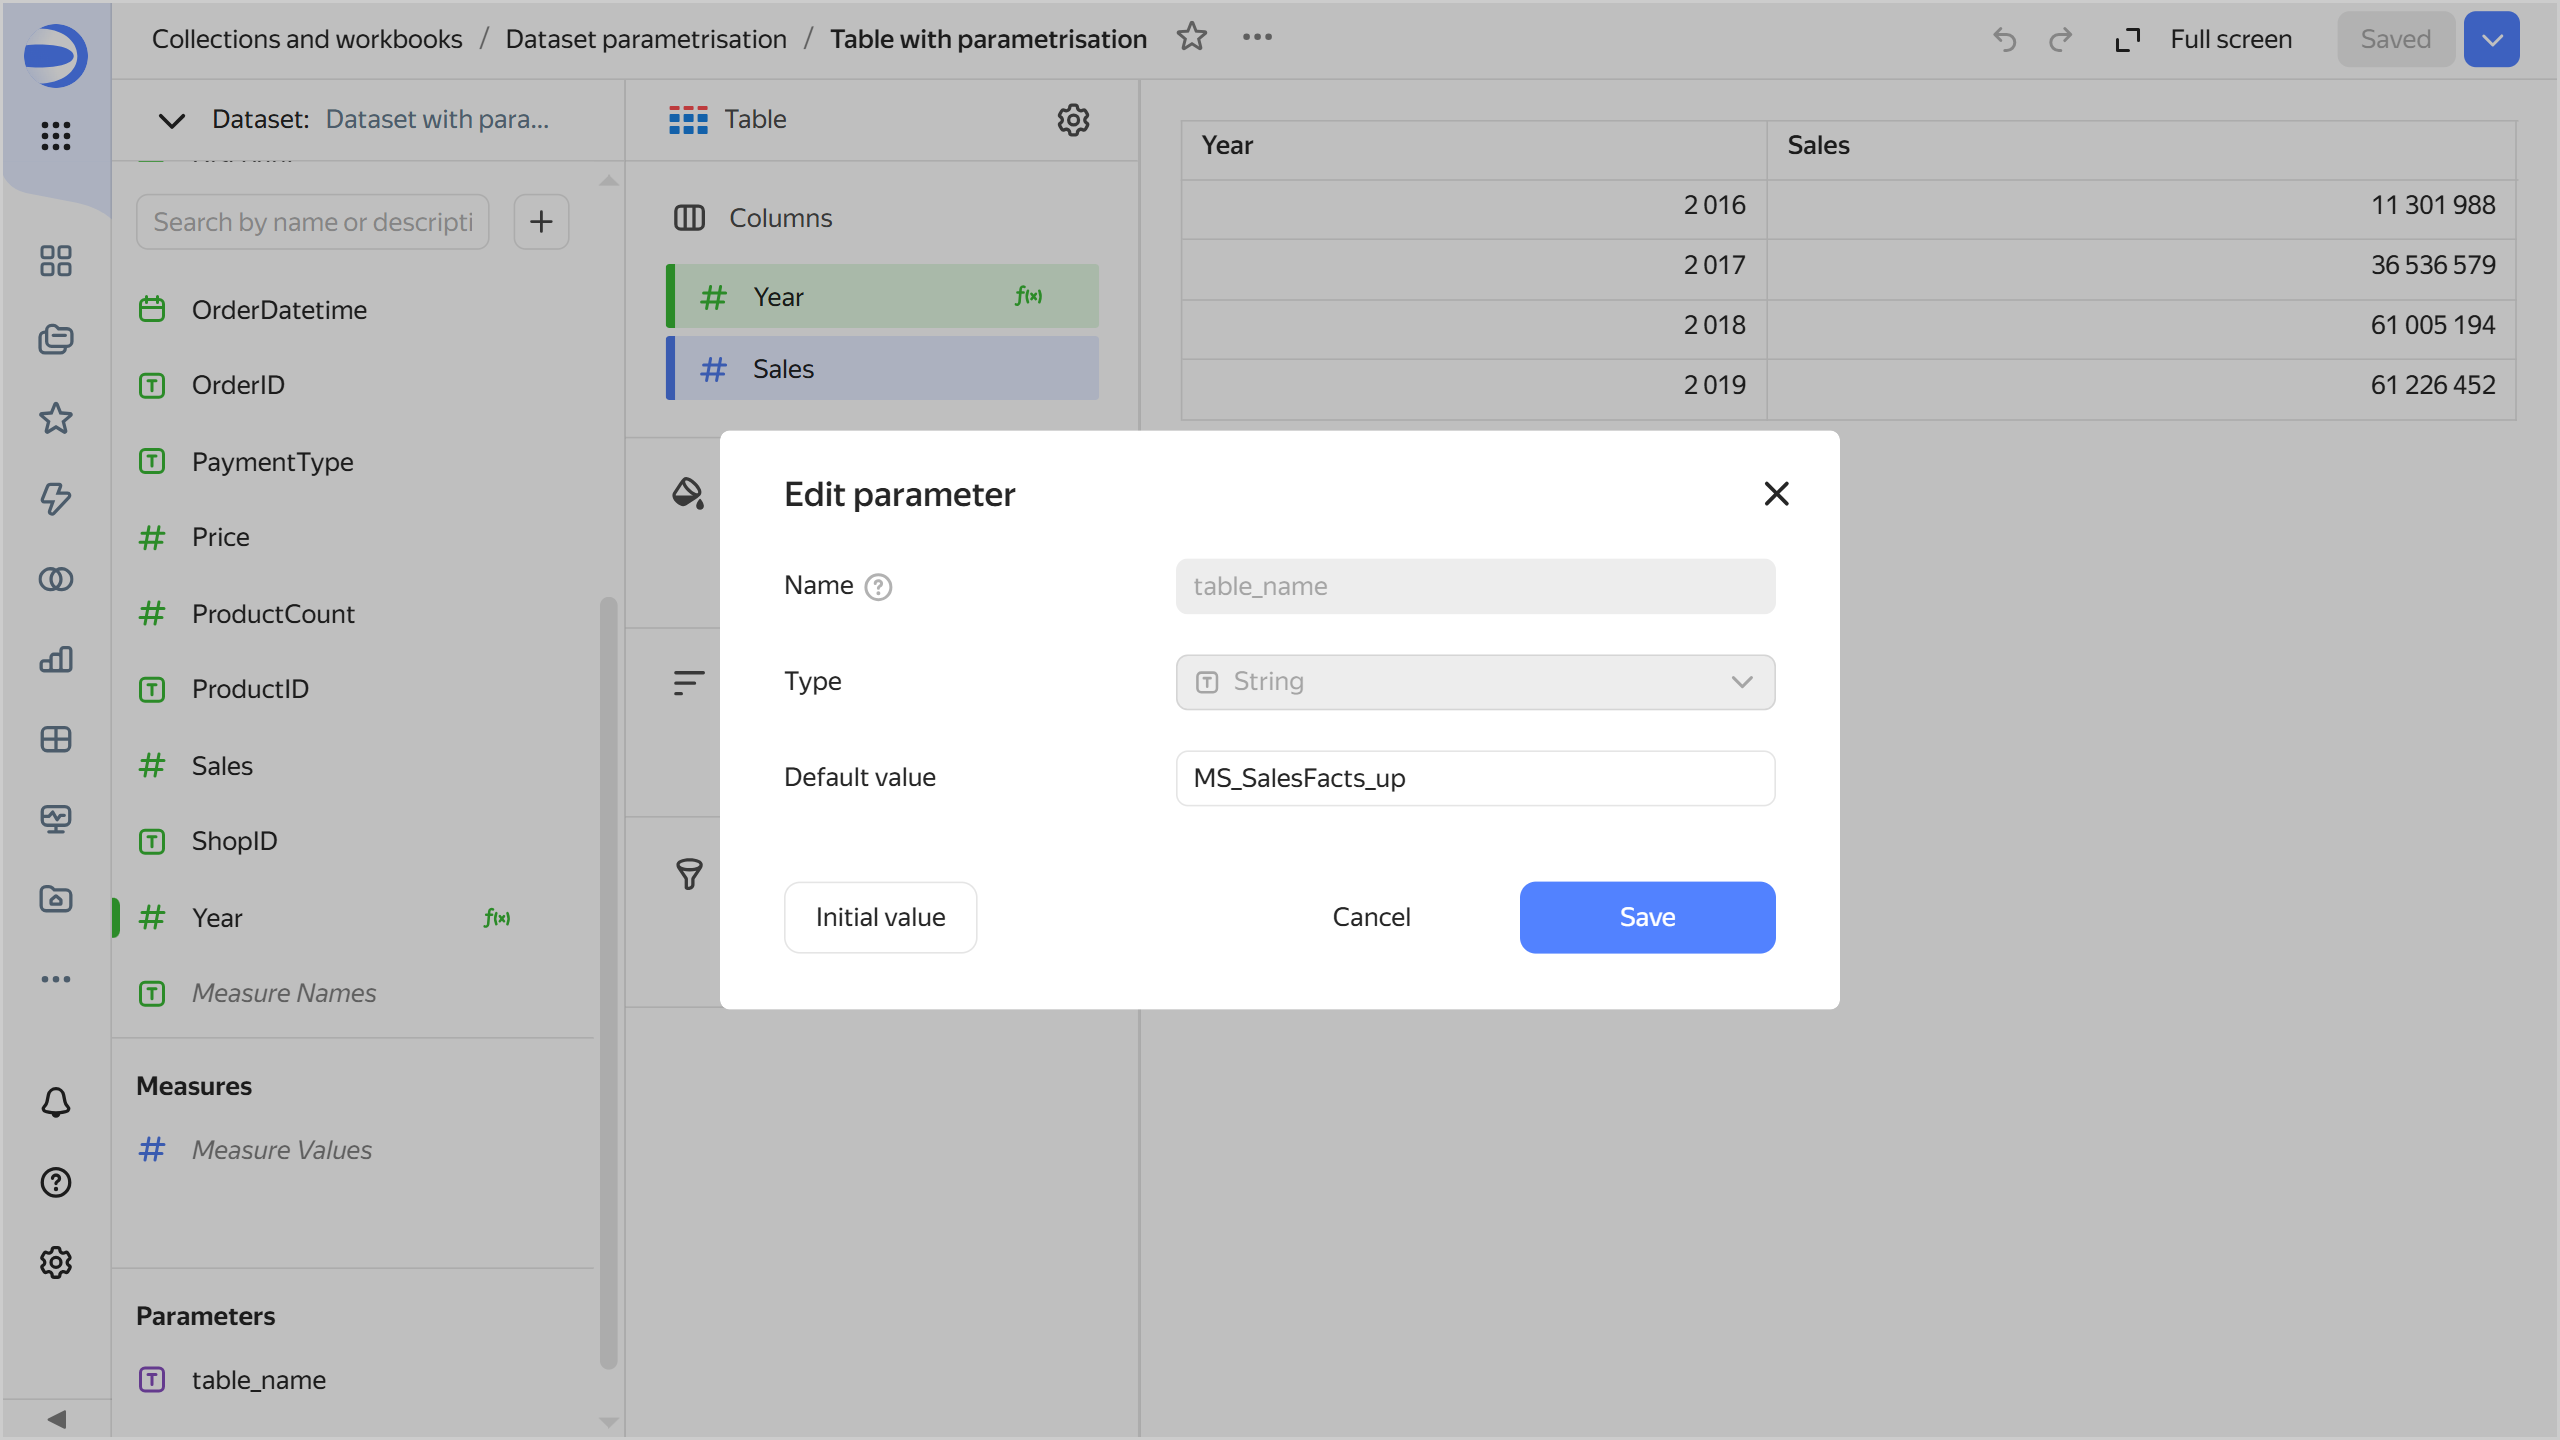
-
Click Save. Now, the chart uses data from the
MS_SalesFacts_uptable.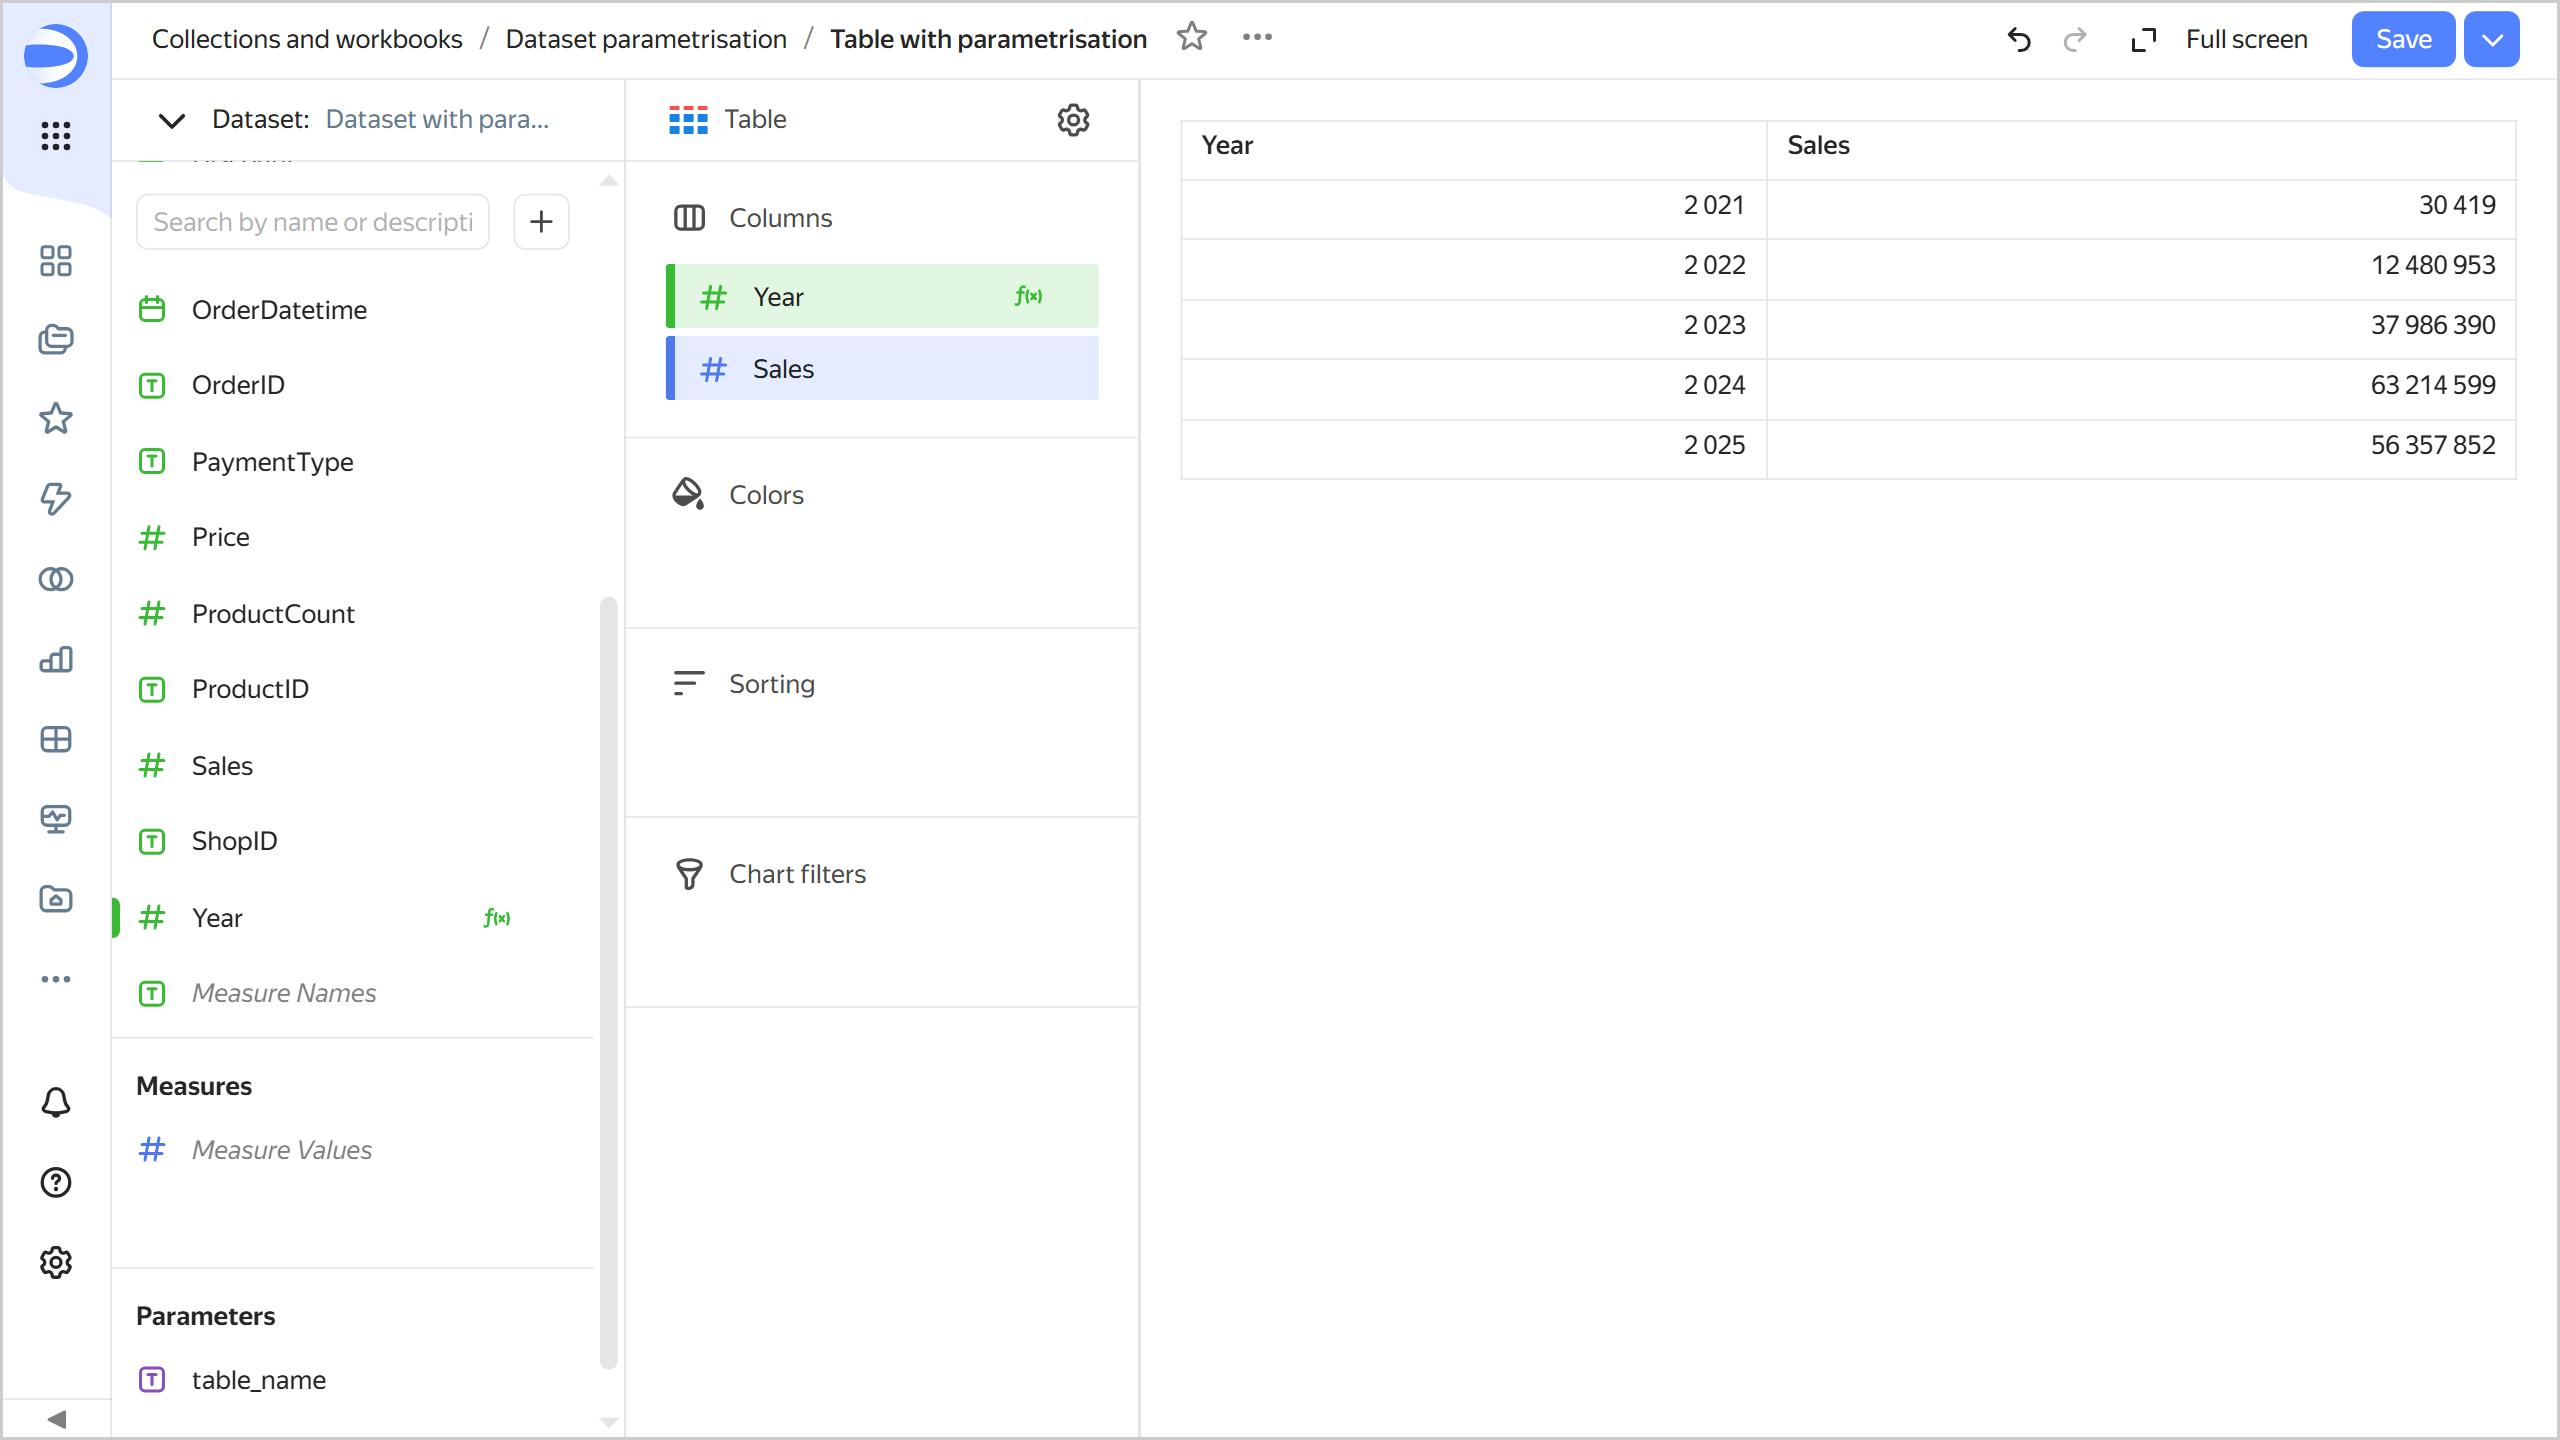
-
Create a dataset with a subquery parameter
Create another dataset based on the Sample ClickHouse connection:
-
Navigate to the
Sample ClickHouseconnection and click Create dataset in the top-right corner. -
Add an SQL query against the source:
-
At the bottom left under the table list, click → Add.
-
Open the SQL tab and enter the following query text in the Subquery field:
SELECT * FROM samples.MS_SalesFacts -
Click Apply.
-
-
Enable parameterization in the dataset settings. To do this, click at the top and select Enable parameterization.
-
Save the dataset:
- In the top-right corner, click Save.
- Enter
Dataset with parametrisation for sqlfor the dataset name and click Create.
-
Add a parameter with the subquery condition:
-
Go to the Parameters tab.
-
Click Add and configure as follows:
-
Name:
custom_where. -
Type:
String. -
Default value:
1=1. This condition will always returnTrue. -
Enable Allow use in source settings and select
Regular expressionfor the value validation. In the field, enter this Python regular expression to allow characters you may need to use when writing SQL queries:^[a-zA-Z0-9а-яАА-ЯёЁ_\s\(\)\.\'\=\-\+\*/\,\<\>!]+$
When you click Add, the dataset validation will succeed.
-
-
-
Save the dataset.
-
Add a condition to the SQL query text using the parameter:
-
Go to the Sources tab.
-
In the table list, click next to SQL and select Change settings.
-
In the Subquery field, add a
WHEREclause to your query:SELECT * FROM samples.MS_SalesFacts WHERE -
Under the query input field, click Insert parameter and select
custom_where. The selected parameter will now define the SQL query condition:SELECT * FROM samples.MS_SalesFacts WHERE {{custom_where}}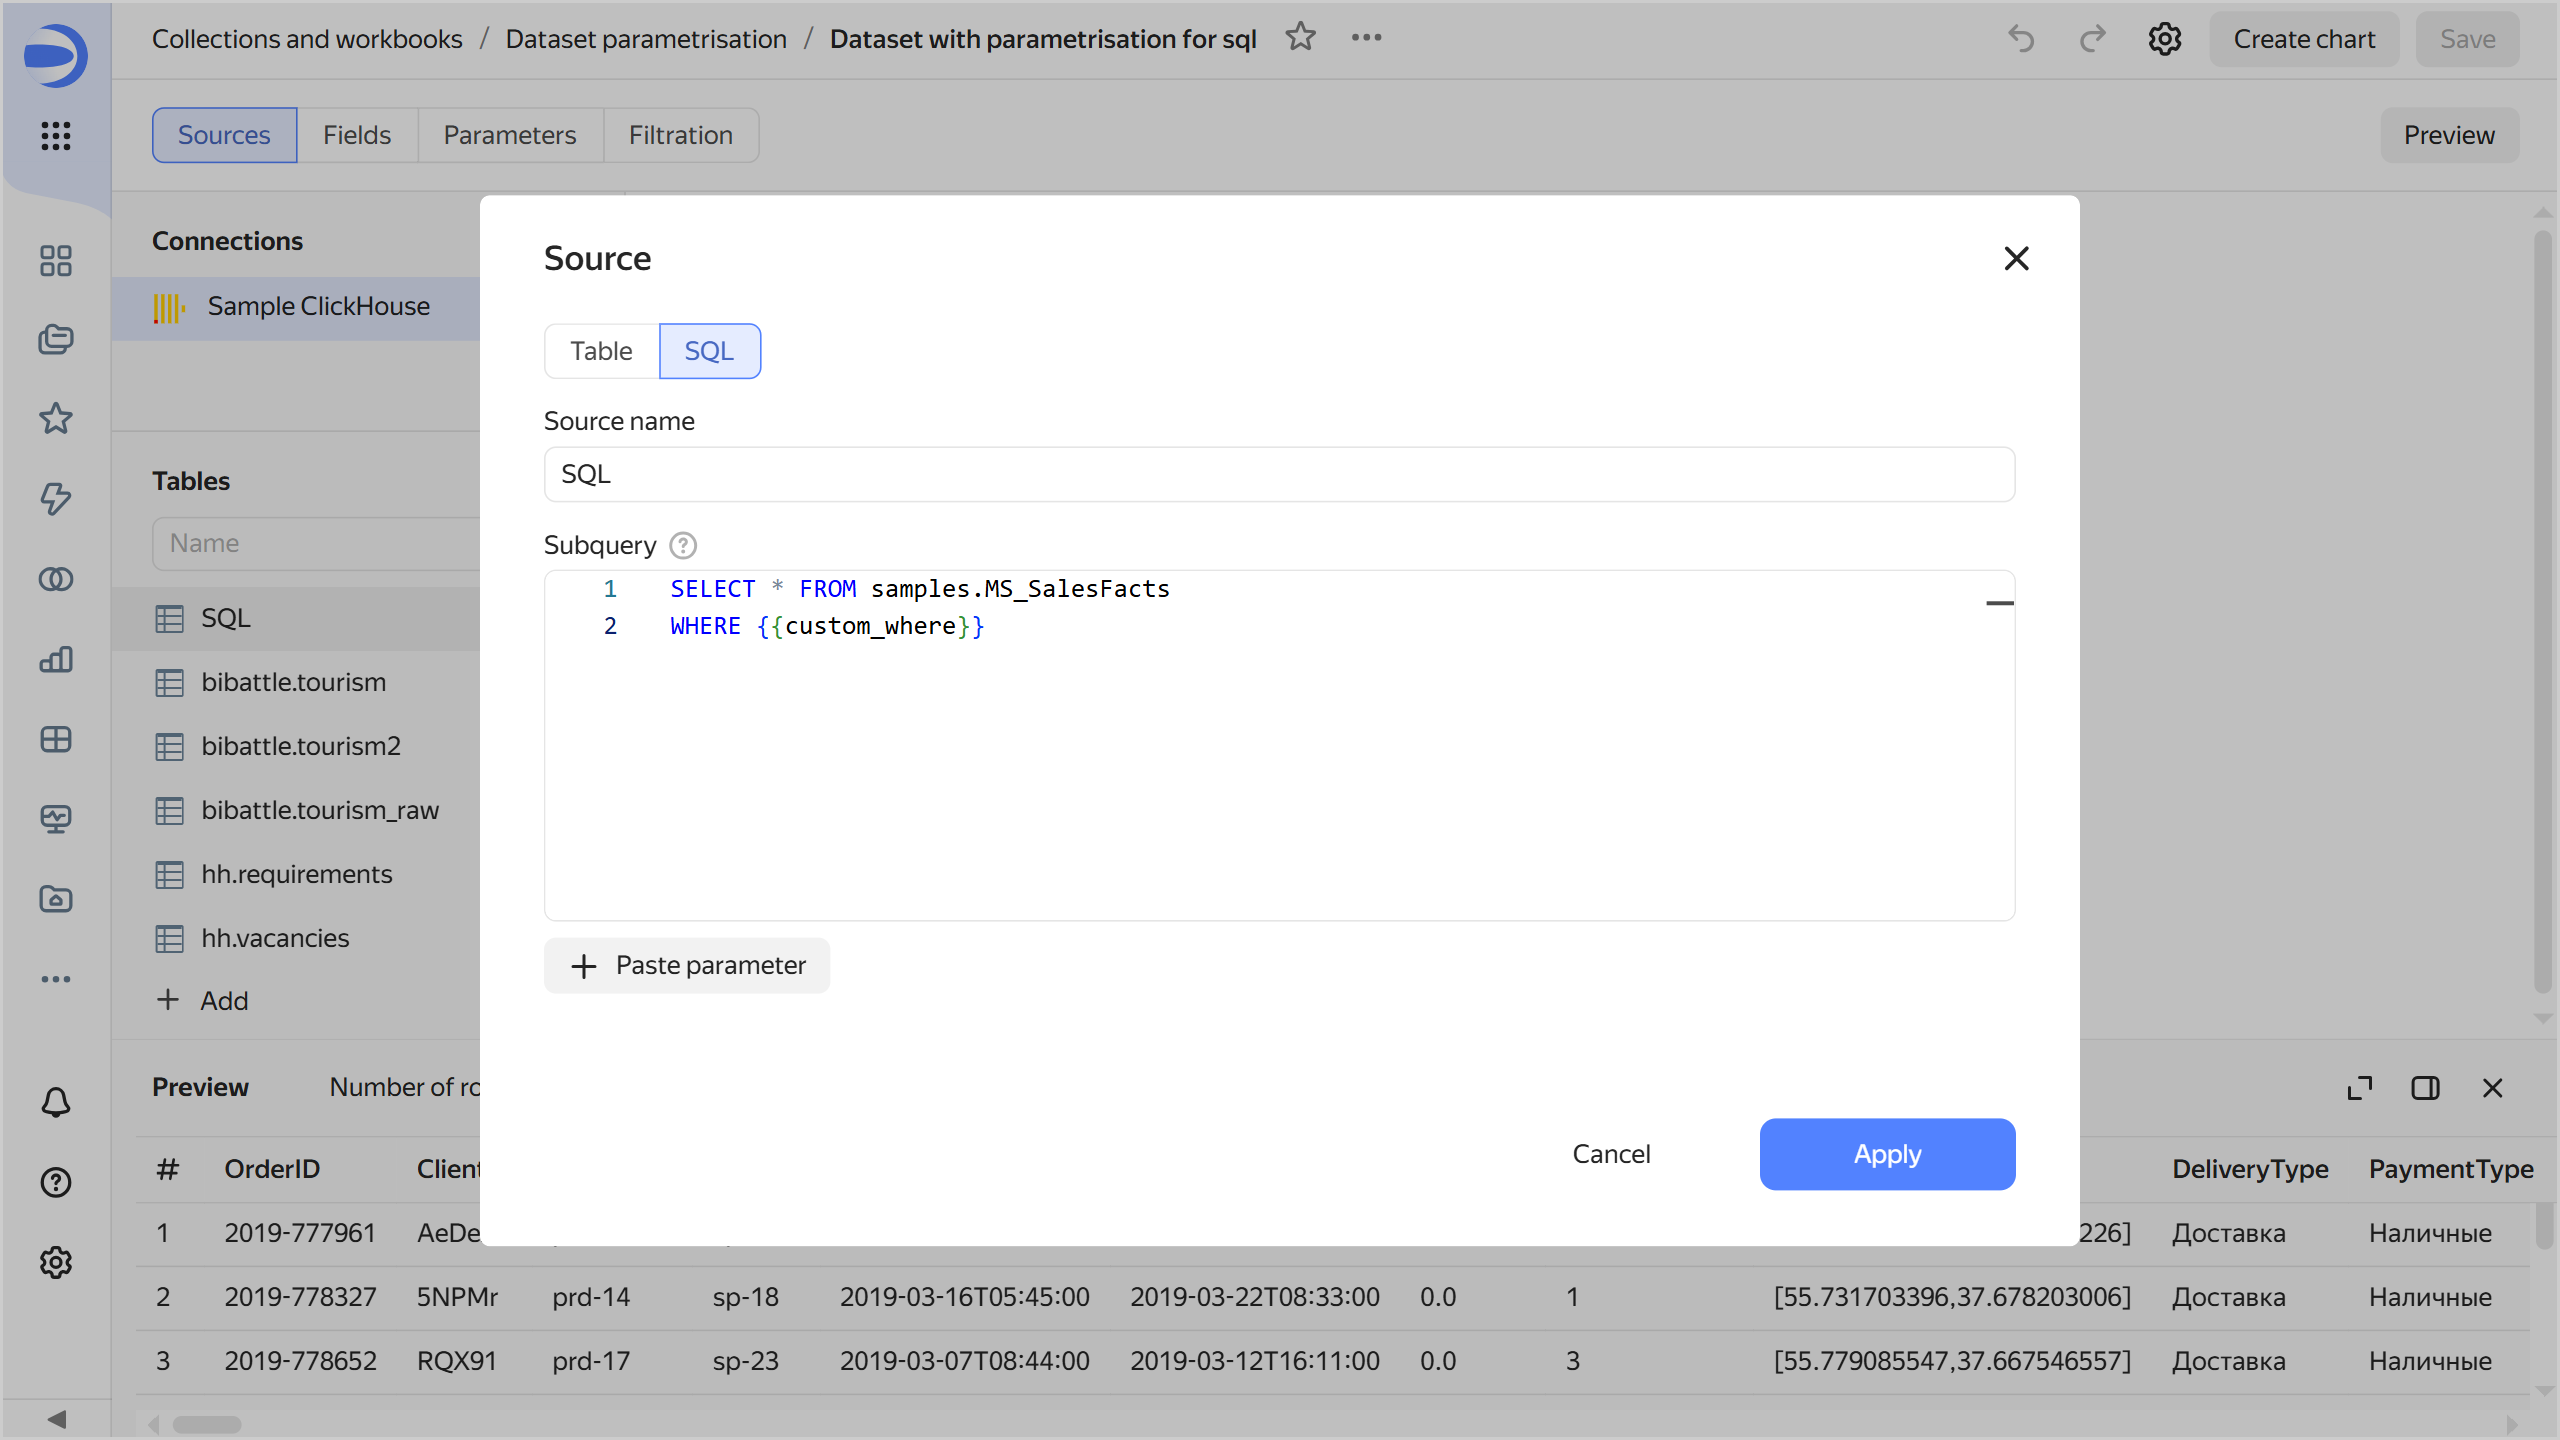
-
-
Save the dataset.
Create a chart with a parameter for selecting a subquery condition
-
At the top of your dataset, click Create chart.
-
Select the Indicator visualization type.
-
Drag the
Salesfield from Dimensions to the Measure section. This will automatically apply aggregation to this field, making it a measure.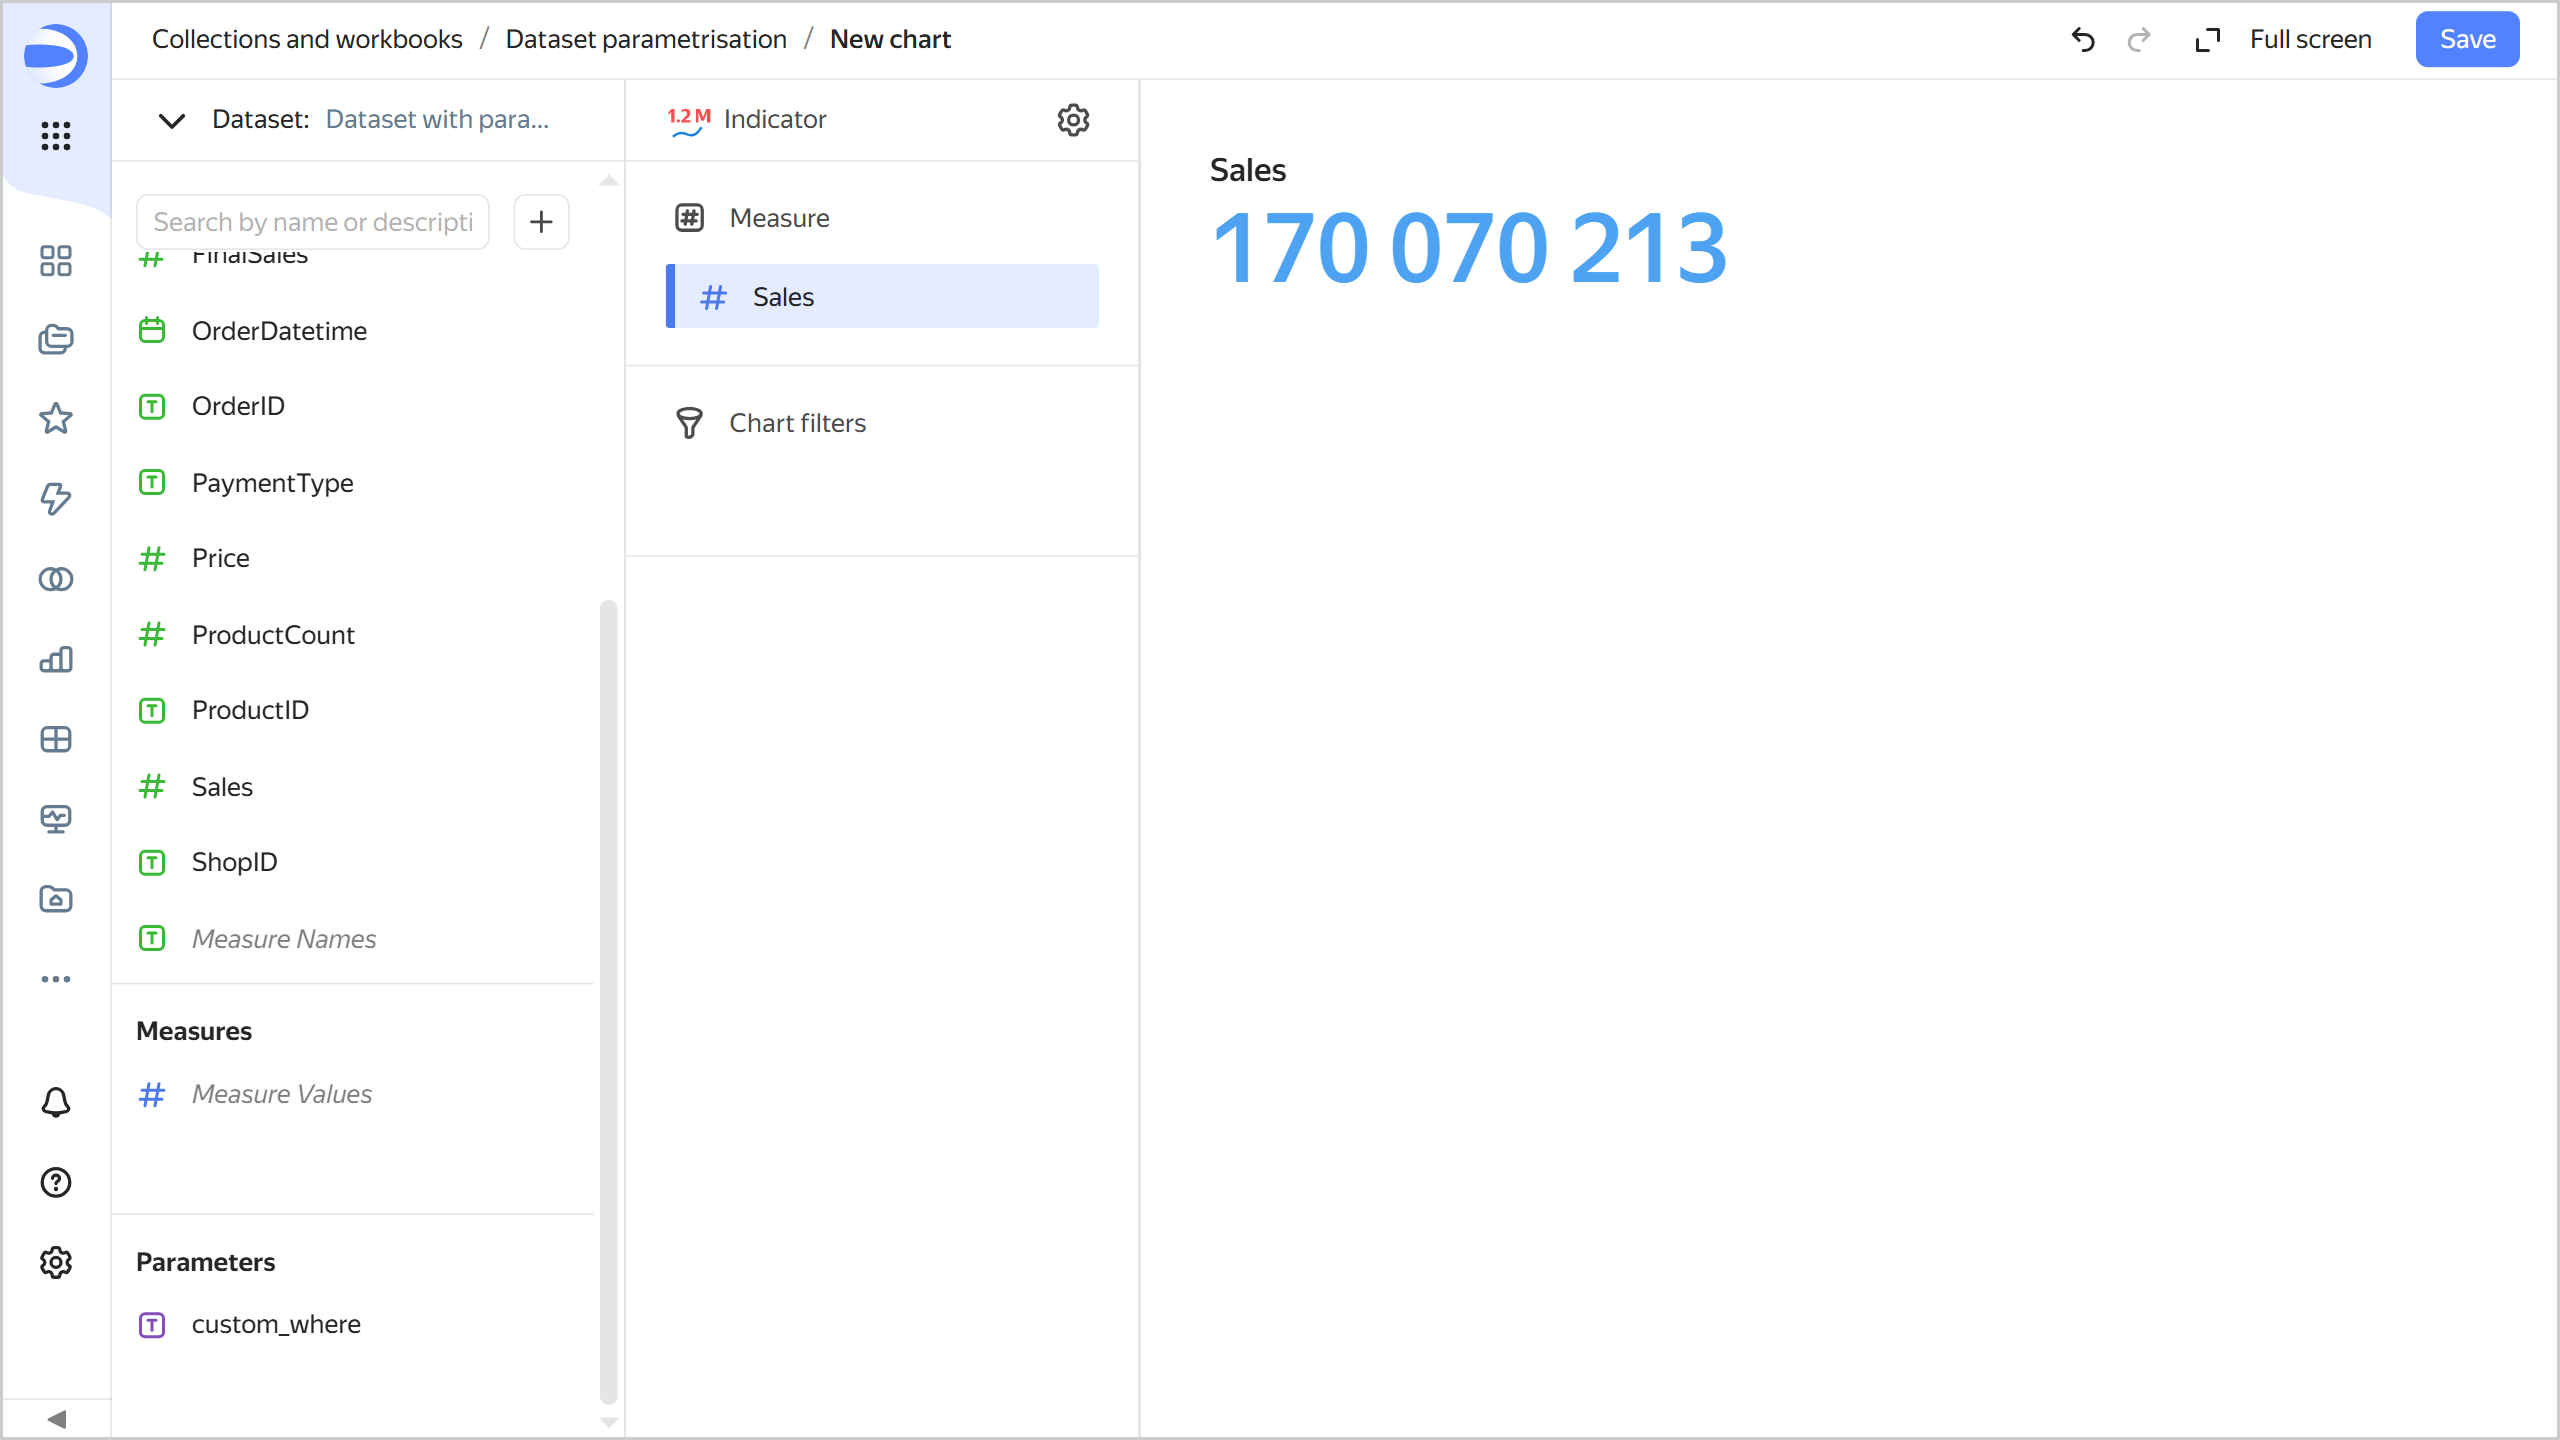
-
Open the chart inspector and make sure the SQL query uses the
1=1value of the dataset parameter.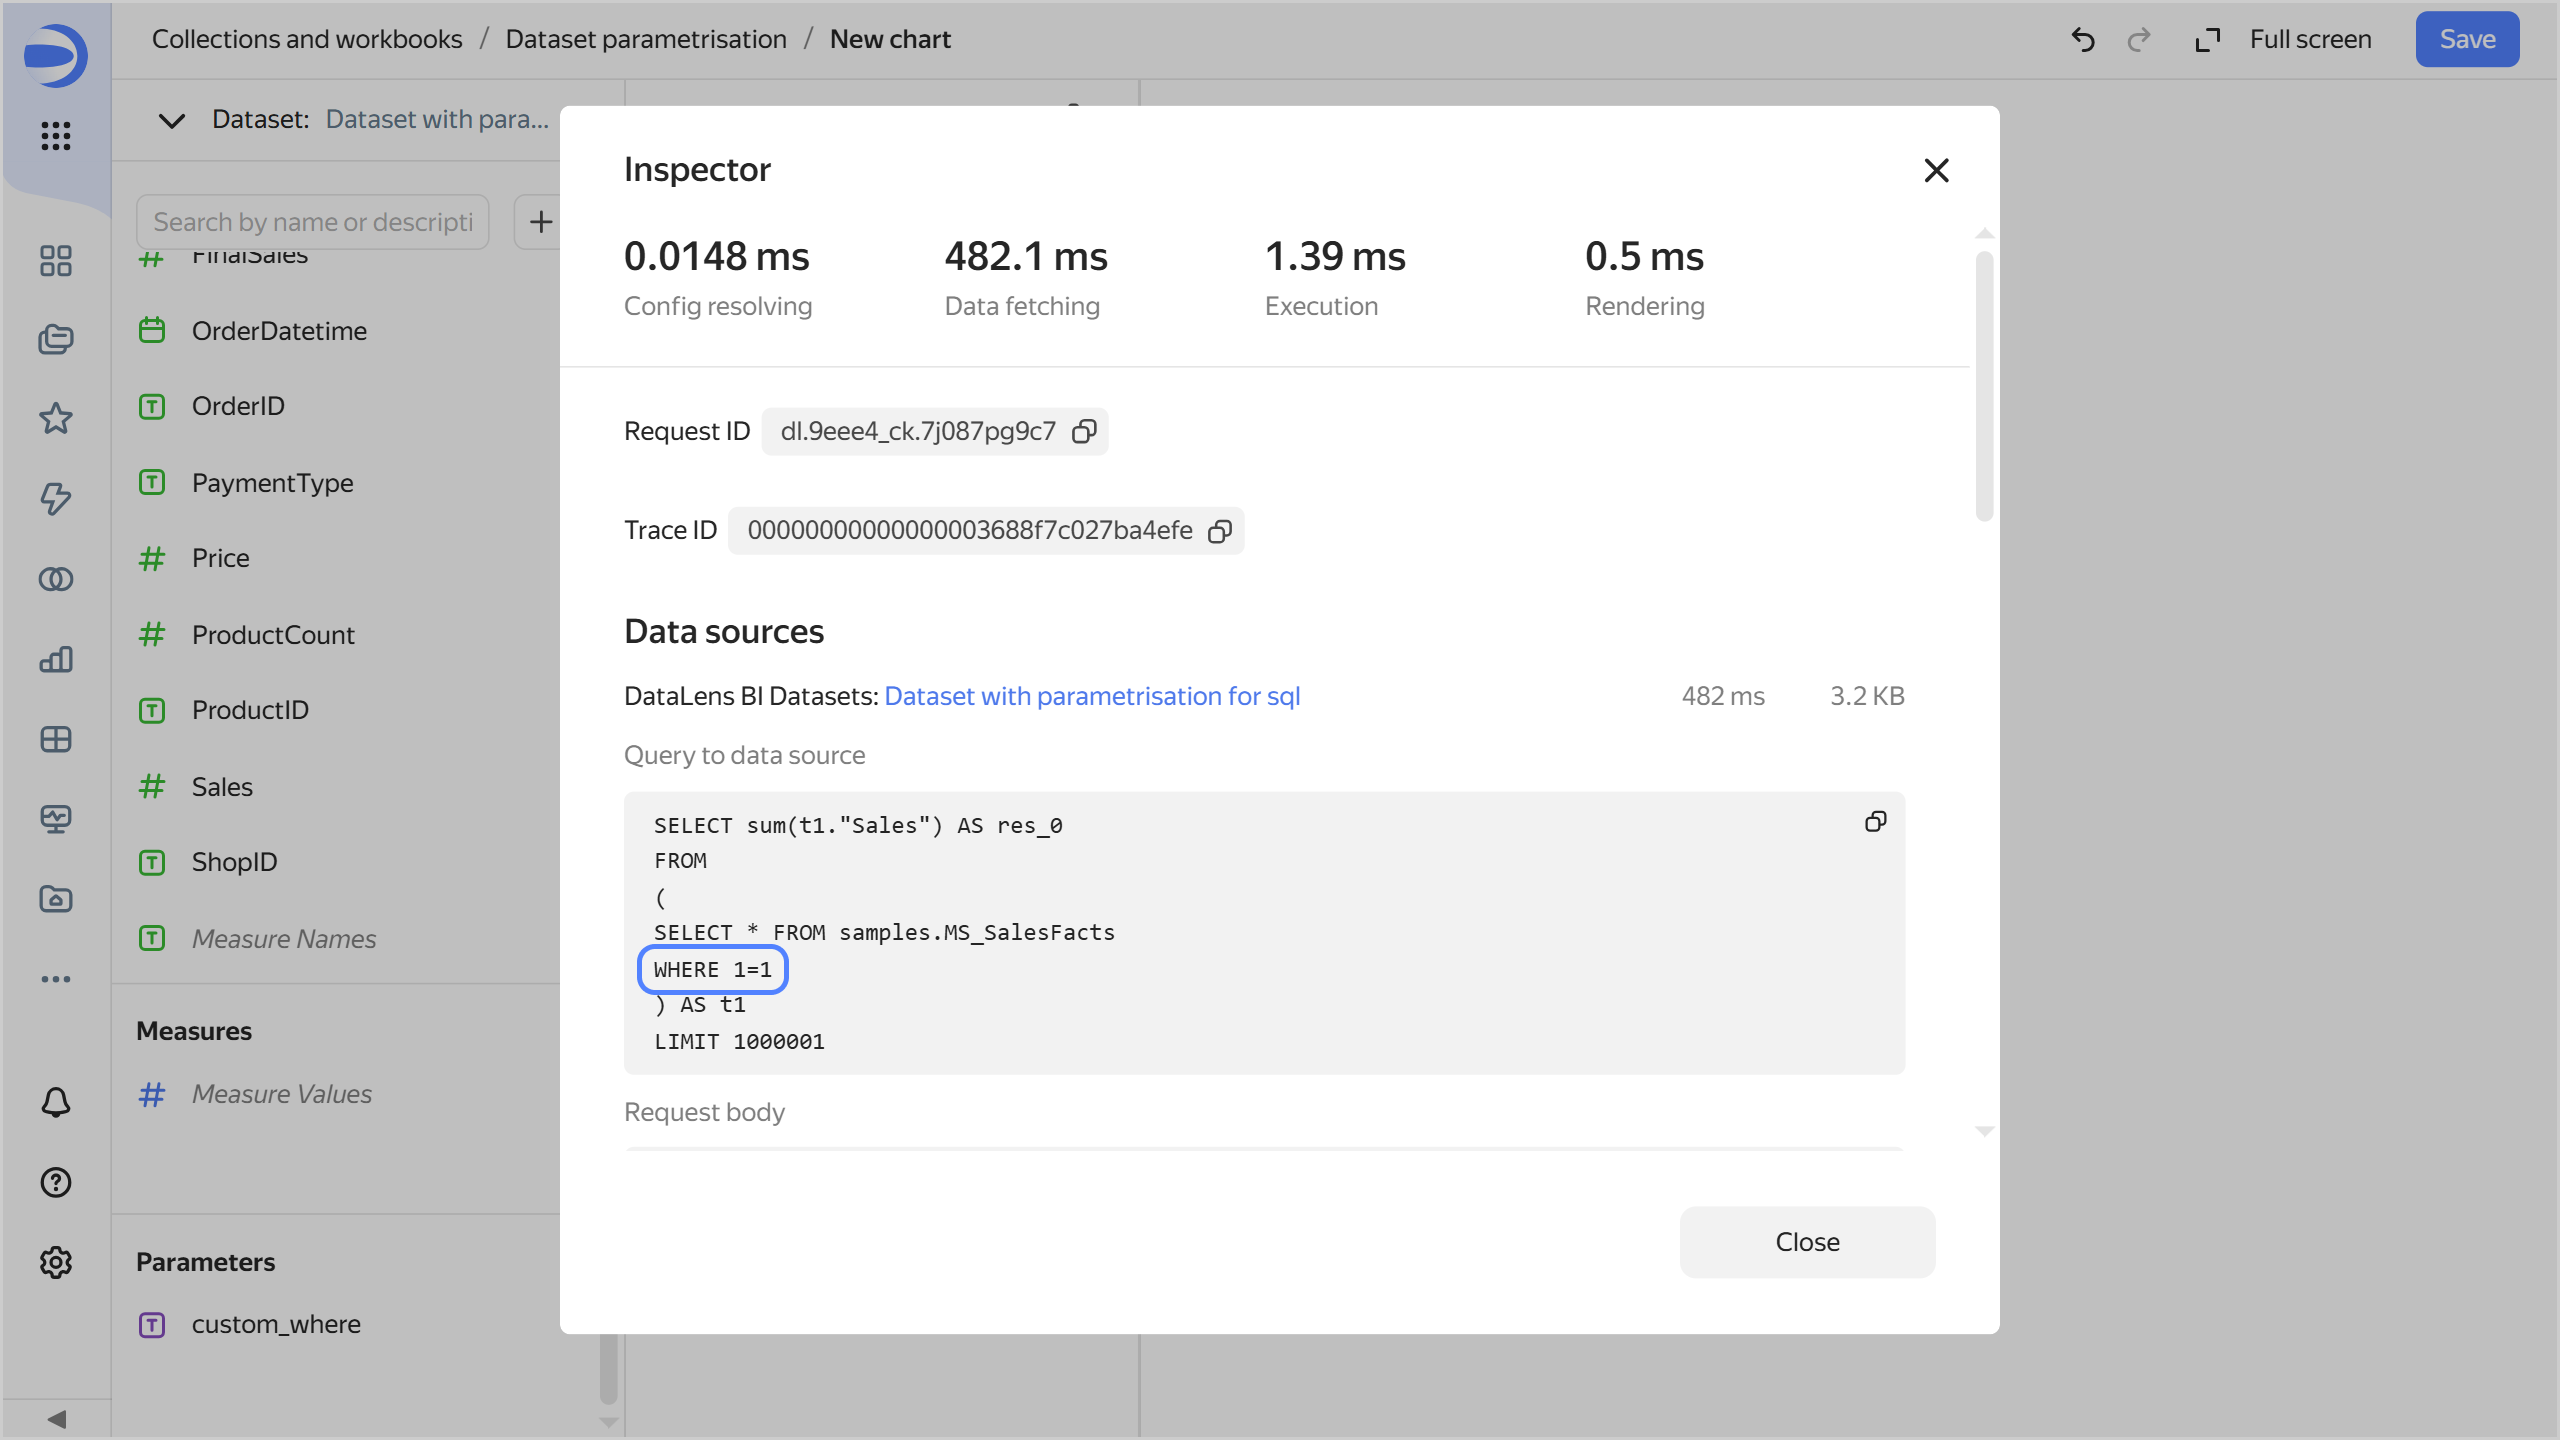
-
Change the SQL query condition in the parameter:
-
Under Parameters, click the icon next to
custom_where. -
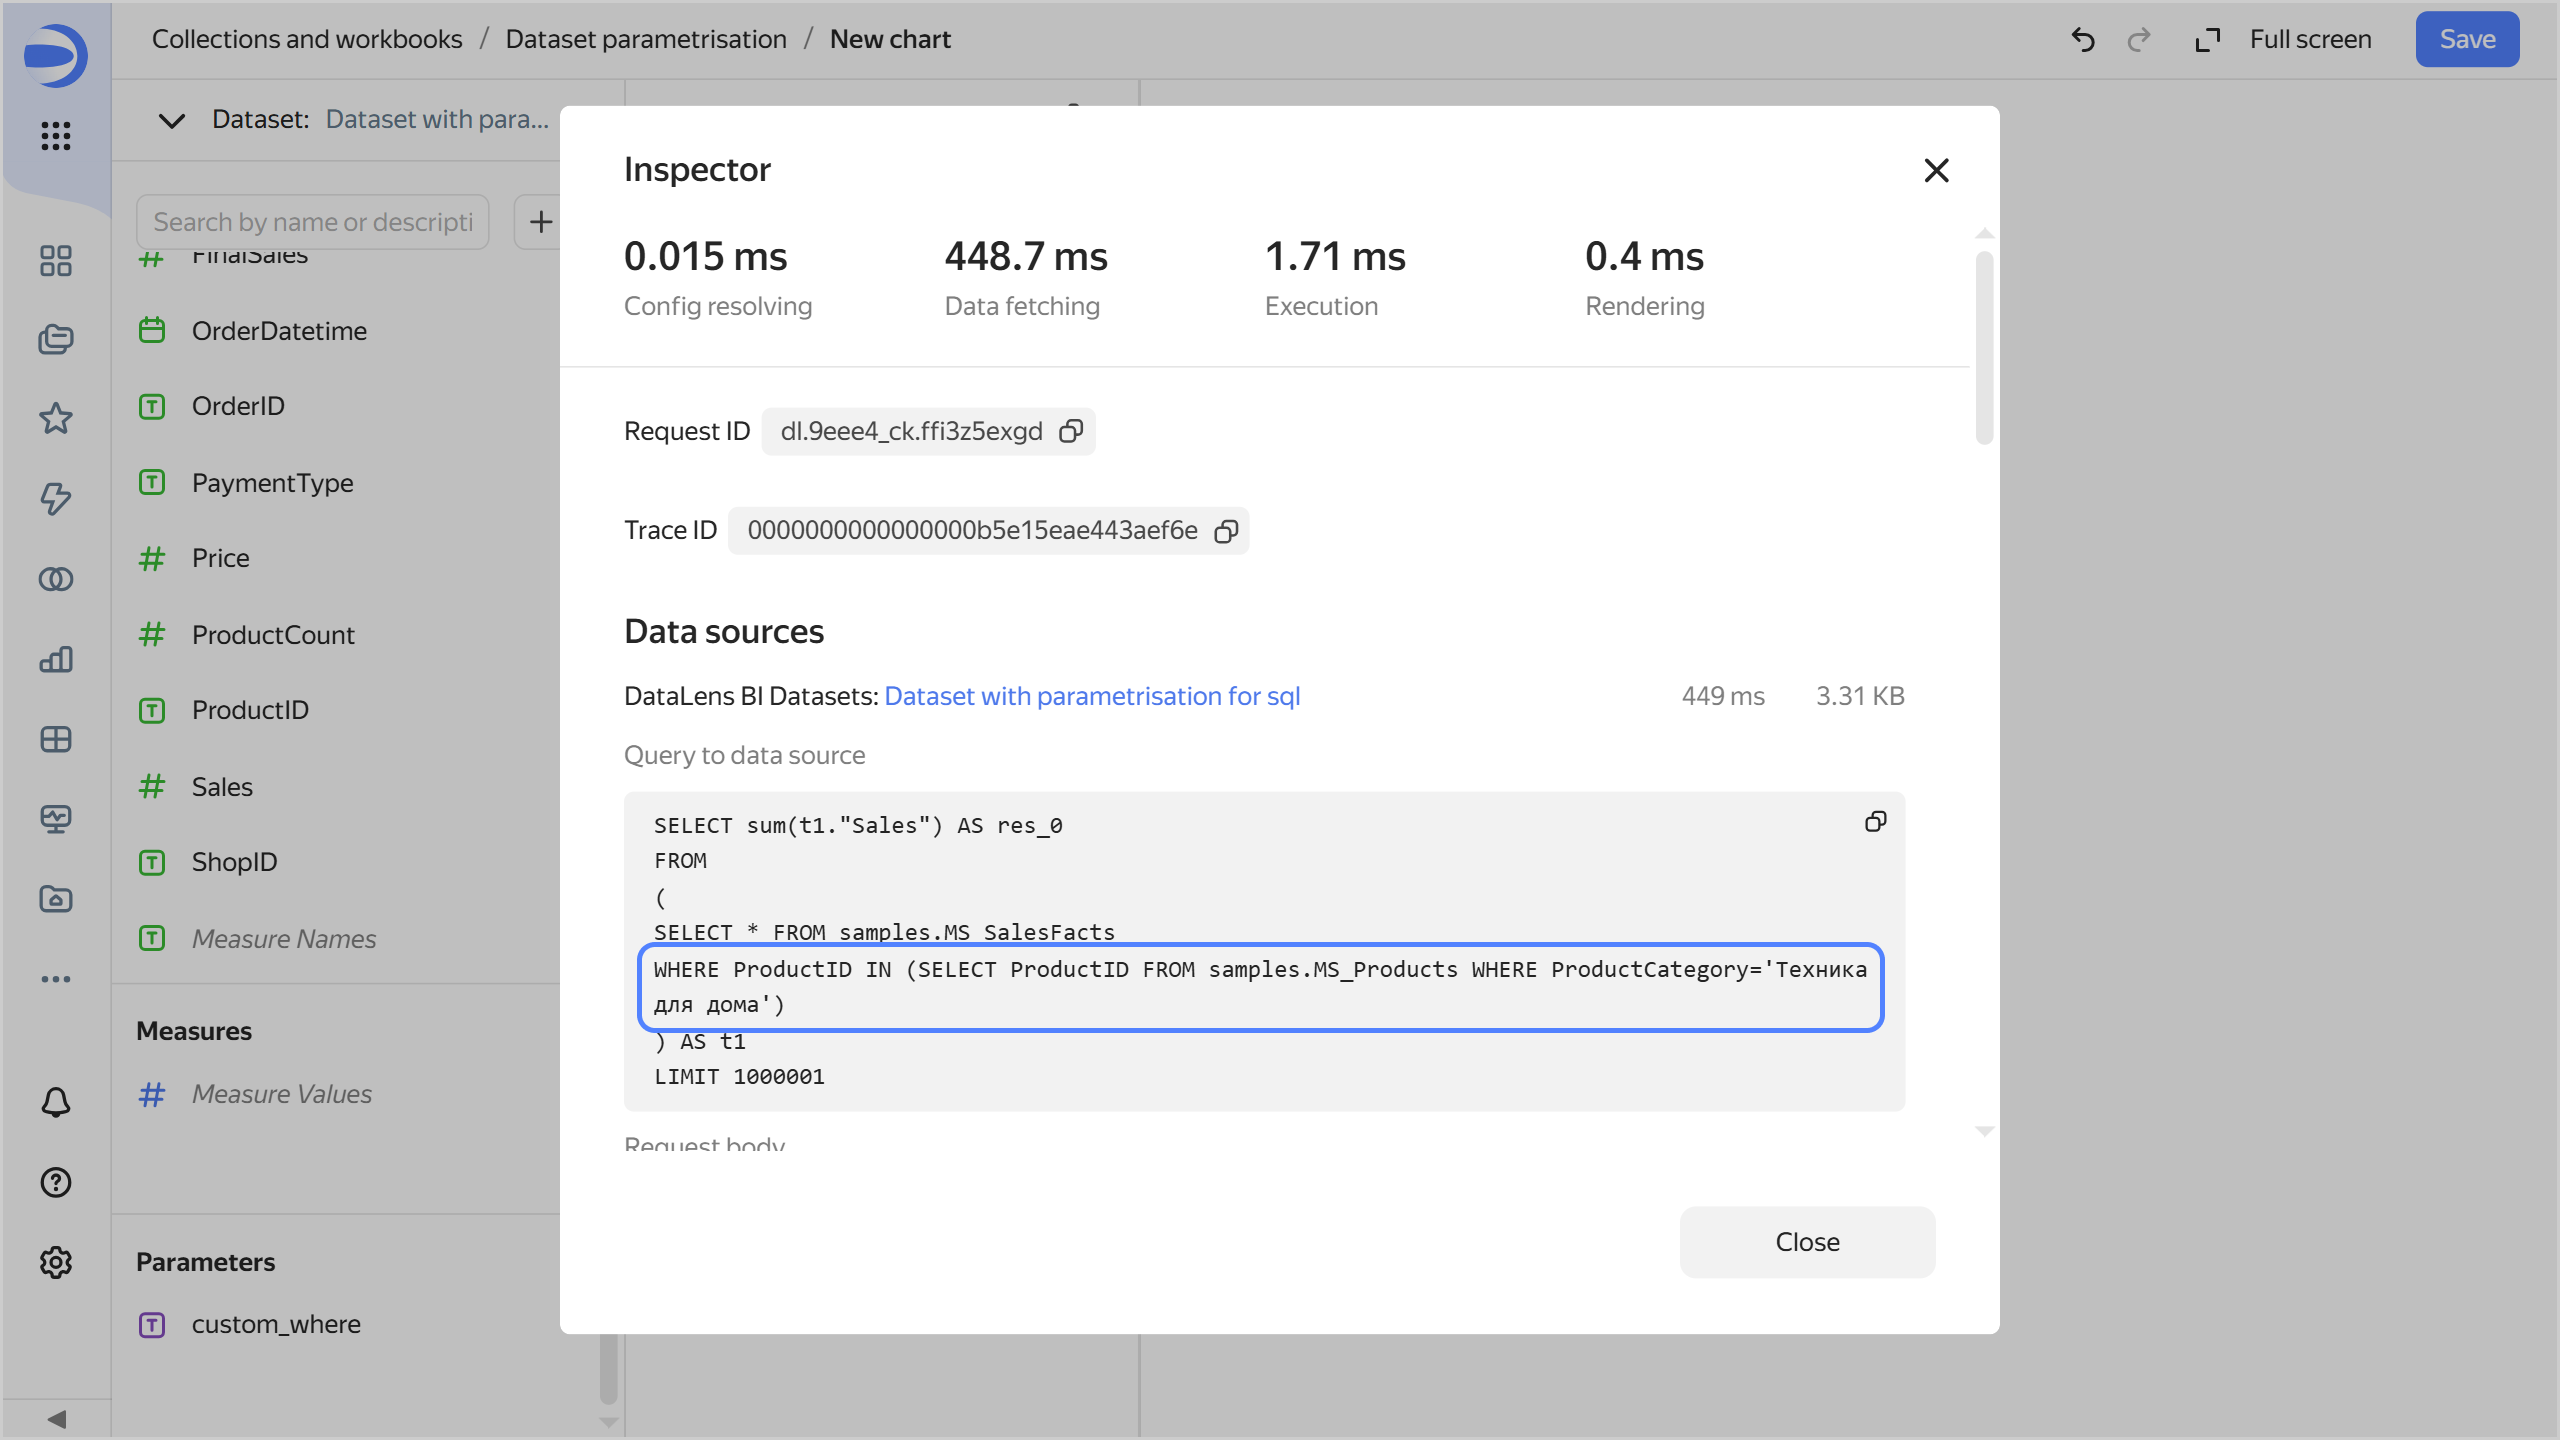
Set the default value to
ProductID IN (SELECT ProductID FROM samples.MS_Products WHERE ProductCategory='Home appliances'). -
Click Save. This will filter the chart data to only show products in the
Home appliancescategory.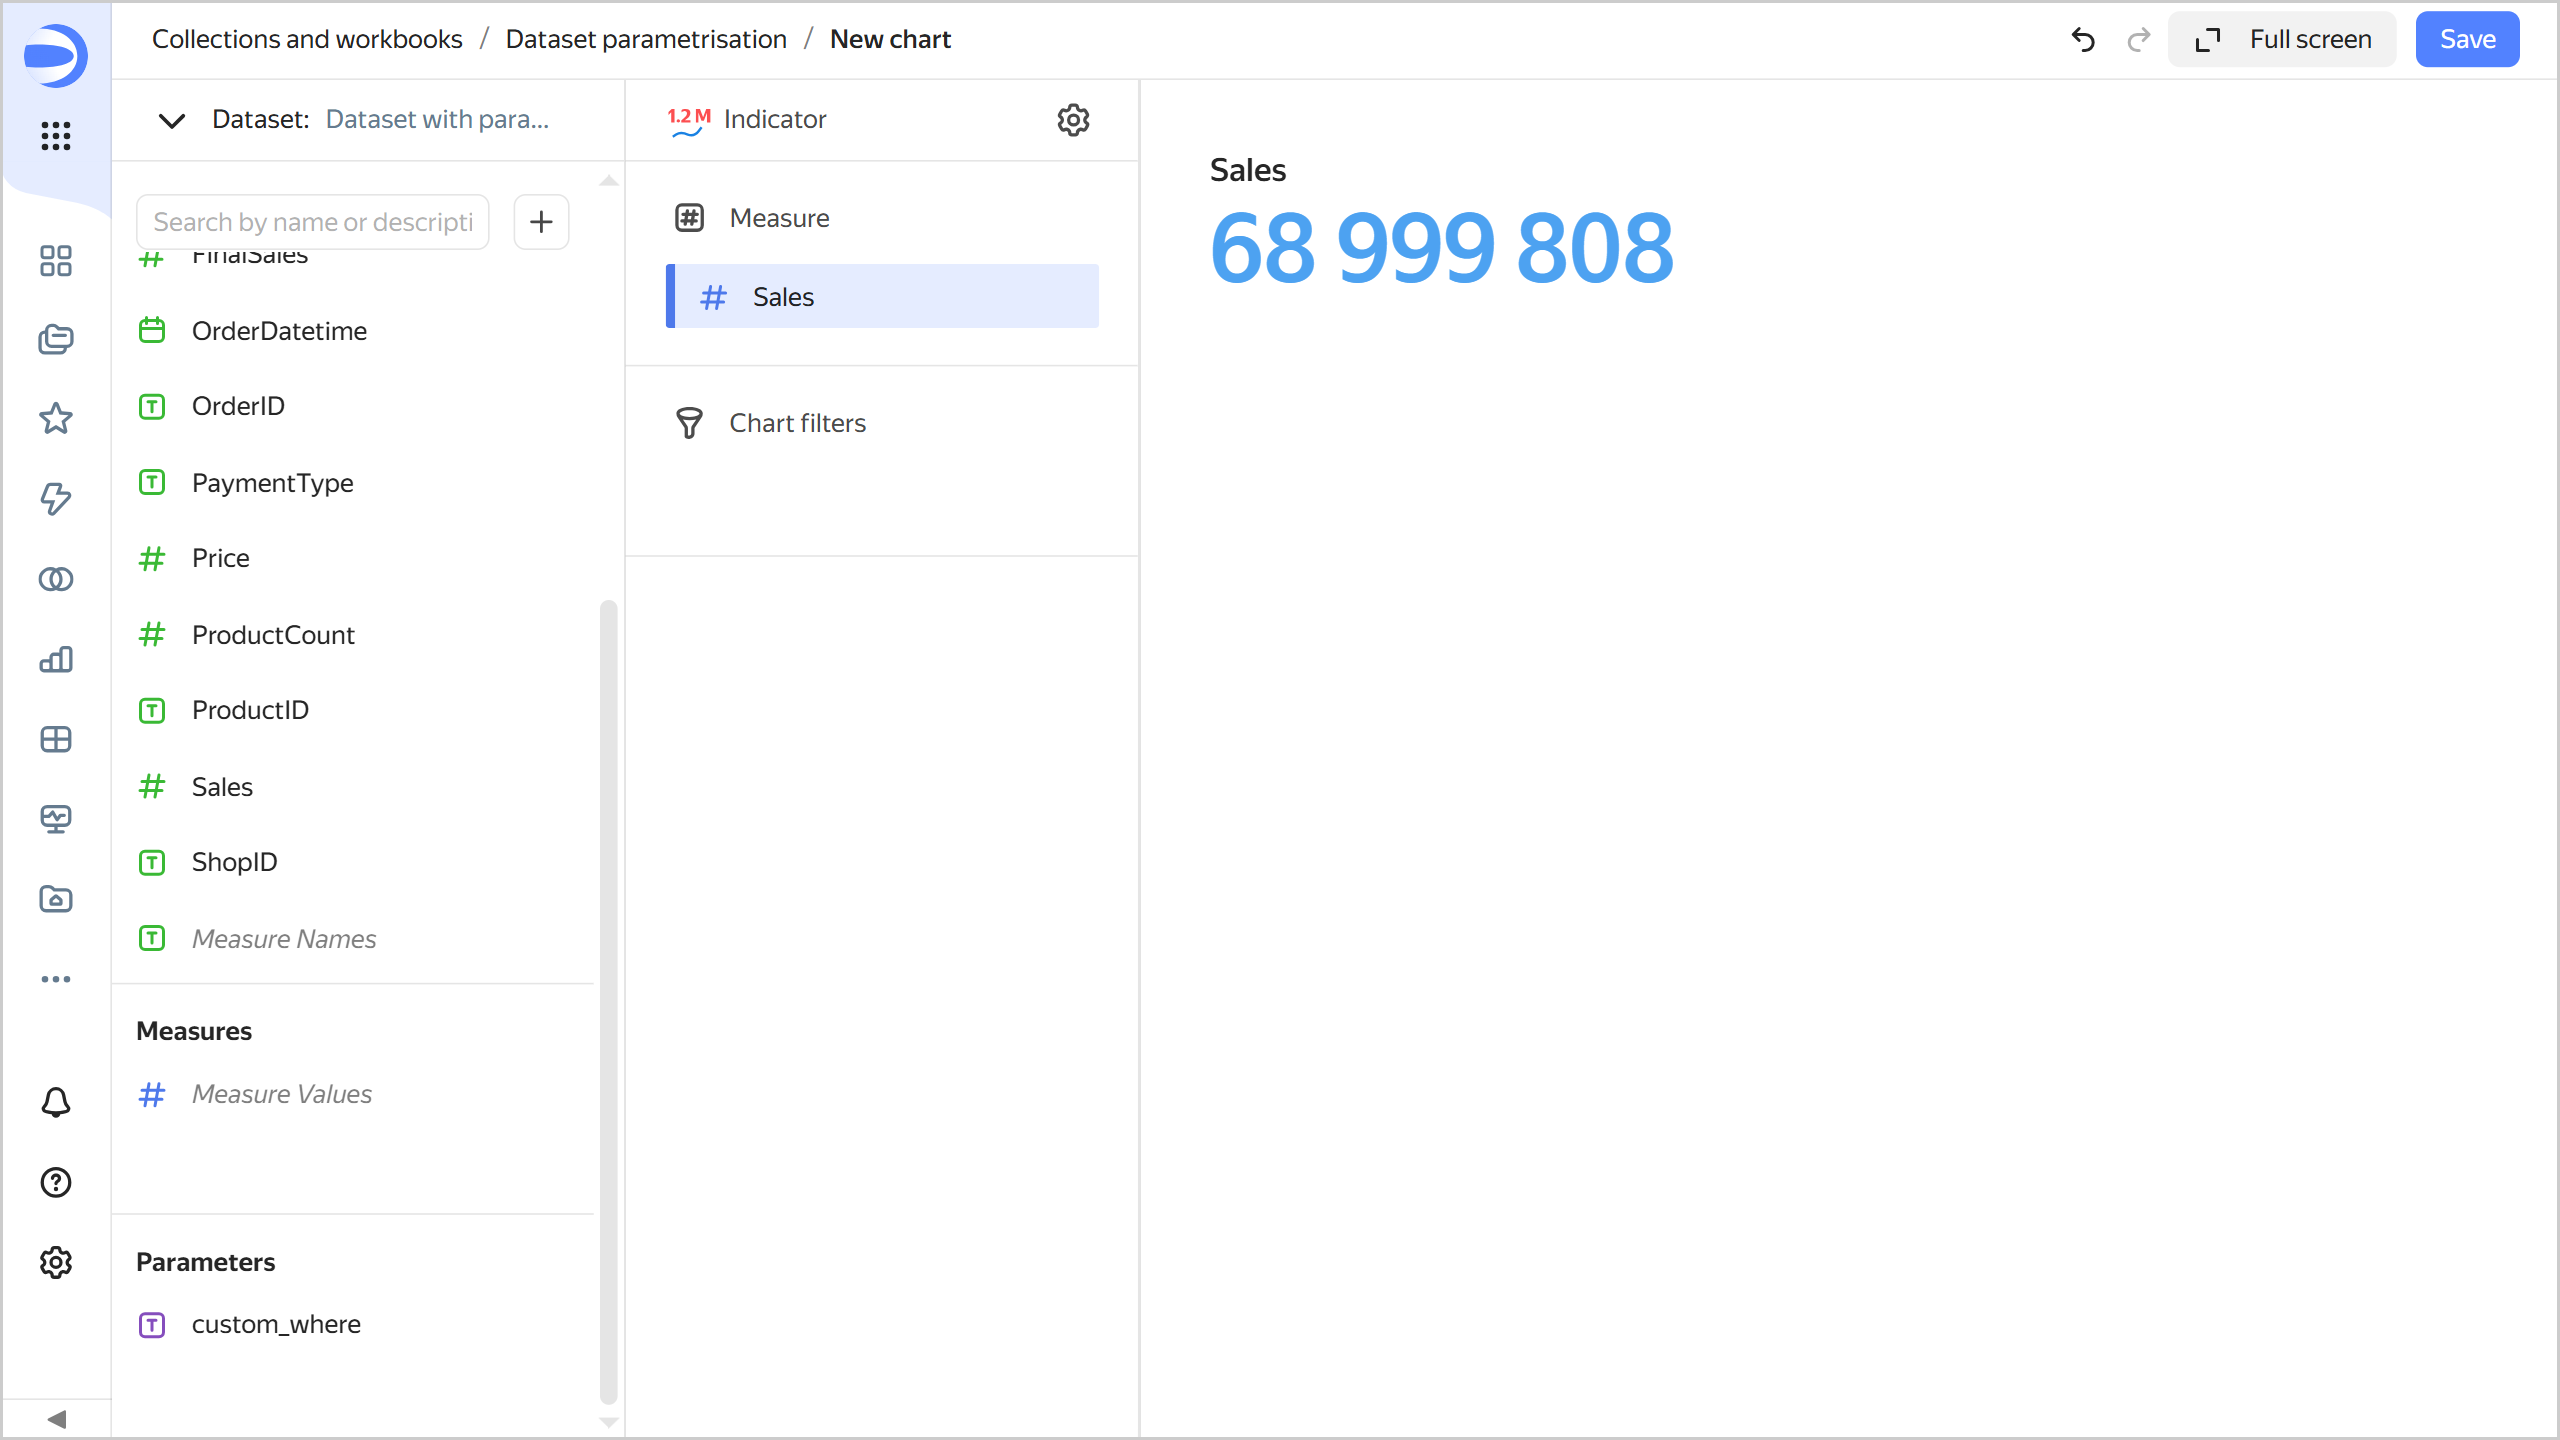
-
Open the chart inspector and make sure the SQL query now uses the new parameter value.
-
-
Save the chart:
- In the top-right corner, click Save.
- In the window that opens, enter
Chart with parametrisation sqlfor the chart name and click Save.
ClickHouse® is a registered trademark of ClickHouse, Inc.