LOD expressions and filtering management in aggregation functions in Yandex DataLens
By default, in DataLens, aggregate functions are calculated with grouping by the dimensions involved in the chart building (i.e., located in one of the chart sections). You can change the grouping for an aggregate function if you specify the level of detail. By managing it, you can add or exclude dimensions from grouping and use nested aggregations. For more information about how data aggregation and groupings work in DataLens, see Aggregations in Yandex DataLens.
As a data source, we will use a direct connection to a demo database; the dataset is based on the SampleSuperstore table.
Grouping in LOD expressions
Use the following keywords to specify the level of detail in LOD expressions (for details, see Syntax):
Keywords override the grouping set in the chart when calculating a specific aggregate function.
Warning
You can use dimensions in LOD expressions whether they are used in the chart or not. However, the top-level aggregation should only contain dimensions that are used in the chart (i.e., located in one of its sections).
FIXED
The FIXED keyword allows grouping based on explicitly listed dimensions. If you use FIXED without a list of dimensions, all data will be aggregated into a single group.
Example 1
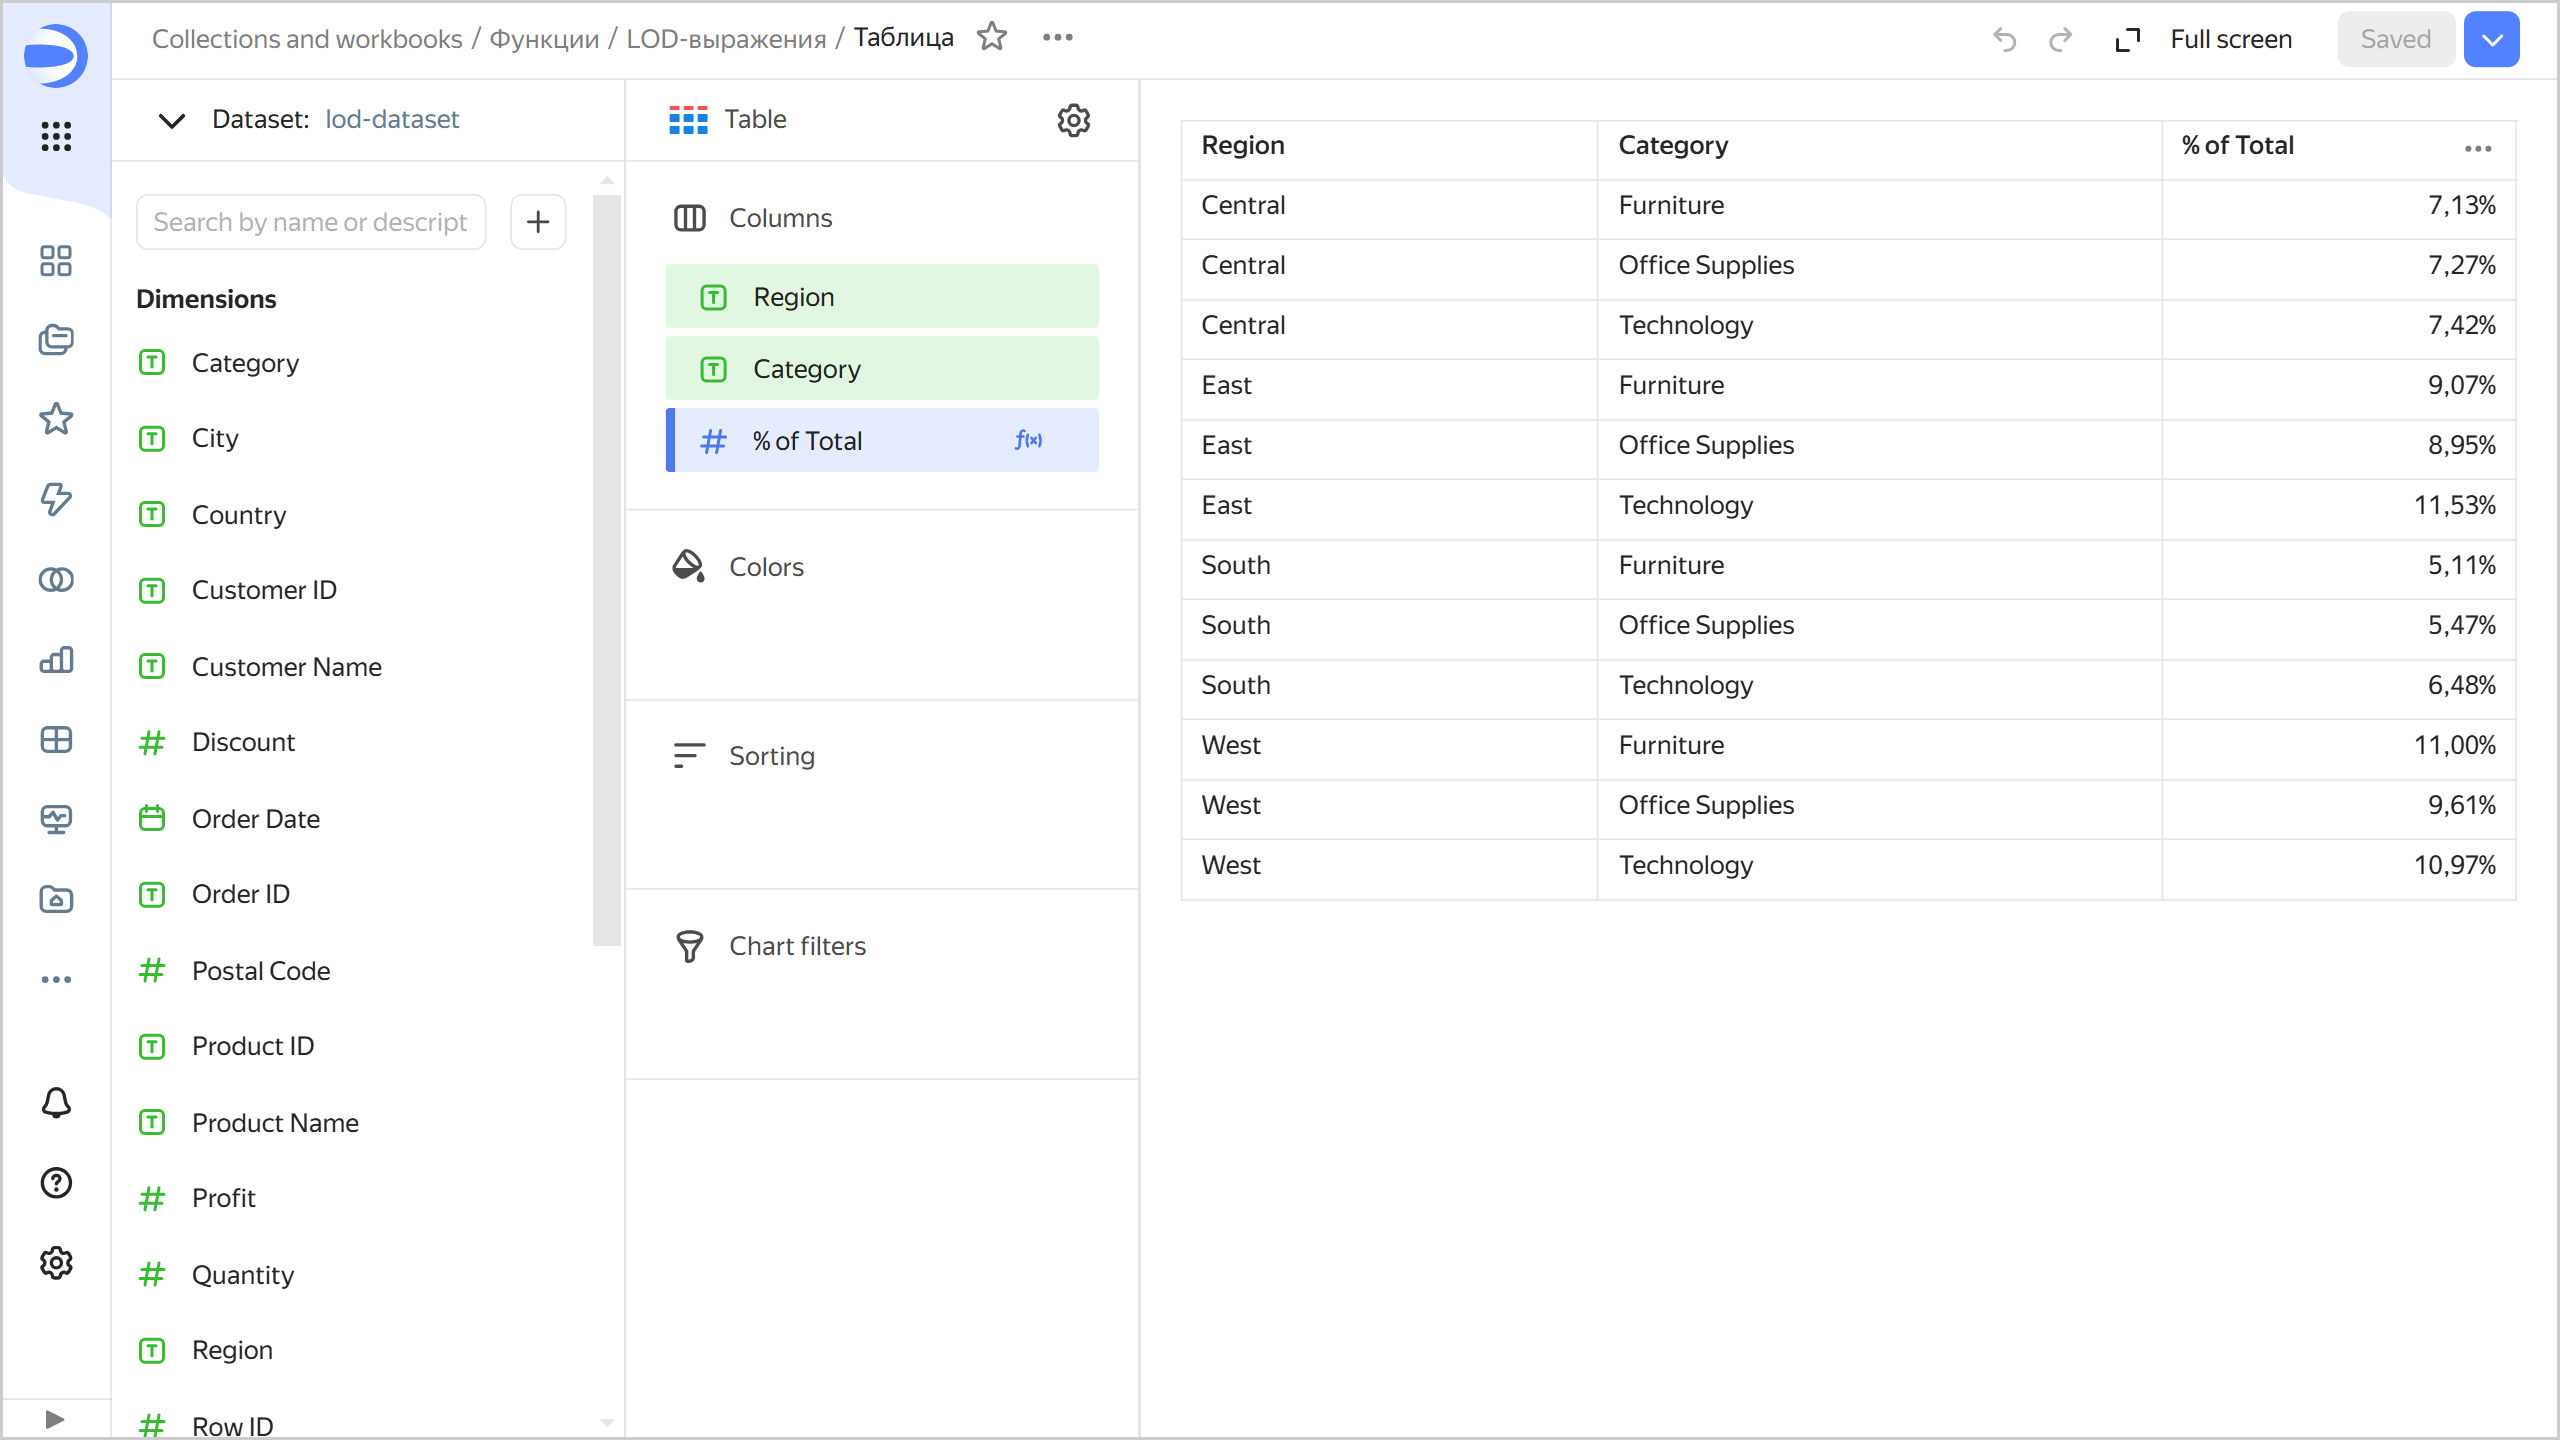
In a chart grouped by Region and Category, we need to calculate the percent of total sales for each category in the region (% of Total).
Let's create a measure calculated as SUM([Sales]) / SUM([Sales] FIXED), where:
SUM([Sales]): Sales per category in the city (uses the chart's default grouping).SUM([Sales] FIXED): Total sales (uses grouping without dimensions).
For the Table chart, the result will look like this:
Example 2
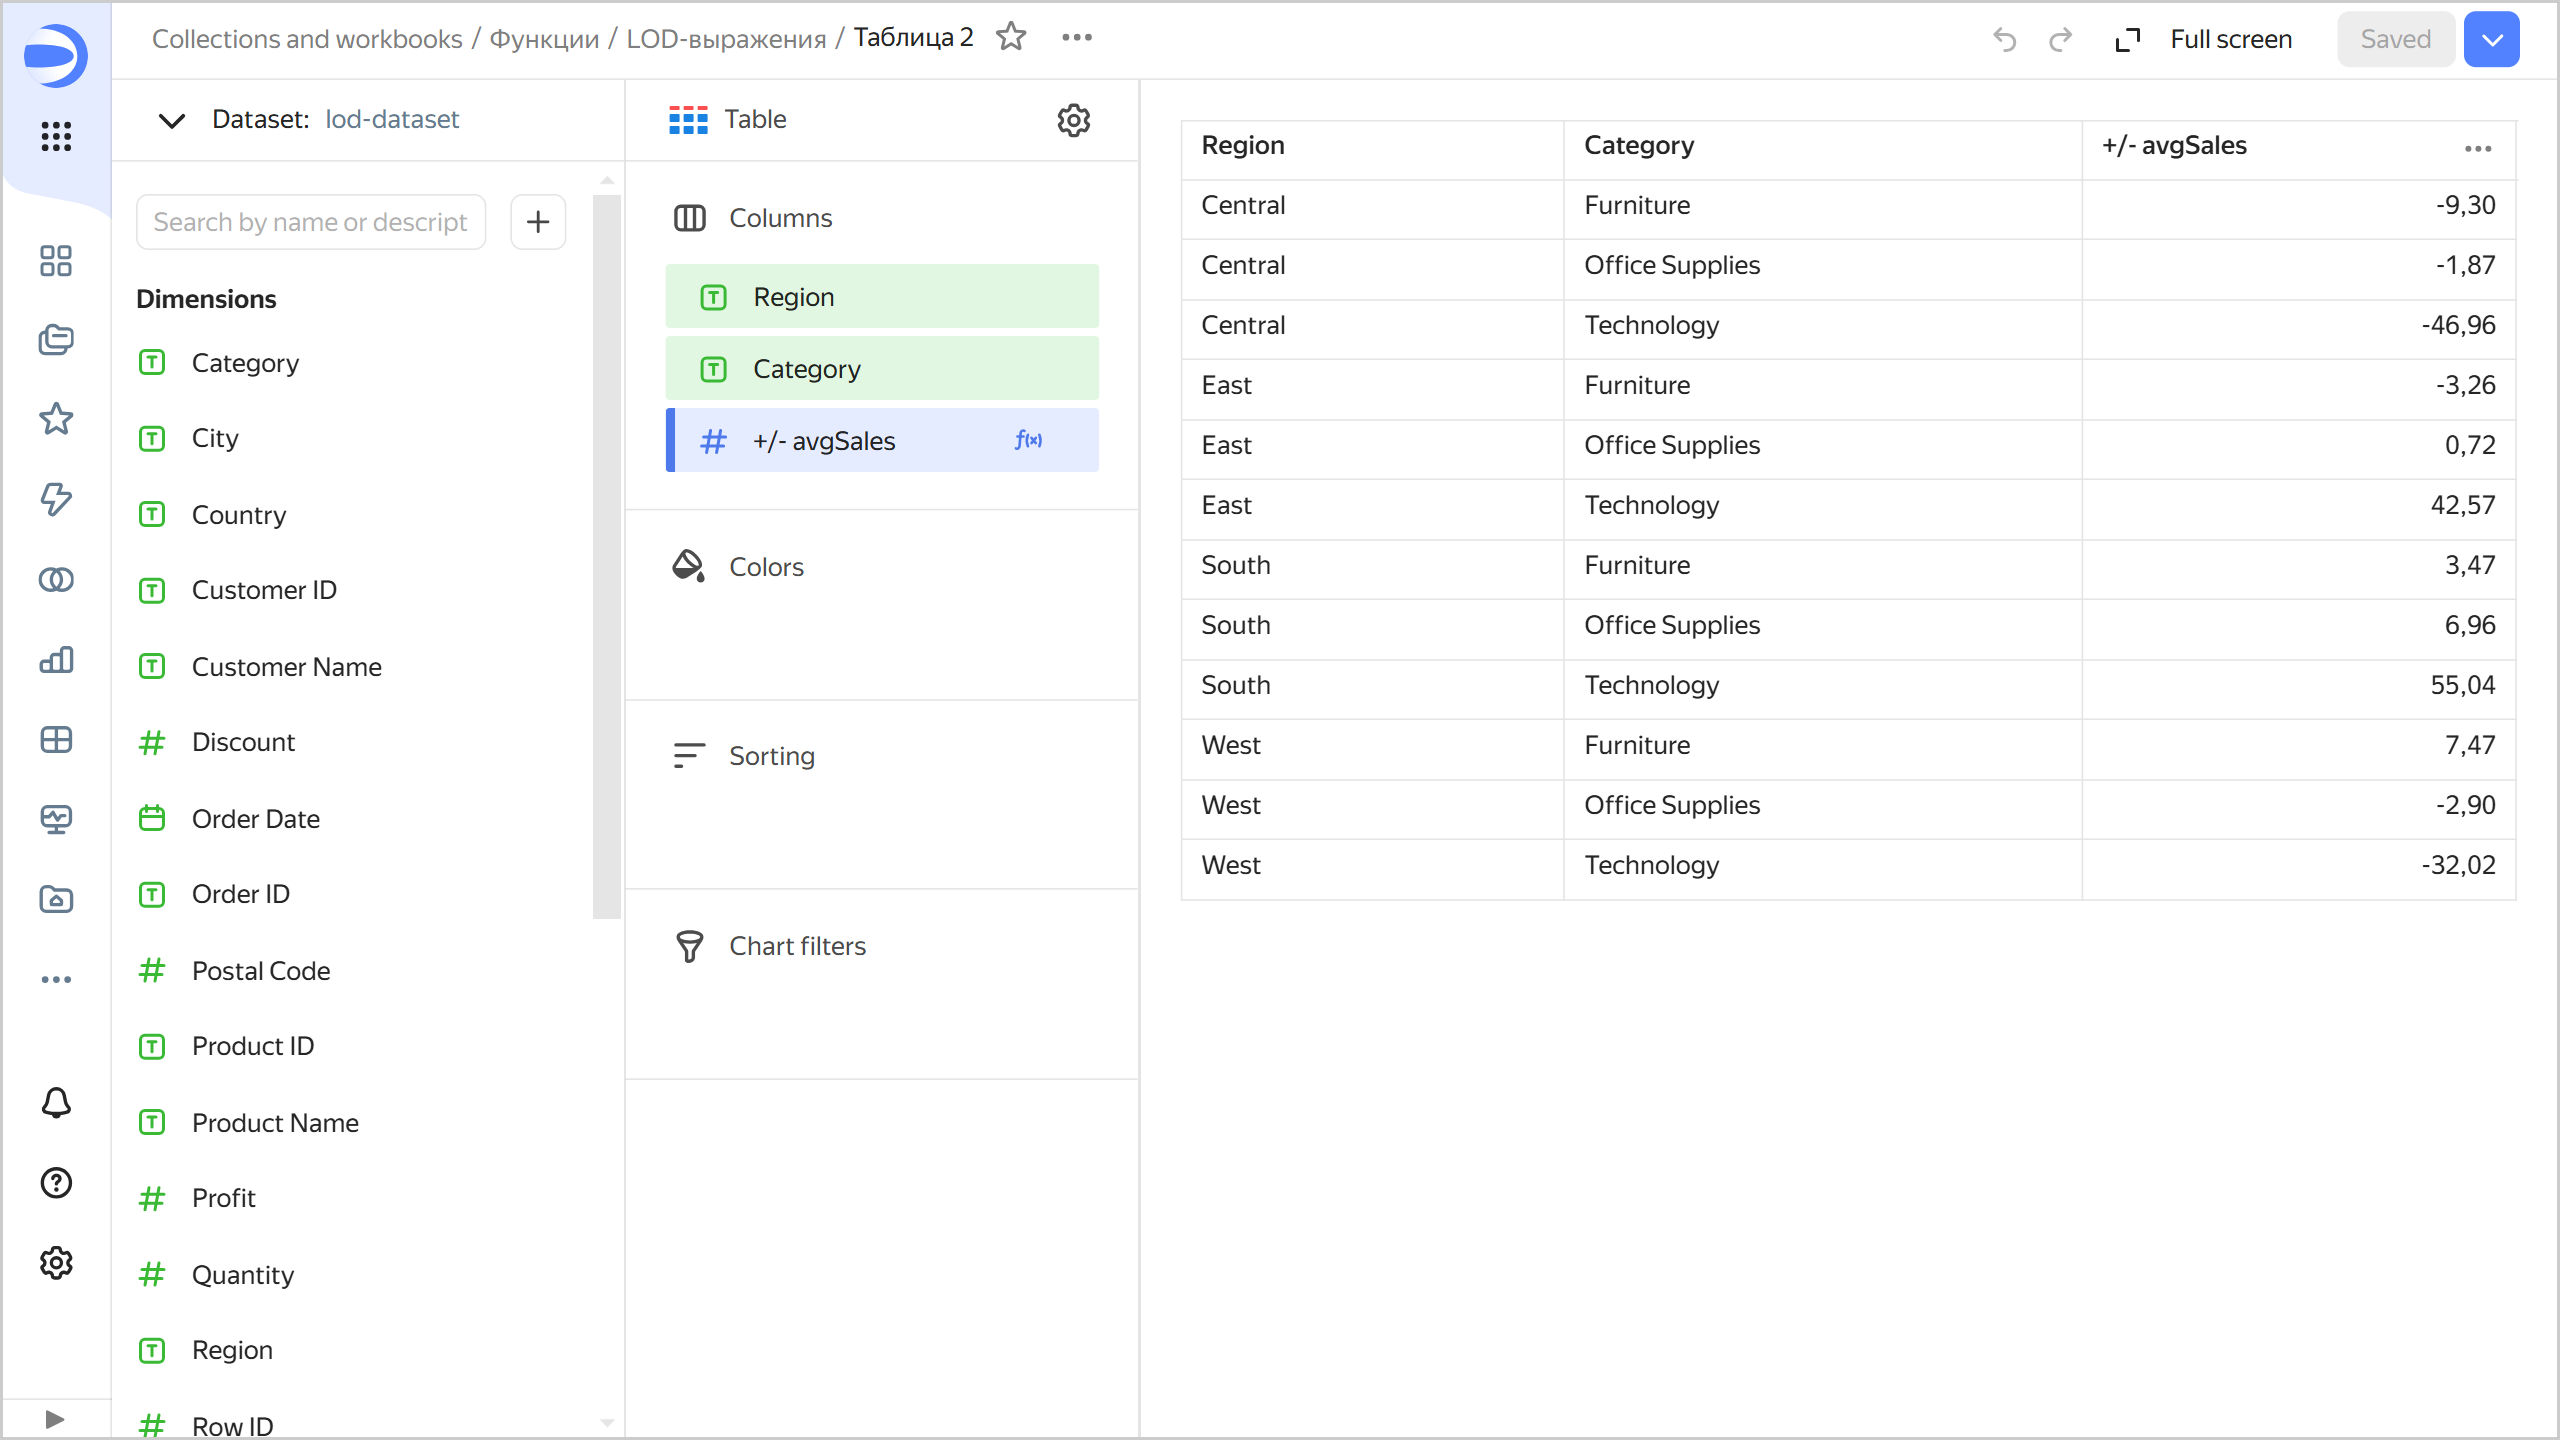
For each product category in the same chart, we are going to calculate how much the region's average sales deviate from average sales across all regions (+/- avgSales).
Let's create a AVG([Sales]) - AVG([Sales] FIXED [Category]) measure, where:
AVG([Sales]): Region's average sales by category (uses the chart's default grouping by the[Region]and[Category]dimensions).AVG([Sales] FIXED [Category]): Average sales by category across all regions (uses grouping by the[Category]dimension).
For the Table 2 chart, the result will look like this:
INCLUDE
Use the INCLUDE keyword to add specified dimensions to the chart grouping. As a result, the level of detail will be greater when calculating the aggregate function.
Expressions with INCLUDE can be useful if you need to calculate a measure with a higher level of detail but present it less detailed in the chart. For example, you can calculate daily sales and then do the averaging.
If used with an empty list of dimensions, INCLUDE results in the same grouping as in the chart.
Example 1
Let's calculate the maximum number of orders by region per date. We will use nested aggregation: first, we will count the number of orders per date, and then select the maximum value. Measure calculation formula: MAX(COUNTD([Order ID] INCLUDE [Region])).
Note
In this example, the [Region] dimension, which is missing in the chart, is added on the nested level. The top-level aggregation will thus be calculated grouped by the chart's [Order Date] dimension, and the nested aggregation will use grouping by the [Order Date] and [Region] dimensions.
For the Line chart, the result will look like this:
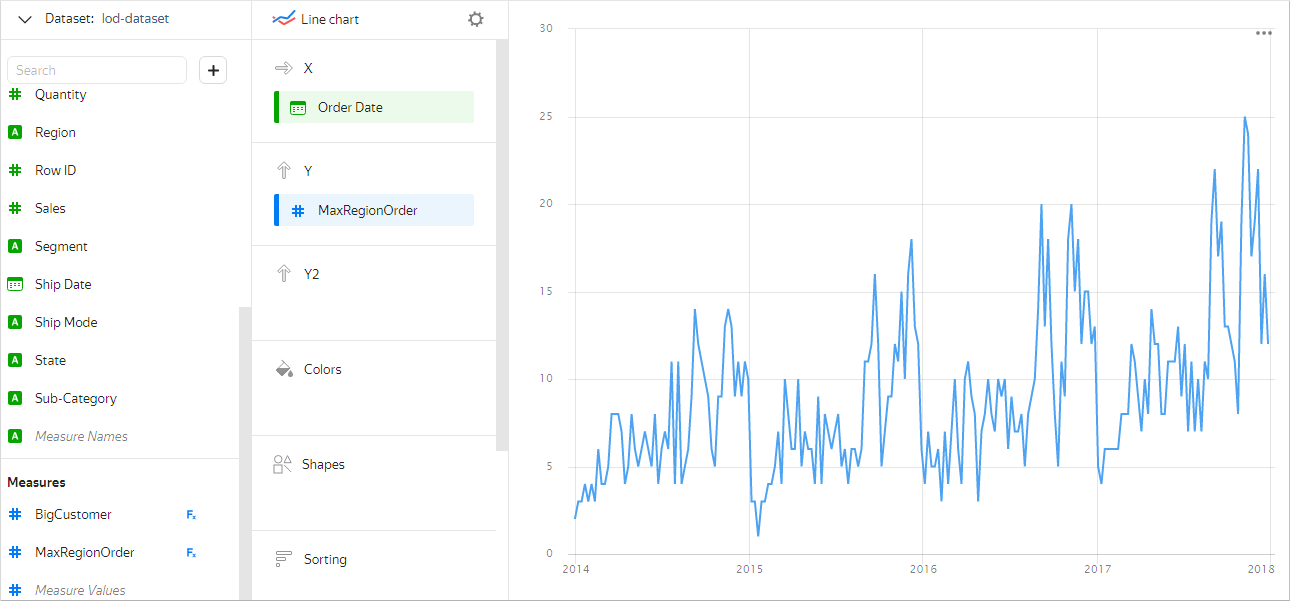
The chart uses only one dimension, [Order Date]. The order count is calculated with grouping by date and region because the [Region] dimension is added to the grouping for the COUNTD function.
Example 2
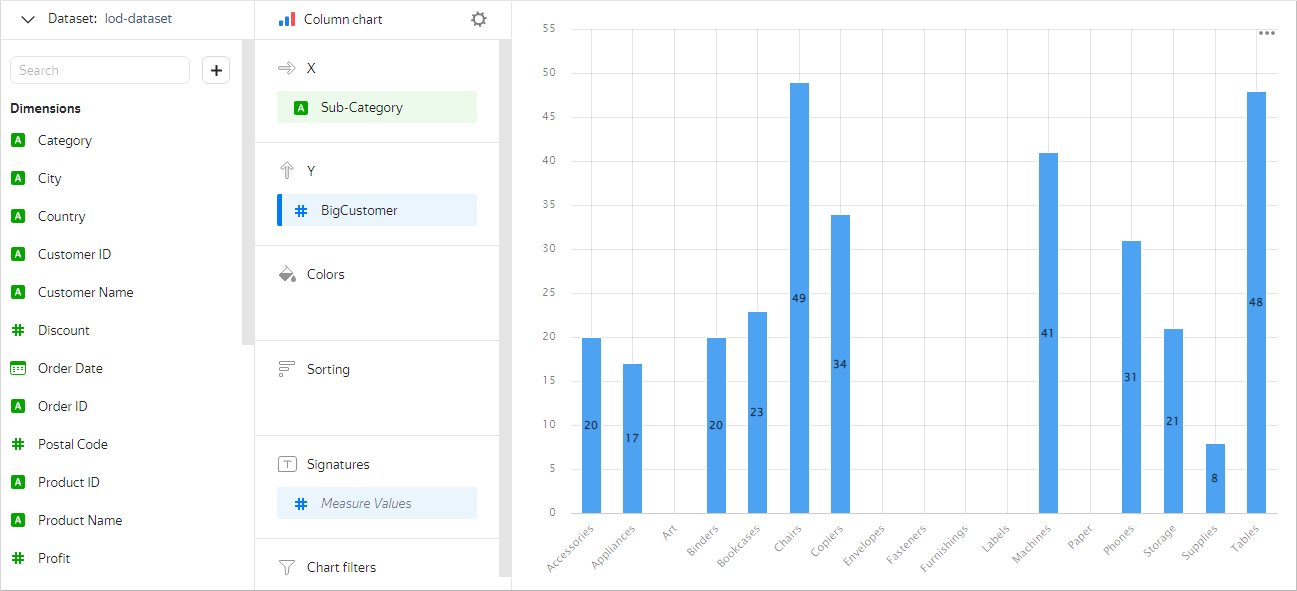
Let's calculate the number of customers with an average purchase amount over 1,000 for each product subcategory. To do this, we will create a measure using the COUNTD_IF function. The formula for the measure is COUNTD_IF(ANY([Customer ID] INCLUDE [Customer ID]), AVG([Sales] INCLUDE [Customer ID]) > 1000), where:
ANY([Customer ID] INCLUDE [Customer ID]): The[Customer ID]dimension is converted into a measure with the help of the ANY function.AVG([Sales] INCLUDE [Customer ID]) > 1000: Average purchase amount is compared to the specified value.
For the Column chart, the result will look like this:
Any INCLUDE-based aggregation can be replaced with a FIXED-based one. For example, in a chart grouped by the Region and Category dimensions, the SUM(SUM([Sales] INCLUDE [City])) measure will be the same as SUM(SUM([Sales] FIXED [Region],[Category],[City])).
EXCLUDE
Use the EXCLUDE keyword to exclude specified dimensions from the chart grouping. As a result, the value of the aggregate function is calculated with grouping by all dimensions of the chart, except those listed.
For example, EXCLUDE expressions can be used to calculate the percentage of the total number or the difference from the total average.
If used with an empty list of dimensions, EXCLUDE results in the same grouping as in the chart.
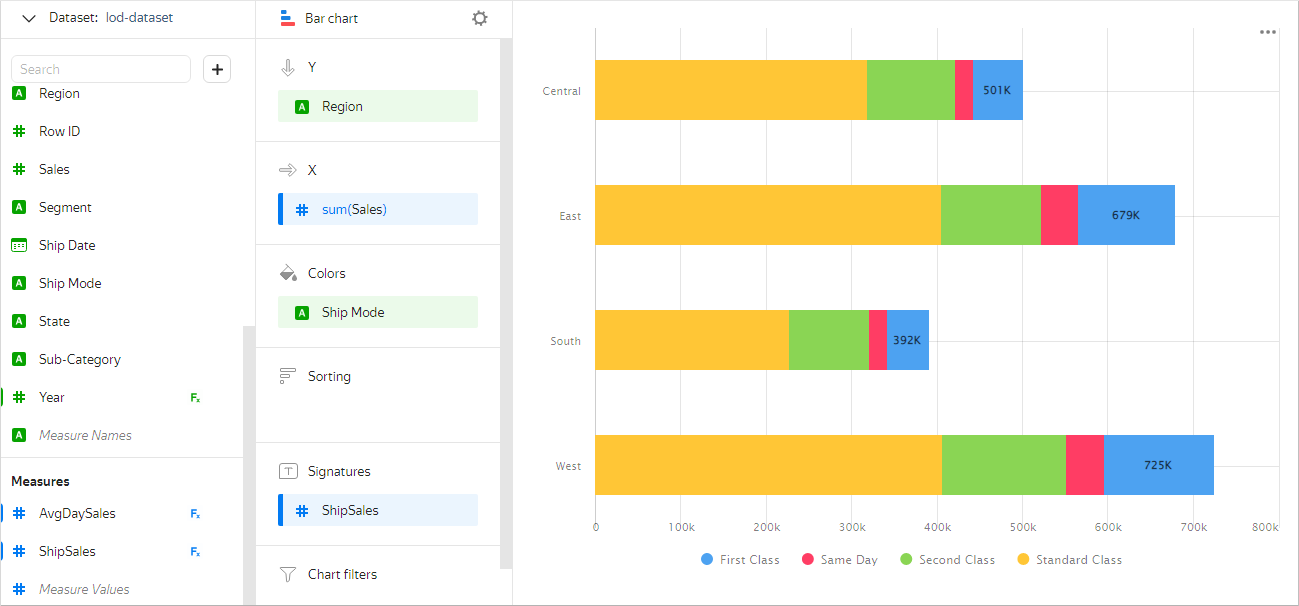
Example 1
Let's calculate sales for regions broken down by delivery type. First off, we are going to set the chart up to use grouping by [Region] and [Ship Mode]. To get total sales across all delivery types, we are going to add the following measure to the Labels section: IF([Ship Mode]="First Class", SUM([Sales] EXCLUDE [Ship Mode]), NULL). With EXCLUDE, the [Ship Mode] dimension is excluded from grouping when calculating this measure, so that total sales across all delivery types can be calculated.
For the Bar chart, the result will look like this:
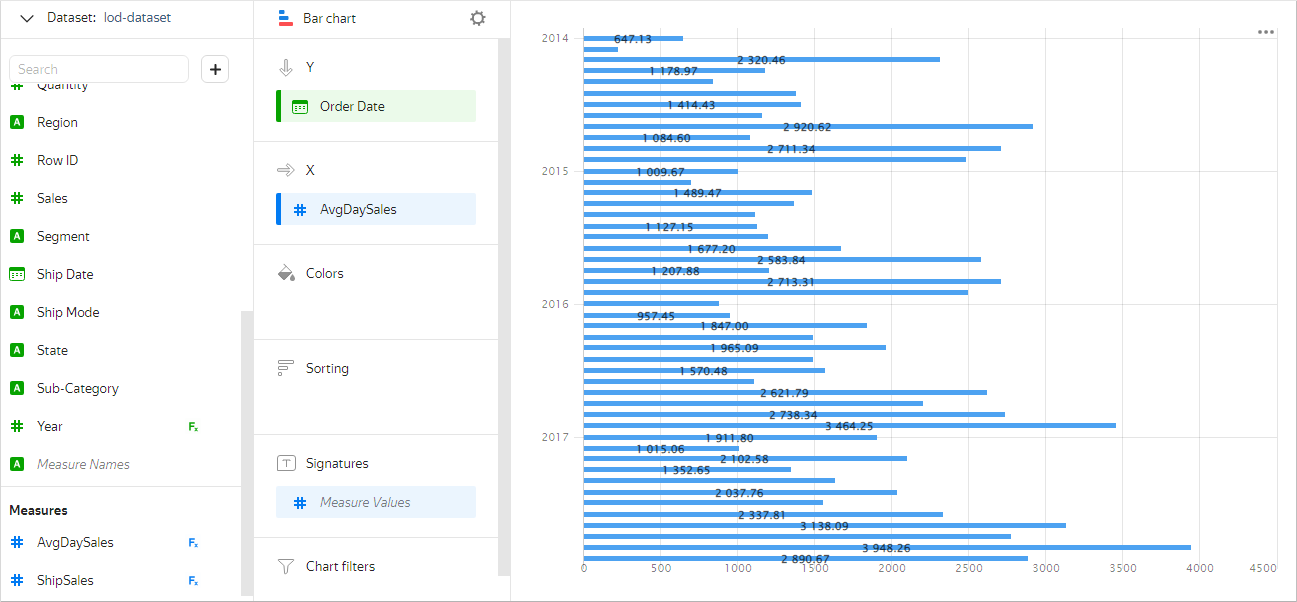
Example 2
Let's calculate average daily sales broken down by month. First let's add grouping by month to the chart: set the [Order Date] field in the Grouping setting to Rounding ⟶ Month (for more information, see Field settings). Proceed to create a measure with the AVG(SUM([Sales] FIXED [Order Date]) EXCLUDE [Order Date]) formula, where:
SUM([Sales] FIXED [Order Date]): Total sales under all orders per day.AVG(SUM([Sales] FIXED [Order Date]) EXCLUDE [Order Date]): The[Order Date]dimension is excluded from the grouping to calculate average daily sales with grouping by month (as set in the chart).
For the Bar chart, the result will look like this:
Any EXCLUDE-based aggregation can be replaced with a FIXED-based one. For example, in a chart grouped by the Region and Category dimensions, the SUM([Sales] EXCLUDE [Category]) measure will be the same as SUM([Sales] FIXED [Region]).
Filtering
The BEFORE FILTER BY section in LOD expressions has the same meaning as in window functions: the aggregate function is calculated before filtering by the specified fields.
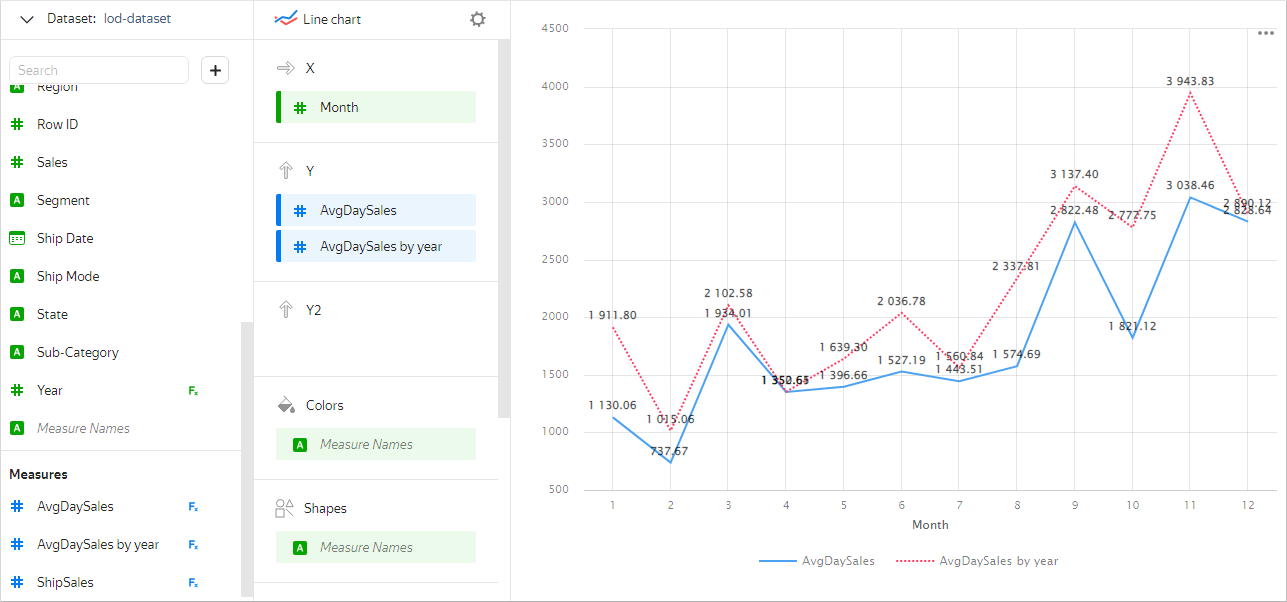
Example
Let's compare the measures of average daily sales per month for a certain year with those for the entire period. First, we will add two new dimensions to the chart, the month and the year of the order:
- Month:
MONTH([Order Date]) - Year:
YEAR([Order Date])
We are going to create two measures to calculate the sales value:
- AvgDaySales:
AVG(SUM([Sales] FIXED [Order Date]) EXCLUDE [Order Date] BEFORE FILTER BY [Year]) - AvgDaySales by year:
AVG(SUM([Sales] FIXED [Order Date]) EXCLUDE [Order Date])
Let's now add the Year dimension to the Filters section and set it, for example, to 2017. As a result, the AvgDaySales measure will be calculated before the chart is filtered by year, so we will get average daily sales per month for the whole period. The AvgDaySales by year measure will be calculated after the chart is filtered by year, so we will get average daily sales per month for the selected year (2017).
For the Line chart, the result will look like this:
Common features with window functions
In some cases, LOD expressions can be used as an alternative to window functions.
For example, a FIXED expression with a list of dimensions can be used the same way as a window function with WITHIN grouping, whereas an EXCLUDE expression, the same way as a window function with AMONG grouping.
Example 1
Let's have a look at the chart which calculates the percentage of each product category from the total sales per city. The % Total by city window and % Total by city lod measures yield the same result:
- % Total by city lod:
SUM([Sales]) / SUM([Sales] FIXED [City]) - % Total by city window:
SUM([Sales]) / SUM(SUM([Sales]) WITHIN [City])
In some cases, FIXED with an empty list of dimensions is the same as a window function with TOTAL grouping (which in turn is synonymous to WITHIN with an empty list).
Example 2
Let's have a look at the chart which calculates the percentage of each product category from the total sales across all cities. The % Total window and % Total lod measures yield the same result:
- % Total lod:
SUM([Sales]) / SUM([Sales] FIXED) - % Total window:
SUM([Sales]) / SUM(SUM([Sales]) TOTAL)
For INCLUDE, there is no equivalent in window functions: you cannot add new dimensions there.
Limits
Certain limitations apply when it comes to the level of detail in LOD expressions:
-
Top-level aggregations cannot contain dimensions that are not used in the chart. Therefore, you cannot use a top-level aggregation with a non-empty
INCLUDEorFIXEDcontaining dimensions not used in the chart.Example
Let's create a measure to calculate average sales per city in a chart grouped by the
[Region]and[Category]dimensions:CorrectIncorrectAVG(AVG([Sales] INCLUDE [City]))In this case, the nested aggregation will be grouped by dimensions inherited from the top-level aggregation (
[Region]and[Category]) plus the[City]dimension added to the grouping with the help ofINCLUDE. The top-level aggregation will thus be calculated grouped by the chart's[Region]and[Category]dimensions, and the nested aggregation will use grouping by the[Region],[Category], and[City]dimensions.AVG([Sales] INCLUDE [City])When calculating this measure, the top-level grouping is done based on the
[Region],[Category], and[City]dimensions. In this case the error occurs because the chart does not use the[City]dimension, which was added to the grouping with the help ofINCLUDE. -
Aggregations that are at the same nesting level cannot have different dimensions. At least one of the nested aggregations must contain all dimensions present in other nested aggregations.
Example
Let's create a measure to calculate the city with the maximum average daily sales in a chart grouped by the
[Region]and[Category]dimensions:CorrectIncorrectARG_MAX( ANY([City] INCLUDE [City]), AVG([Sales] INCLUDE [City],[Order Date]) )The
ANY([City] INCLUDE [City])andAVG([Sales] INCLUDE [City],[Order Date])aggregations are at the same nesting level (insideARG_MAX). The second aggregation contains all dimensions by which the first aggregation is grouped.ARG_MAX( ANY([City] INCLUDE [City]), AVG([Sales] INCLUDE [Order Date]) )The
ANY([City] INCLUDE [City])andAVG([Sales] INCLUDE [Order Date])aggregations are at the same nesting level (insideARG_MAX). The first aggregation has the[City]dimension; the second one,[Order Date]. At the same time, there is no other aggregation that has both dimensions. -
You cannot use aggregations with a certain level of detail and the AGO and AT_DATE functions in the same query (in the same chart or in the dataset preview), even if they are in different fields.