Functions for time series
This section describes how to use the time series functions based on the AGO function example. This function calculates measure values for past or future periods.
We will use a Moscow retail chain's demo sales ClickHouse® database as our data source.
To access the demo database, create a direct connection to it.
Create a dataset based on the MS_SalesFullTable table:
-
Set the Sum aggregation type for the Sales field:
-
Add these calculated fields to the dataset:
Month, with theDATETRUNC([OrderDatetime], "month")formula. This field shows the sales date rounded to a month.Sales last year, with theAGO([Sales], [Month], "year", 1 BEFORE FILTER BY [OrderDatetime])formula. This formula enables you to get the Sales metric volume shifted along the Month dimension by one year. TheBEFORE FILTER BYargument means that the function is calculated before filtering by the OrderDatetime field in the chart.Sales delta, with the[Sales]-[Sales last year]formula. This field shows a change in the sales amount compared to the previous year.Sales dynamics, with the([Sales] - [Sales last year]) / [Sales last year]formula. This field shows sales dynamics compared to the previous year.Changes, with theIF([Sales dynamics] > 0, CONCAT("▲", CEILING([Sales dynamics] * 100), "%"), CONCAT("▼", CEILING([Sales dynamics] * 100), "%"))formula. If the sales dynamics is positive, the field shows the▲icon and the sales amount percentage change. Otherwise, the field shows the▼icon and the sales amount percentage change.
You can use the Sales last year field created using the AGO time function, as well as its derived fields, to create charts to compare year-on-year sales changes.
Example 1
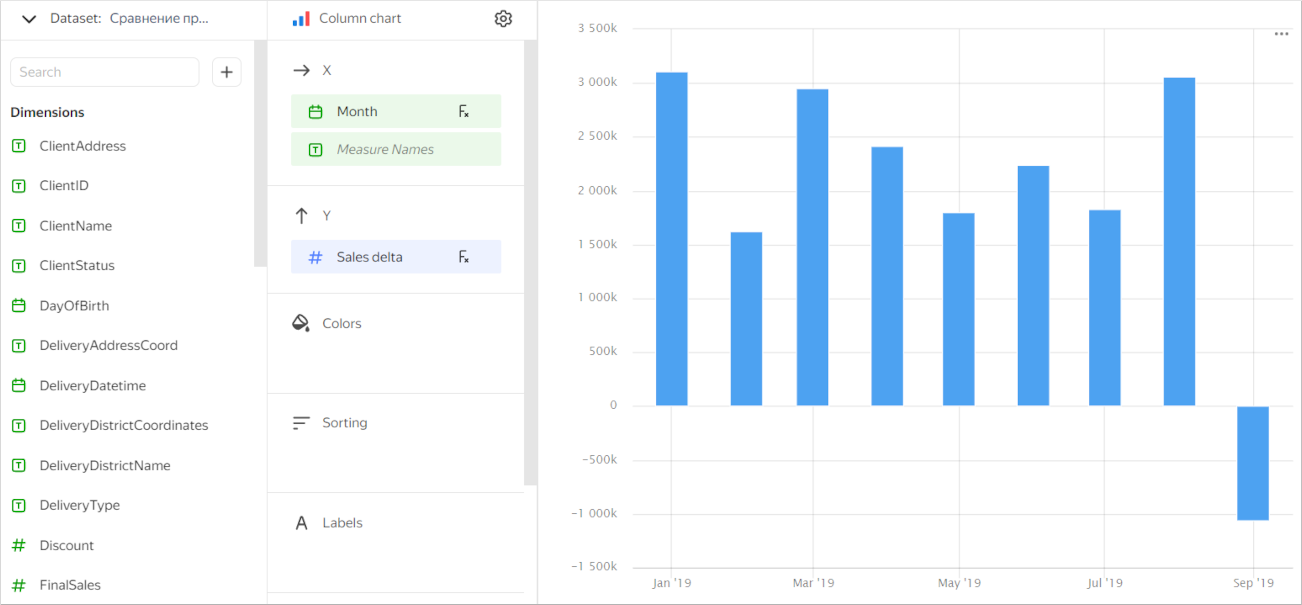
Create a chart to output metrics of sales growth compared to the previous year.
- Create a bar chart.
- Drag the Month dimension to the X section.
- Drag the Sales delta measure to the Y section.
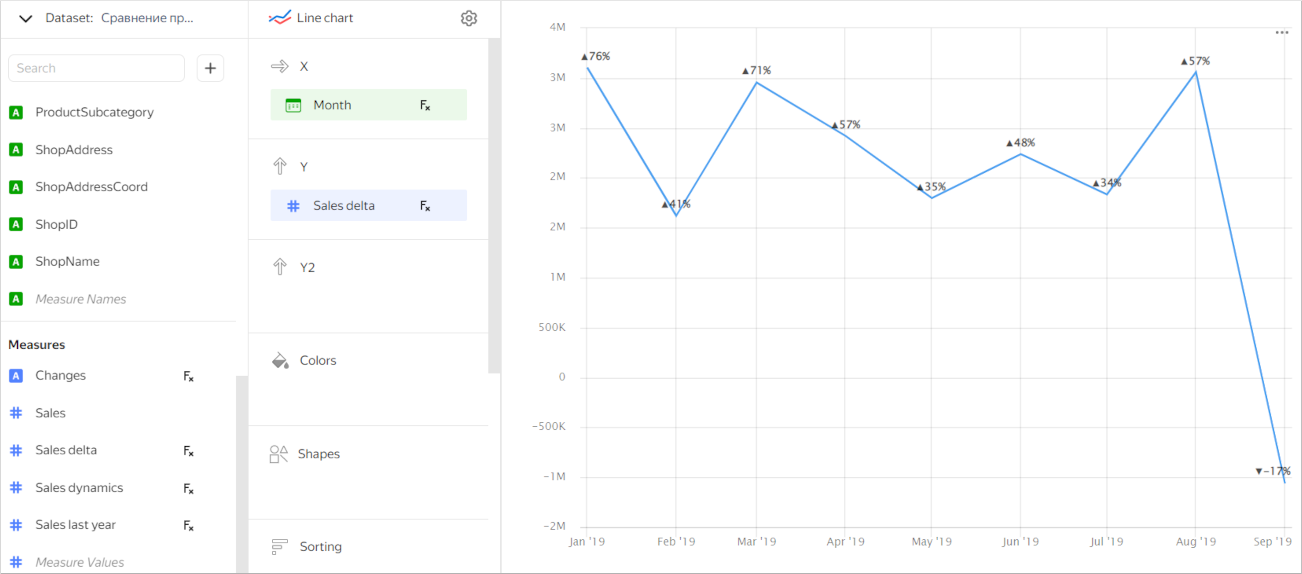
Example 2
Create a chart to show the sales dynamics compared to the previous year.
- Create a line chart.
- Drag the Sales delta measure to the Y section.
- In the Sales delta field settings, select the Auto dimension.
- In the Y axis settings for the Axis format parameter, select By the first field on the Y axis.
- Drag the Changes measure to the Labels section.
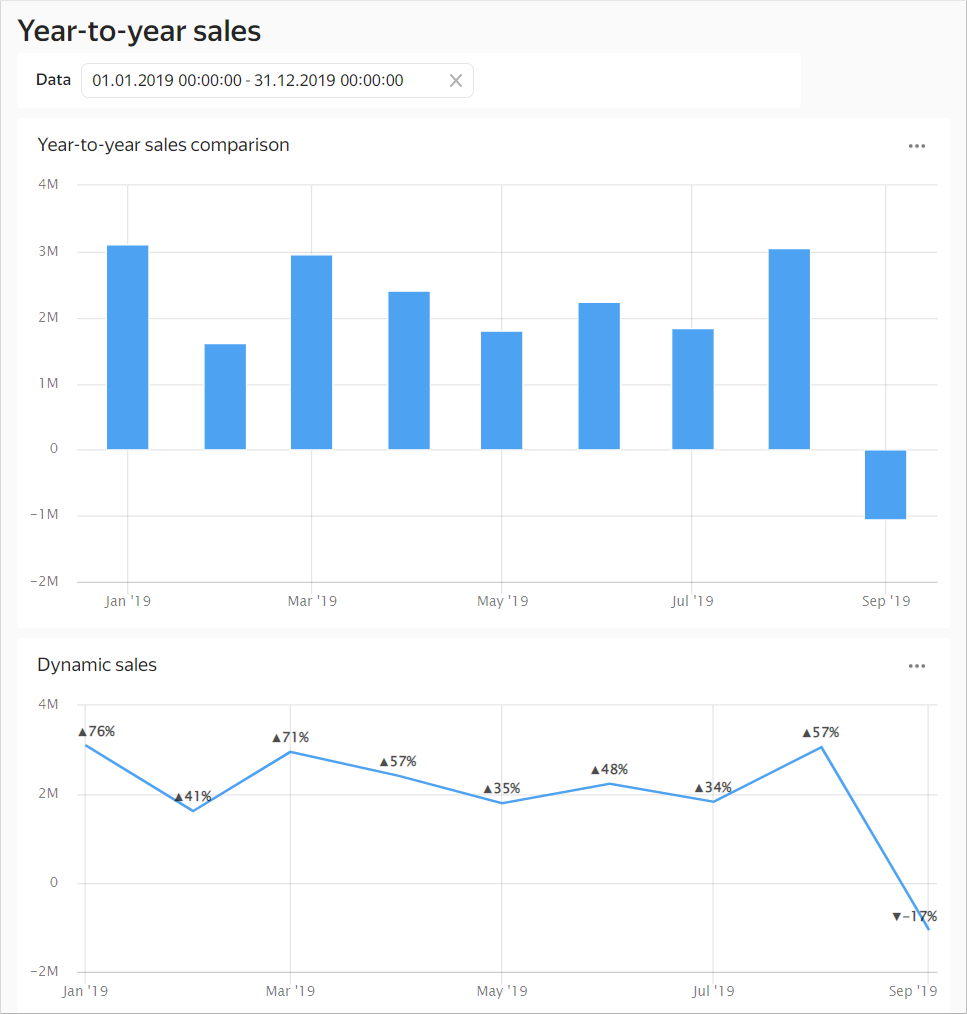
You can add both charts to the dashboard to compare the absolute and percentage changes in your sales year-on-year.
ClickHouse® is a registered trademark of ClickHouse, Inc.