Window functions in Yandex DataLens

Window functions are similar to aggregate functions. They allow you to get additional information about the original sample. For example, you can calculate the cumulative total and the moving average or rank values.
The difference is that when calculating window functions, the rows are separate rather than combined into one. The result of the calculation is displayed in each row. The original number of rows does not change. For more information about how data aggregation and groupings work in DataLens, see Data aggregation in DataLens.
These examples will use the Selling.csv file containing sales data by city as the data source.
Applying window functions
In DataLens, only measures can be the arguments of window functions. The groups of values a function is calculated for are specified as a list of dimensions and are called windows. Groupings may only use the dimensions involved in building a chart. These include all dimensions in a single chart section.
Let's take a look at the Selling table with data on sales in cities:
| # | City | Category | Date | Sales | Profit | Day's discount |
|---|---|---|---|---|---|---|
| 1 | Detroit | Office Supplies | 2014-01-02 | 10 | 7 | 0.05 |
| 2 | Portland | Office Supplies | 2014-04-05 | 14 | 10 | 0.00 |
| 3 | Portland | Office Supplies | 2014-01-21 | 20 | 12 | 0.20 |
| 4 | San Francisco | Office Supplies | 2014-03-11 | 8 | 3 | 0.10 |
| 5 | Detroit | Furniture | 2014-01-01 | 12 | 3 | 0.00 |
| 6 | Portland | Furniture | 2014-01-21 | 7 | 2 | 0.05 |
| 7 | San Francisco | Technology | 2014-01-02 | 7 | 3 | 0.10 |
| 8 | San Francisco | Technology | 2014-01-17 | 13 | 5 | 0.20 |
Example 1
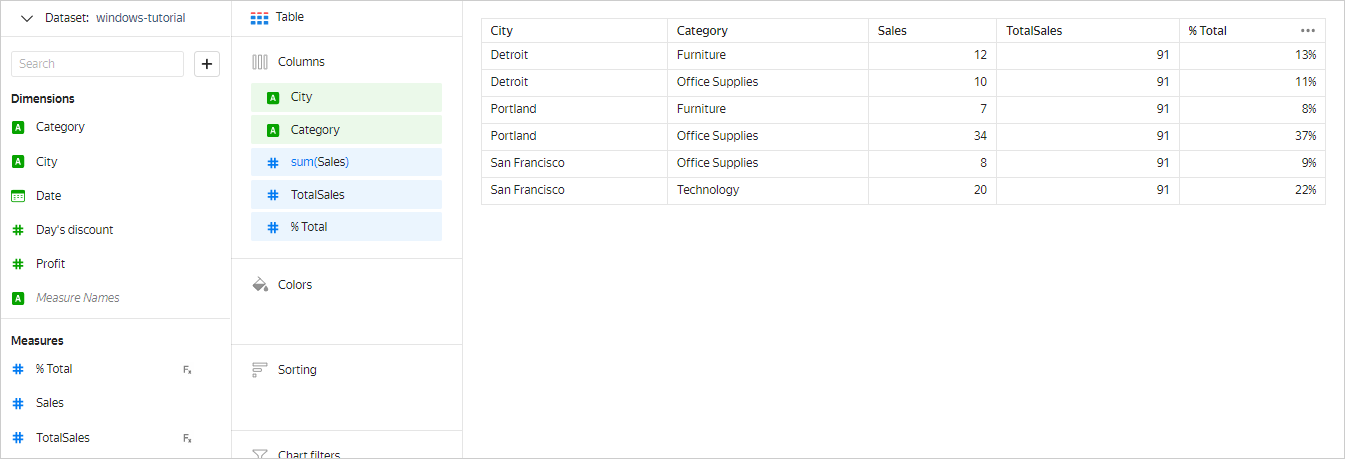
In the chart based on the Selling table and grouped by City and Category, you need to calculate TotalSales as well as each category's share in a city as a percentage of the % Total. To do this, you need to create two measures using the SUM window function:
- TotalSales:
SUM(SUM([Sales]) TOTAL) - % Total:
SUM([Sales]) / [TotalSales]
For the Table chart, the result will look like this:
Example 2
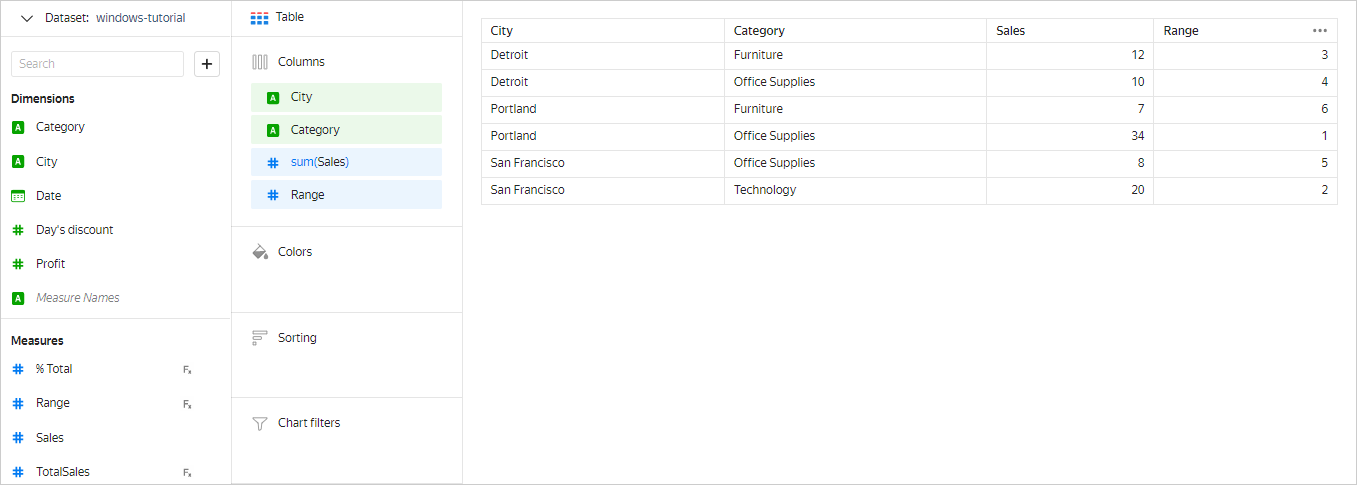
You need to arrange the rows in the Selling table based on the sales amount. To do this, you can use the RANK window function: RANK(SUM([Sales])). As a result, each row is assigned a sequence number: the row with the largest sales amount is 1, the one with smallest, 6.
Window functions can be nested. You can also specify a custom grouping for each function used in the formula.
Example 3
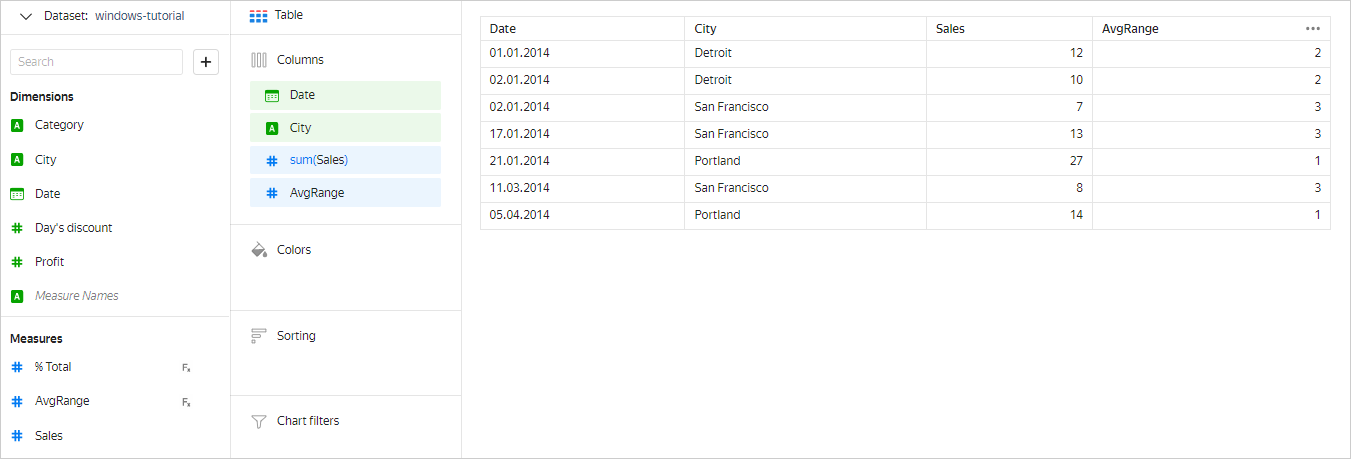
You need to arrange the rows in the Selling table based on the average sales amount for all dates in the city. You can calculate an average sales amount for a city using the AVG function: AVG(SUM([Sales]) WITHIN [City]). City names repeat in the table, so for ranking, use the RANK_DENSE function. It does not skip sequence numbers for rows with the same value. The resulting formula is RANK_DENSE(AVG(SUM([Sales]) WITHIN [City]) TOTAL).
Example 4
Let's review a more complicated window function example. We will build a dataset from a connection to the demo DB (the SampleLite table) and use it as our data source. Let's build a chart of the sales statistics by product subcategory. We will only include those subcategories that made it into the daily top 3 sellers at least once a day.
Read more
-
Let's order our product subcategories in descending order by sales amount within each date. To do this, we will use the RANK window function to create a metric:
- Sales Rank:
RANK(SUM([Sales]) WITHIN [Date])
As a result, for each date, the subcategory with the highest total sales will be numbered
1, the subcategory with the next highest total,2, etc. For convenience, let's place the data in a Table chart: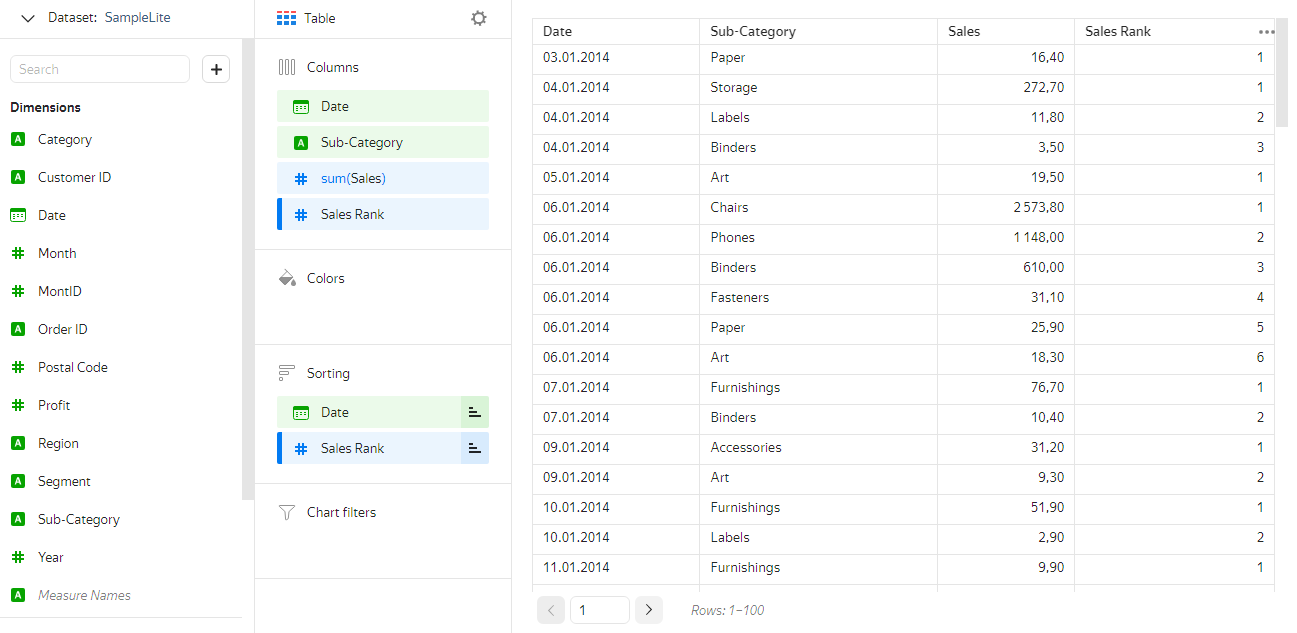
- Sales Rank:
-
Let's highlight the subcategories in the top 3 most sold for the same date. To do this, create the following metric:
- Top-3:
IF([Sales Rank] <= 3, 1, 0)
The subcategories that make it into the top 3 based on sales for each date will have the
[Top-3]measure equal to1, whereas for the remaining categories on the same date, it will be equal to0.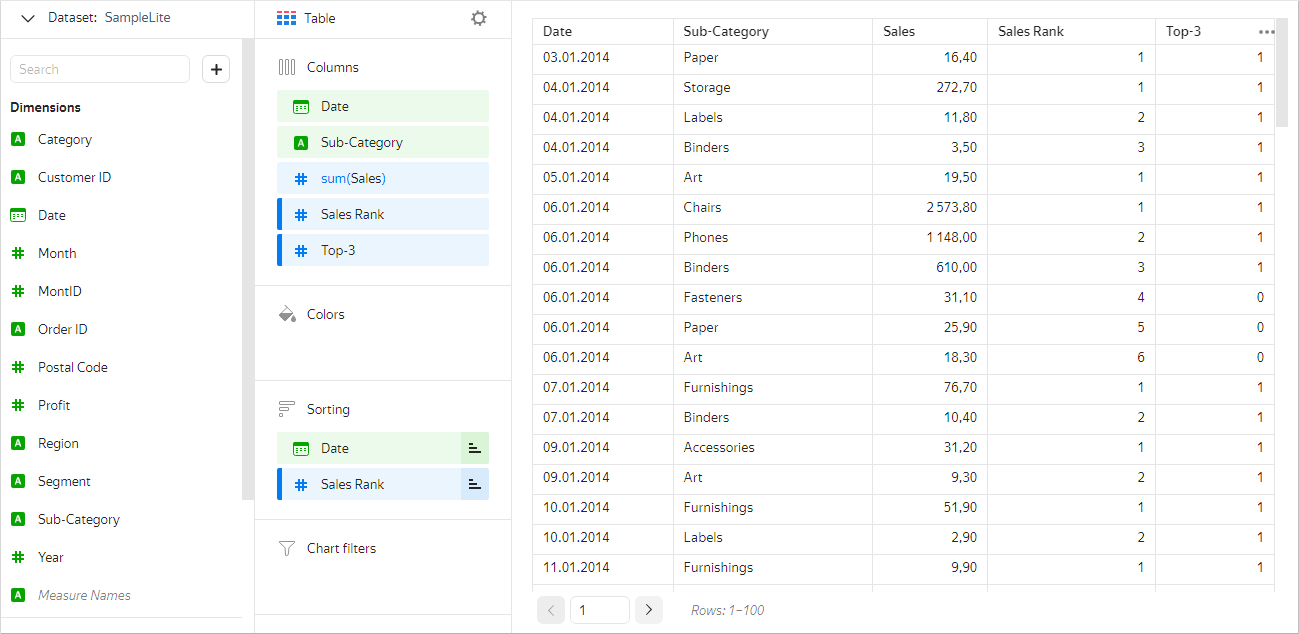
- Top-3:
-
Using the
[Top-3]measure, we have highlighted the categories for the same date. Now, we need to highlight these subcategories for the other dates. To do this, let's create a metric using the MAX window function:- [Show Category]:
MAX([Top-3] WITHIN [Sub-Category])
In each product subcategory, the
[Show Category]measure will be equal to1both for the date when the subcategory made it into the top 3 based on sales and for all other dates. If a subcategory did not make it into the top 3 most sold on any date, its[Show Category]measure will be equal to0.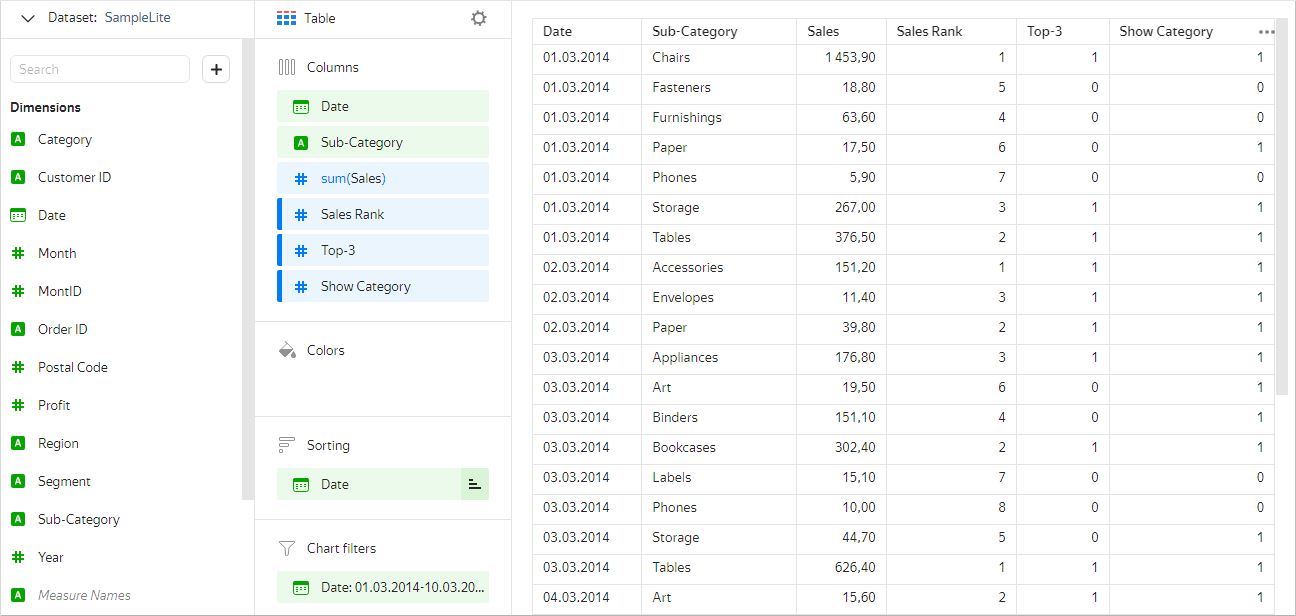
- [Show Category]:
-
Let's add the following filter to the chart:
[Show Category] = 1. This will give us a list of the product subcategories that need to be displayed on the chart. -
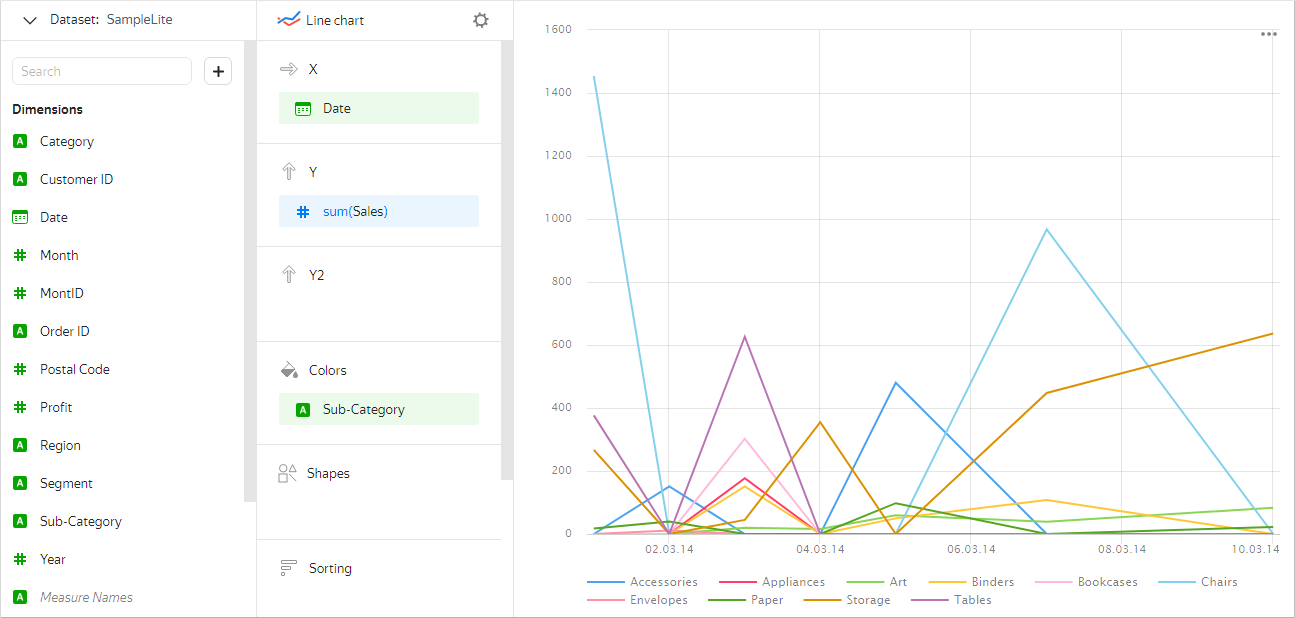
Let's now change our chart type to Line chart. Configure visualization:
-
Drag the
Datedimension to the X section. -
Drag the
Salesmeasure to the Y section. -
Drag the
Sub-Categorydimension to the Color section. -
Under Filters, we will keep the filter for the
Show Categorymeasure equal to1. -
In the Y axis settings, set Null values to Displayed as 0.
-
Grouping in window functions
Just like aggregate functions, window functions can be calculated:
- For a single window.
- For multiple windows.
For more information about grouping in window functions, see Grouping.
Grouping for a single window
With this grouping option, the function is calculated for a single window that includes all rows. For this purpose, use the TOTAL grouping type. enables you to calculate totals, rank rows, and perform other operations that require information about all source data.
Example
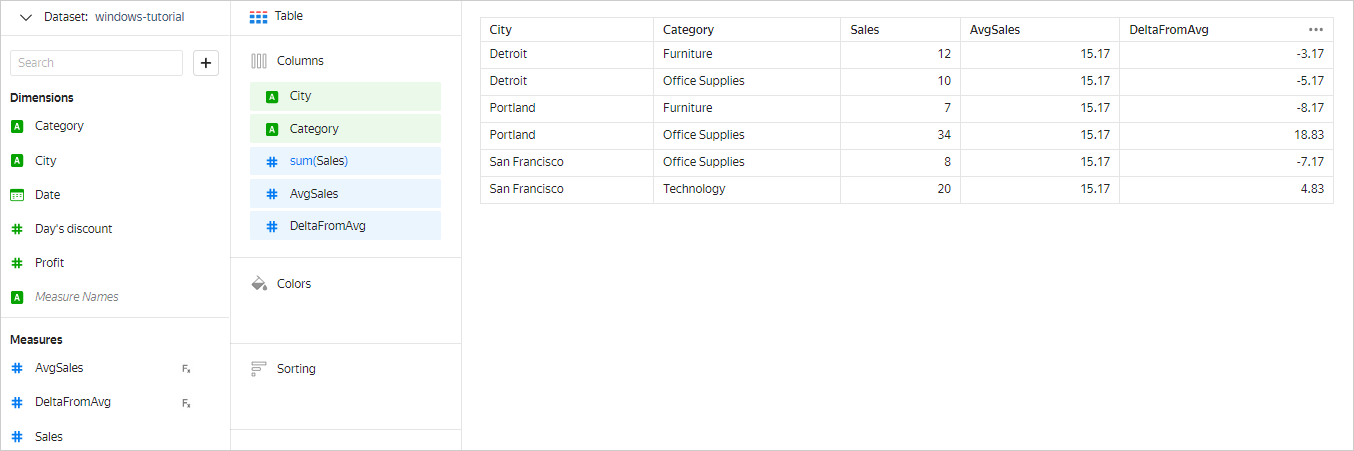
You need to calculate the average sales amount (AvgSales) and deviations from it for each category in the city (DeltaFromAvg). The best function for this is AVG:
- AvgSales:
AVG(SUM([Sales]) TOTAL) - DeltaFromAvg:
SUM([Sales]) - [AvgSales]
Grouping for multiple windows
Sometimes, the window function needs to be calculated separately by group rather than across all records. In this case, one should use the WITHIN and AMONG grouping types.
WITHIN
WITHIN works in the same way as GROUP BY in SQL. It lists all dimensions by which splitting into windows is performed. In WITHIN, you can also use measures. In this case, their values are similarly included in the window grouping.
Warning
In WITHIN, the dimensions that are not included in chart grouping are ignored. For example, in a chart grouped by the City and Category dimensions for the SUM(SUM([Sales]) WITHIN [Date]) measure, the Date dimension is ignored, and the measure will become the same as the SUM(SUM([Sales]) TOTAL).
Example
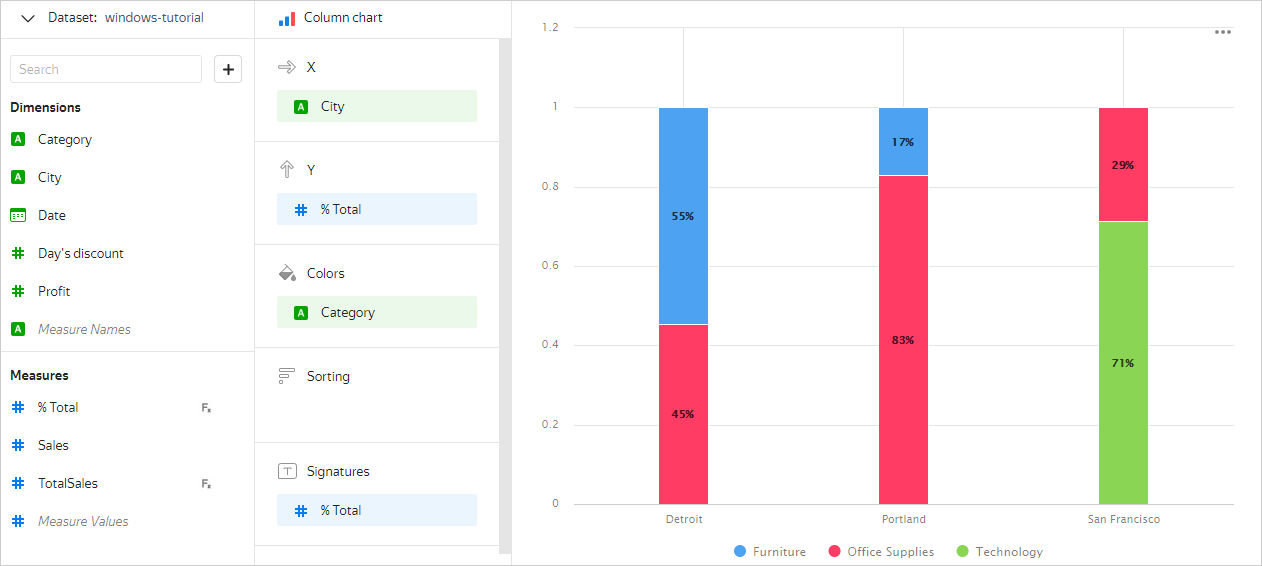
Calculating the share of each category (% Total) of the total sales amount by city (TotalSales):
- TotalSales:
SUM(SUM([Sales]) WITHIN [City]) - % Total:
SUM([Sales]) / [TotalSales]
For example, this is the result for the Column chart:
AMONG
In this case, splitting into windows is performed for all dimensions that are included in the chart grouping but are not listed in AMONG. This grouping type is contrary to WITHIN. When calculating the function, AMONG transforms to WITHIN, which performs grouping by all dimensions that are not listed in AMONG.
For example, for a chart with grouping by the City and Category dimensions, the following measures are the same:
SUM(SUM([Sales]) AMONG [Category])andSUM(SUM([Sales]) WITHIN [City])SUM(SUM([Sales]) AMONG [City], [Category])andSUM(SUM([Sales]) TOTAL)
This option is provided only for your convenience and is used when you do not know which dimensions the chart will be built across in advance, but you need to exclude certain dimensions from the window grouping.
Warning
The dimensions listed in AMONG should be added to the chart sections. Otherwise, the chart will return an error.
Sorting
Some window functions support sorting, the direction of which affects the value calculation. To specify sorting for the window function:
- Specify dimensions or measures in the
ORDER BYsection. - In the chart, move the dimensions or measures to the Sorting section.
Dimensions and measures for sorting are first taken from the ORDER BY section in the formula, and then from the Sorting chart section.
Example
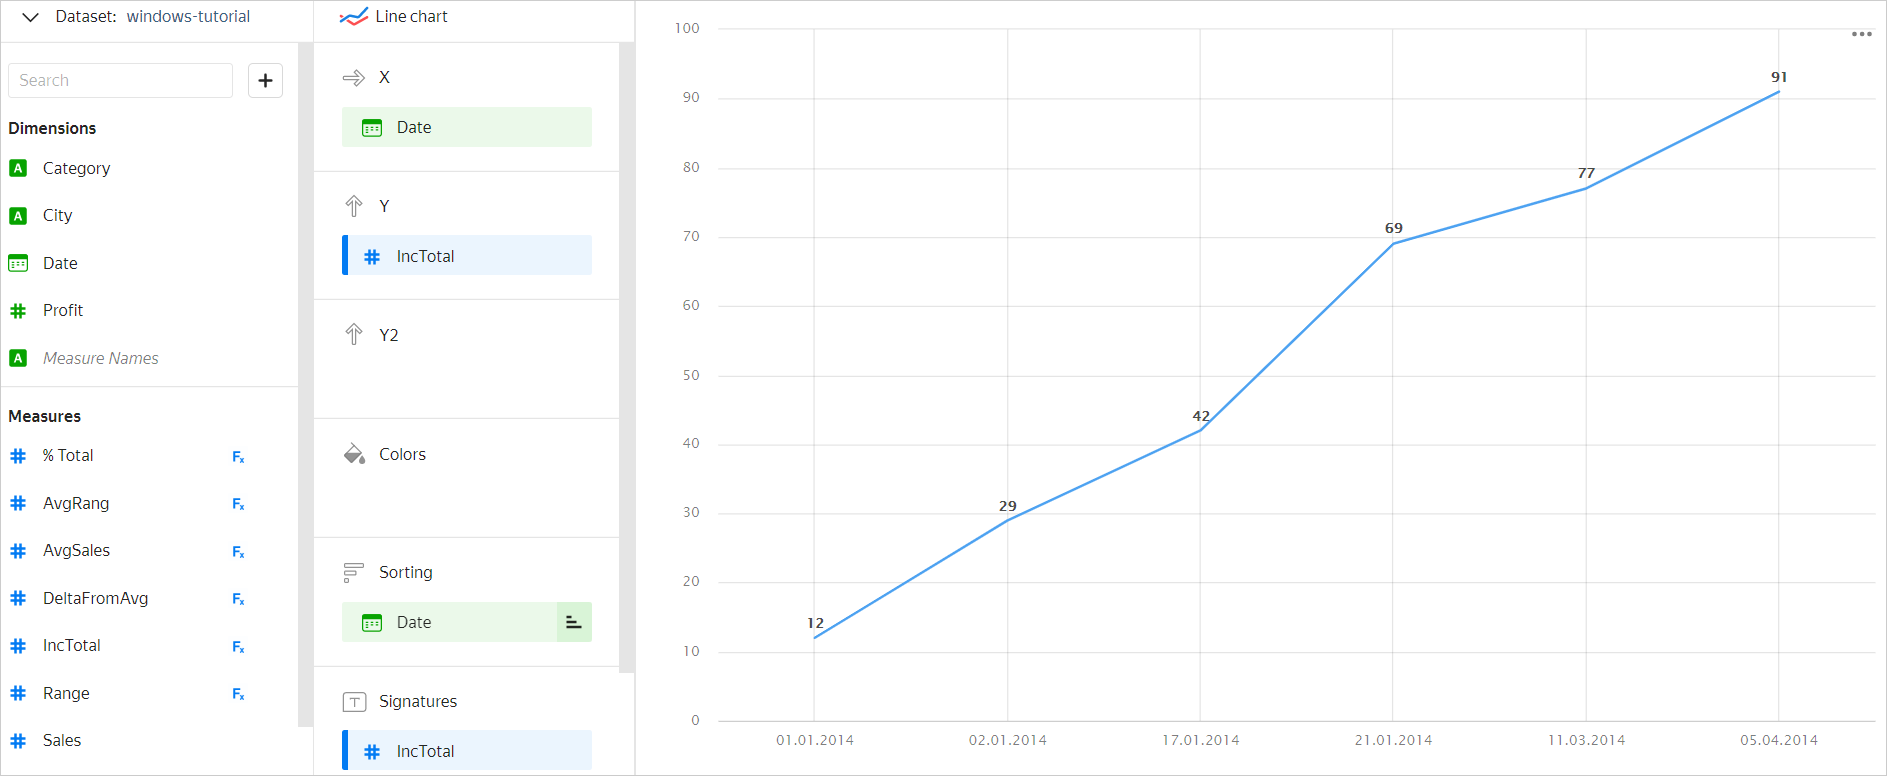
You need to calculate the change in the total sales amount (IncTotal) for the entire period, from the earliest to the latest date. To do this, you can use the RSUM function sorted by Date: RSUM(SUM([Sales]) TOTAL ORDER BY [Date]).
For a Line chart, the result will look as follows:
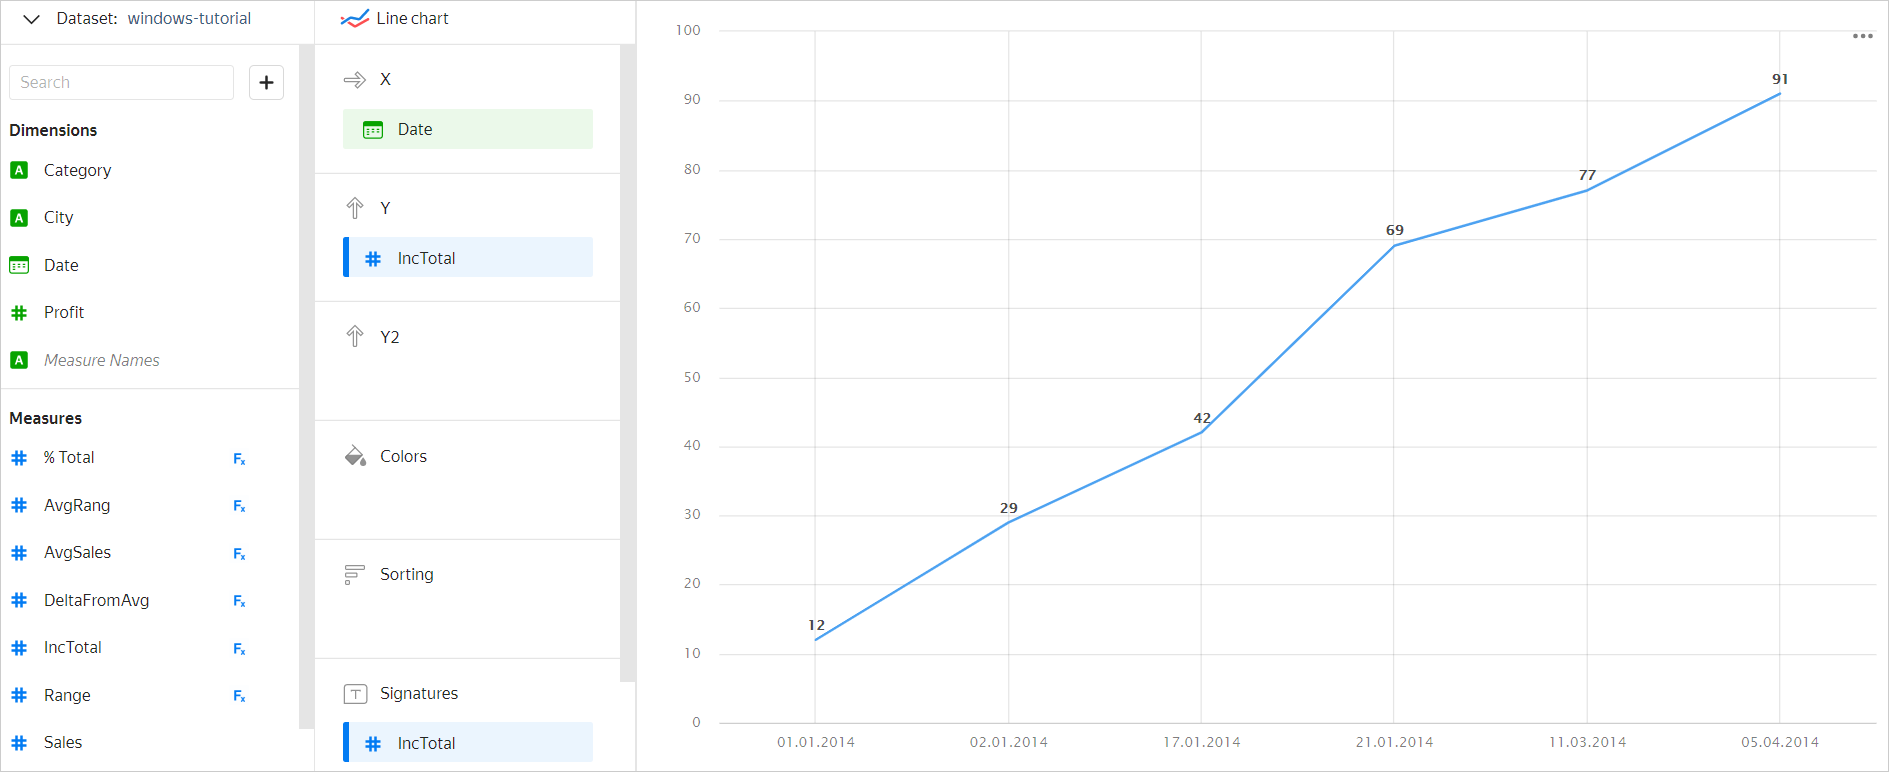
You will get a similar result if you set the IncTotal measure with the RSUM(SUM([Sales]) TOTAL) formula and add the Date dimension to the Sorting section.
Filtering
Function values in charts are calculated after applying filters across the dimensions and measures added to the Filters section. For window functions, you can override this order. To do this, specify the dimensions or measures you need in the BEFORE FILTER BY section of the formula. In this case, the function value will be calculated before filtering is applied.
The calculation order is changed when you need to calculate the function value for the original dataset but the chart data is limited by the filter.
Example
You need to calculate the change in the total sales amount (IncTotal) from 17.01.2014 to 11.03.2014. If you add the Date dimension filter and create the RSUM(SUM([Sales]) TOTAL ORDER BY [Date]) measure, the function will be calculated only for the data limited by the filter:
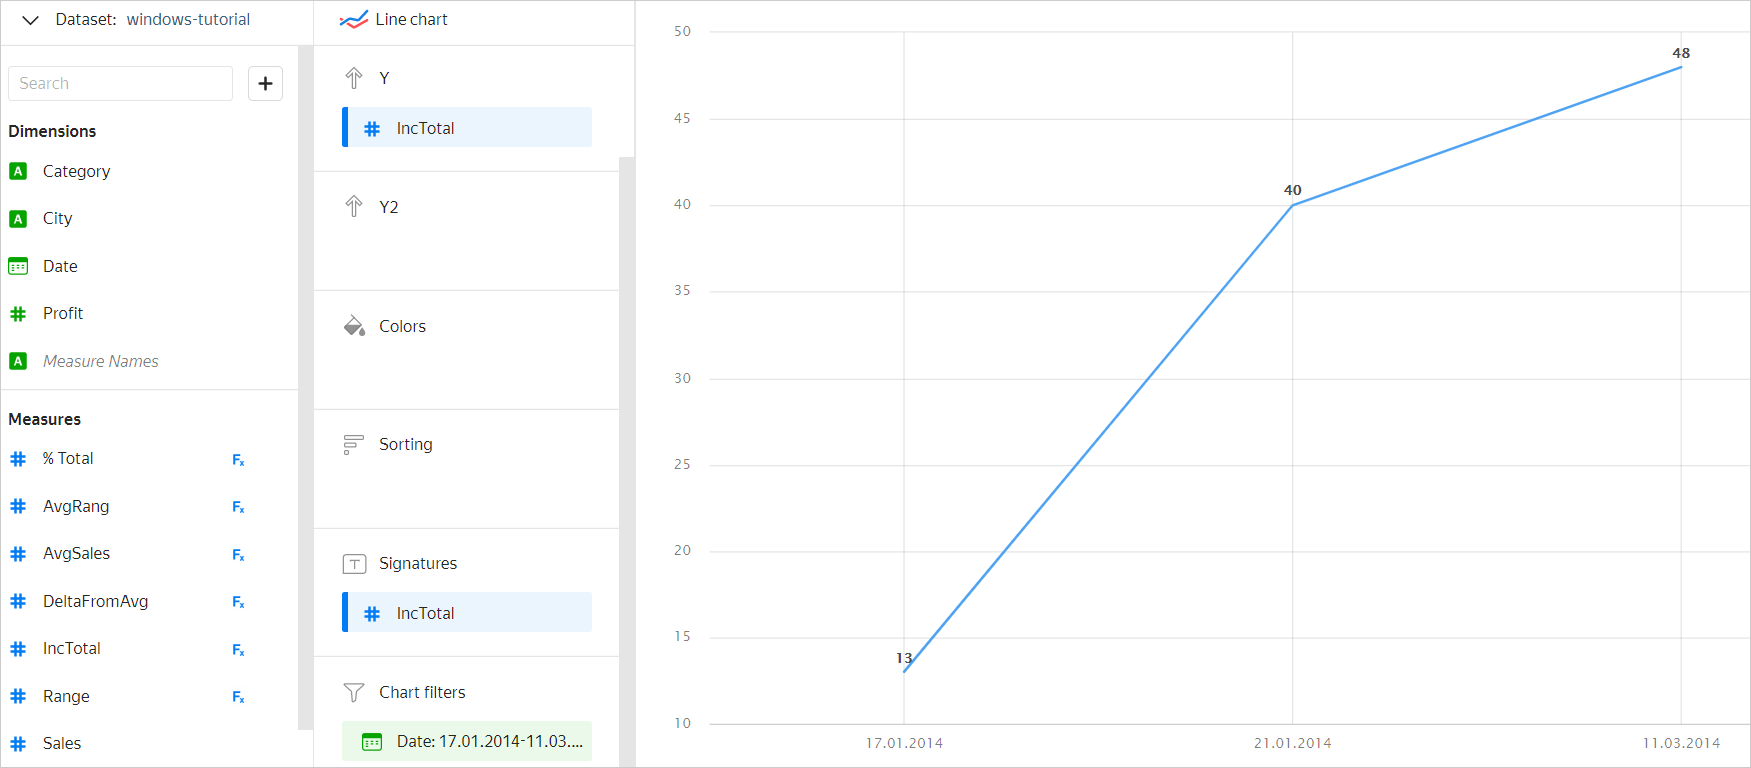
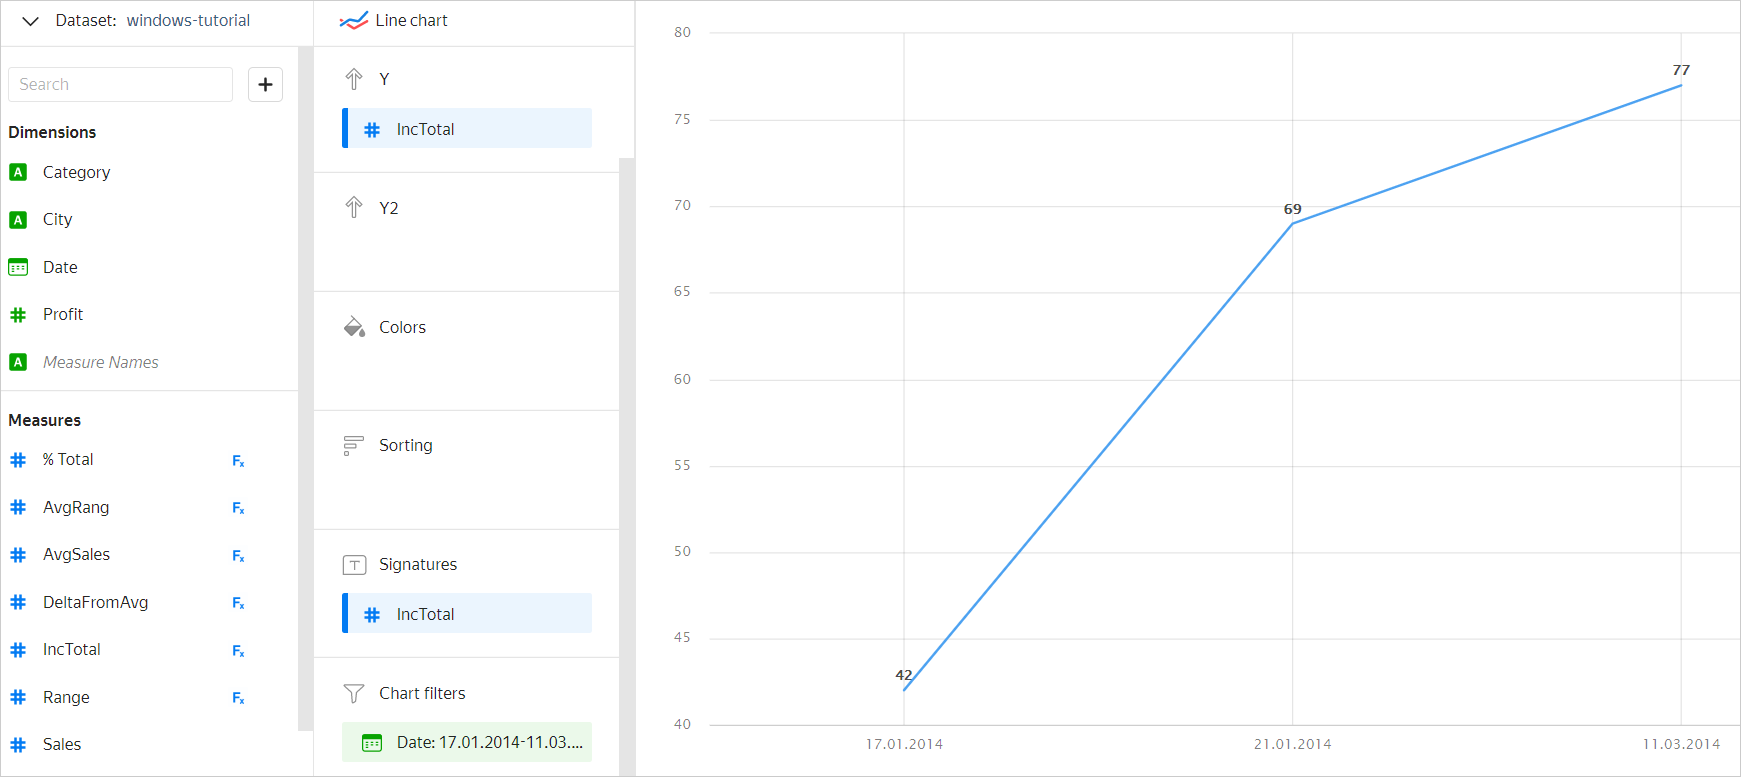
To calculate a function for all data while only displaying the result for a certain period, you need to add the Date dimension to the BEFORE FILTER BY section: RSUM(SUM([Sales]) TOTAL ORDER BY [Date] BEFORE FILTER BY [Date]).
Creating measures for a window function
You cannot use a dimension directly as the first argument (value in the syntax description) of a window function. You need to first apply an aggregation function to it so that a dimension becomes a measure that can be used in window functions.
For example, let's assume you need to rank sales records by profit over the entire period in a chart with data grouped by the Year and Category dimensions. For this, you cannot use the RANK([Profit]) formula, where Profit is a dimension. You need to apply an aggregation function first to convert the Profit dimension into a measure. The most suitable aggregate function here is SUM that returns the amount of profit: SUM([Profit]). Next, apply the RANK window function to the resulting measure. The correct resulting formula is RANK(SUM([Profit])).
You can add measures both at the dataset and the chart level. Read more in Methods to create measures.
To understand what aggregate function to select for converting dimensions into measures, specify what resulting measure you want to get using a window function. For example, in a chart with data grouped by product Category, you need to arrange records by Sales. To arrange records by sales amount, use the SUM aggregate function: SUM([Sales]). To arrange them by sales count, use COUNT: COUNT([Sales]).
If you need to get a string measure with a value determined by grouping and sorting data in a window function, use the ANY aggregate function.
Let's take a look at examples of creating measures for a window function. We will build a dataset from a connection to the demo DB (the MS_SalesFullTable table) and use it as our data source.
Example 1
You need to output the sales count per day for each product category and the total number of sales per day.
-
Select Table as the chart type.
-
Add the
OrderDatefield with theDATE([OrderDatetime])formula to the chart. -
Drag the
OrderDateandProductCategorydimensions to the Columns section. -
To arrange records by sales date, add the
OrderDatedimension to the Sorting section. -
To count sales per day for each product category, add the
cnt_order_date_categorymeasure to your chart. Use the COUNT aggregate function. It will group data by dimensions from the Columns section. The resulting formula isCOUNT([OrderID]). -
Drag the
cnt_order_date_categorymeasure to the Columns section. -
To count the total number of sales per day, add the
cnt_order_datemeasure to your chart. Use the SUM window function with grouping by theOrderDatedimension. To convert theOrderIDdimension into a measure, use the COUNT aggregate function:COUNT([OrderID]). The resulting formula isSUM(COUNT([OrderID]) WITHIN [OrderDate]). -
Drag the
cnt_order_date_categorymeasure to the Columns section.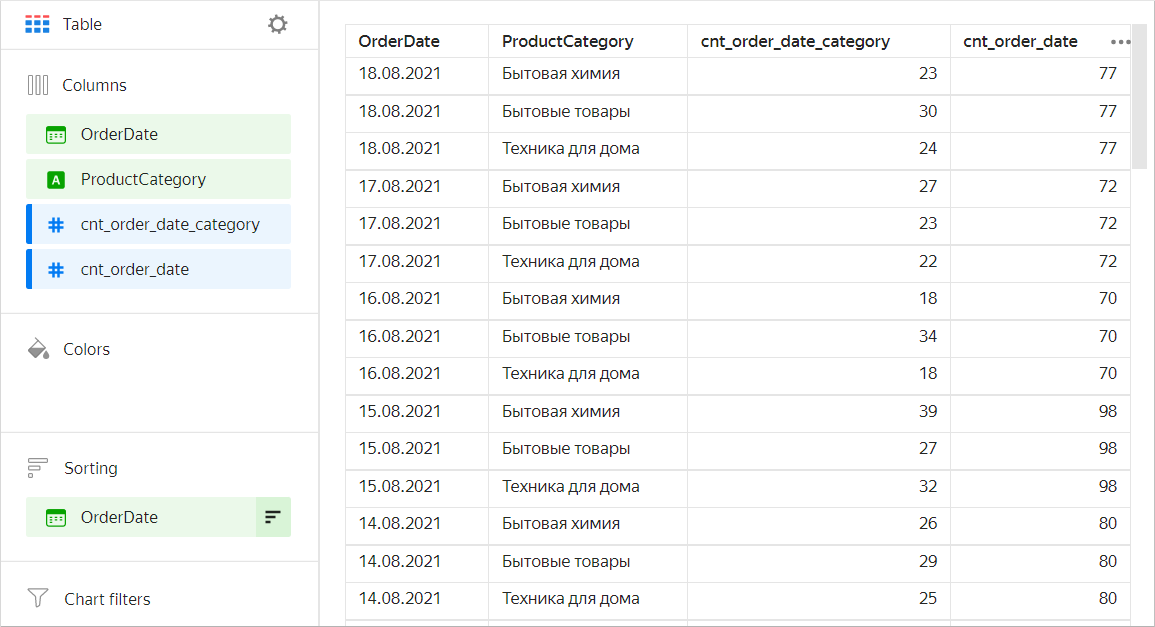
Example 2
The output should be the average value of sales by shop and its product categories:
-
Select Table as the chart type. Drag the
ShopNameandProductCategorydimensions to the Columns section. -
To calculate the average sales value by the shop's product categories, add the
avg_category_salemeasure to your chart. Use the AVG aggregate function. It will group data by dimensions from the Columns section. The resulting formula isAVG([Sales]). -
Drag the
avg_category_salemeasure to the Columns section. -
To calculate the average sales value by shop, add the
avg_shop_salemeasure to your chart. Use the AVG window function with grouping by theShopNamedimension. To convert theSalesdimension into a measure, use the AVG aggregate function:AVG([Sales]). The resulting formula isAVG(AVG([Sales]) WITHIN [ShopName]). -
Drag the
avg_shop_salemeasure to the Columns section.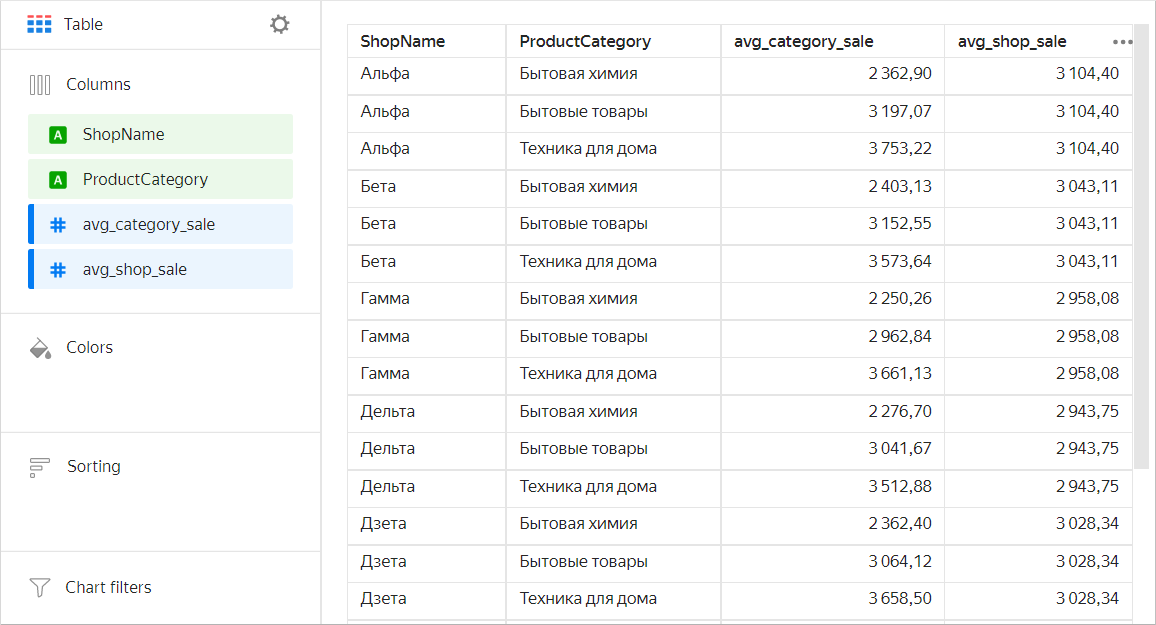
Example 3
As a result, we should get a pivot table with the IDs of the last sales for the day by shop:
-
To group data by sales date (without time), add the
Datefield with theDATE_PARSE(STR([OrderDatetime]))formula to your chart. -
To sort data by sales time, add the
Timefield with theRIGHT(STR([OrderDatetime]),8)formula to your chart. -
Select Pivot table as the chart type. Drag the
ShopName,OrderDatetime, andOrderIDdimensions to the Rows section. -
Add the
last_shop_ordermeasure to your chart. Use the LAST window function with grouping byShopNameand sorting byTime. To convert a string dimension to a measure, use the ANY aggregate function withINCLUDEgrouping (to produce unique values):ANY([OrderID] INCLUDE [OrderID]). The resulting formula isLAST(ANY([OrderID] INCLUDE [OrderID]) WITHIN [ShopName], [Date] ORDER BY [Time]). -
Drag the
last_shop_ordermeasure to the Measures section.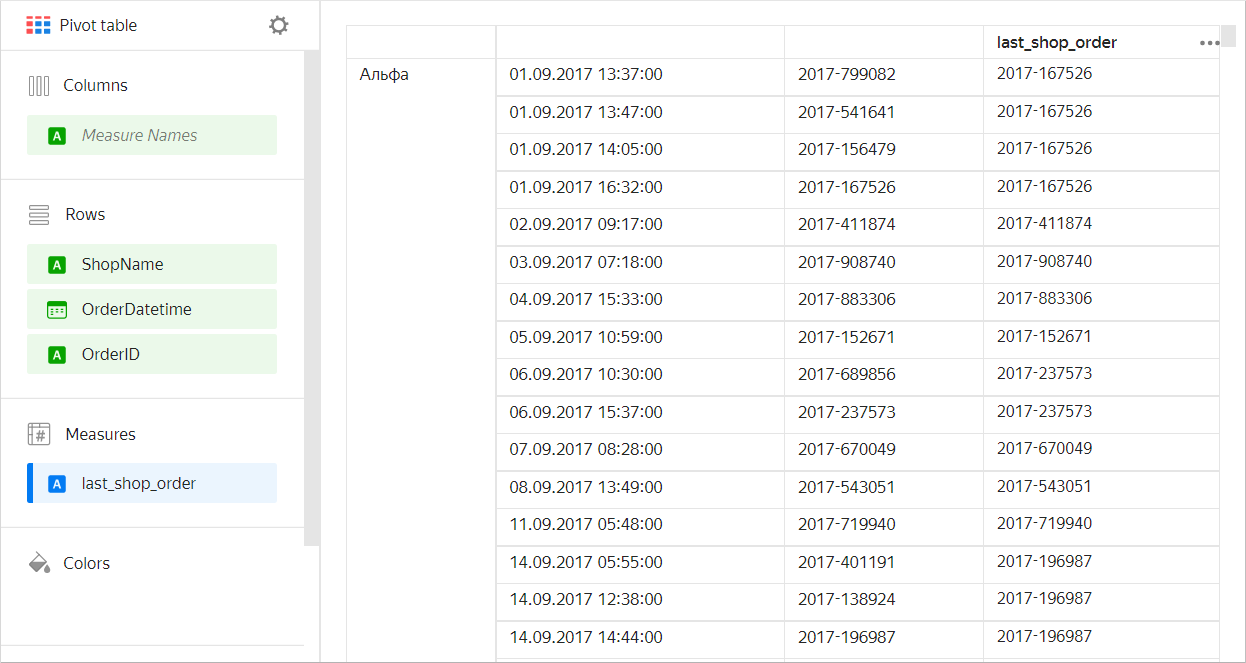
FAQ
How do I order values for a cumulative total or a rolling average calculation?
For functions that depend on the order of entries in the window (e.g., RSUM, MAVG, LAG, LAST, or FIRST) to work correctly, you must specify sorting. You can do this in any of the following ways:
- Drag the dimension or measure to sort the chart by to the Sorting section.
- Set sorting for a specific function using
ORDER BY.
How do I correctly calculate a cumulative total after adding a field to the Colors section?
As an example, let's consider a line chart representing the change in total sales by date (for details, see the Selling table). The cumulative total (IncTotal) is calculated using the RSUM window function: RSUM(SUM([Sales])).
To display the change in the sales amount for each product category, add the Category dimension to the Colors section.
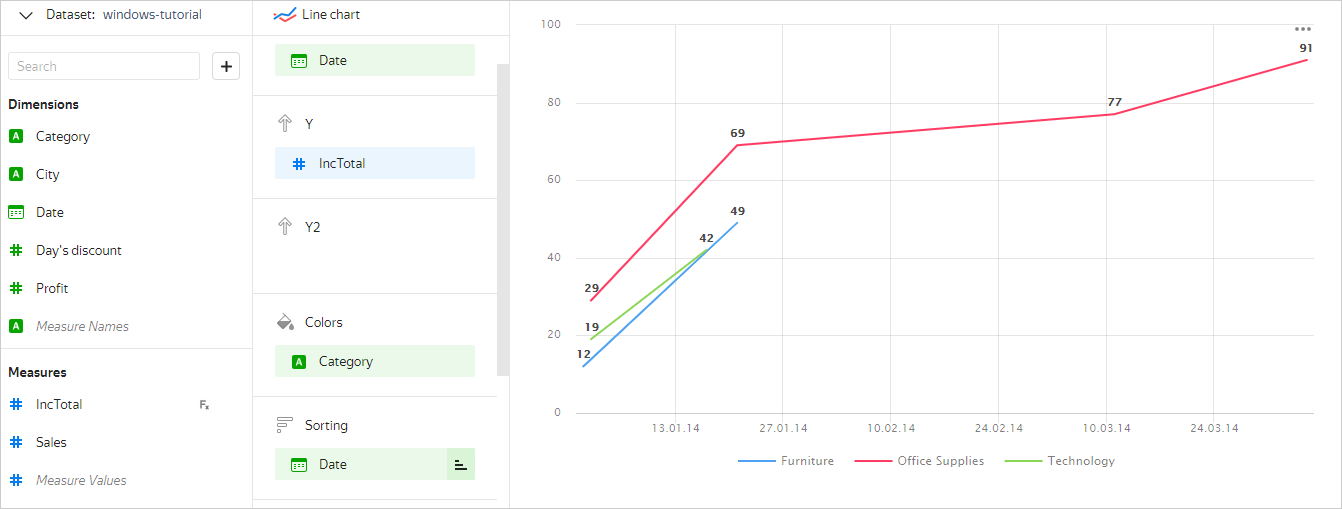
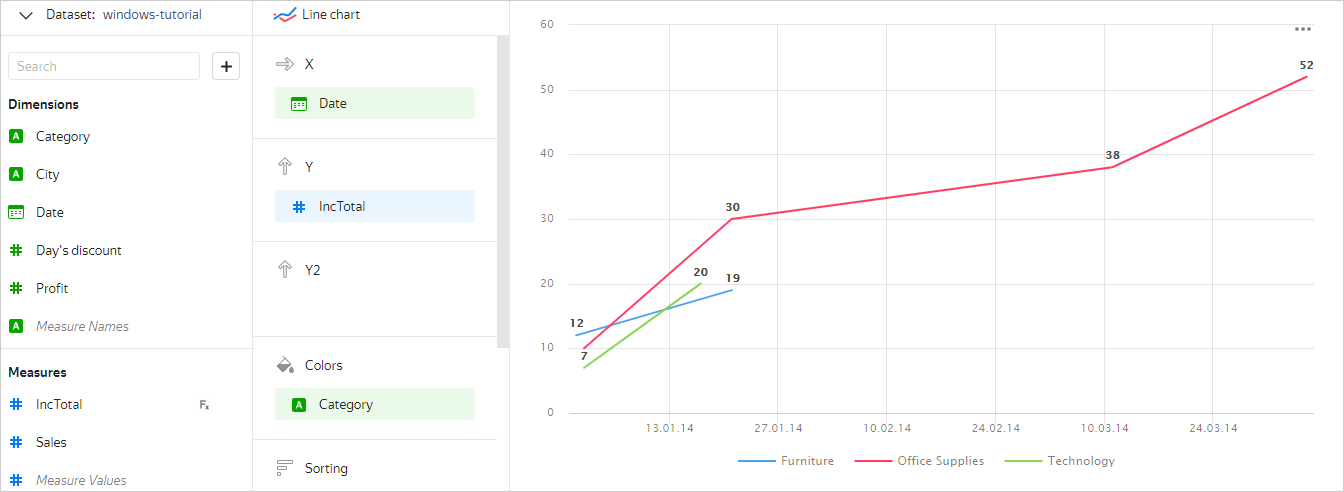
After that, the chart will display a separate graph for each category; however, the totals will be calculated incorrectly: for Furniture, it is 49 instead of 19, for Office Supplies, 91 instead of 52, and for Technology, 42 instead of 20. This is because the dimension in the Colors (Category) section is included in the grouping in the same way as the dimension in the X section (Date). To calculate the amount correctly, you need to add the Category dimension to the WITHIN section or the Date dimension to the AMONG section: RSUM(SUM([Sales]) WITHIN [Category]) or RSUM(SUM([Sales]) AMONG [Date]).
How do I correctly calculate a window function for a grouping by date on a chart?
When adding a grouping (rounding) for a date in the chart, the original field is replaced with an automatically generated one. For example, when rounding to a month, the [Date] dimension is replaced with a new field using the DATETRUNC([Date], "month") formula. Since the original [Date] field disappears from the list of chart dimensions, the window function it is used in no longer works. For the function to work correctly, you need to round the original [Date] dimension in the formula using the DATETRUNC function.