Yandex Tracker: Data export and visualization
Visualizing data from Yandex Tracker with Yandex DataLens allows you to build more advanced analytics than with the Tracker tools.
To visualize data from Tracker in DataLens:
- Set up regular export of data to an external storage.
- Visualize the required metrics and data using DataLens.
To visualize your data, follow these steps:
- Get your cloud ready.
- Create a database for storing your Tracker data.
- Create an OAuth token to access Tracker.
- Create a function in Cloud Functions for importing data.
- Create a connection to DataLens.
- Create a dataset.
- Create a chart.
- Create a dashboard in DataLens and add charts to it.
Getting started
Note
We recommend creating a separate Tracker account to use the service.
Sign up for Yandex Cloud and create a billing account:
- Navigate to the management console and log in to Yandex Cloud or create a new account.
- On the Yandex Cloud Billing page, make sure you have a billing account linked and it has the
ACTIVEorTRIAL_ACTIVEstatus. If you do not have a billing account, create one and link a cloud to it.
If you have an active billing account, you can create or select a folder for your infrastructure on the cloud page.
Learn more about clouds and folders here.
Required paid resources
- Continuously running Managed Service for ClickHouse® cluster (see Managed Service for ClickHouse® pricing).
- Using the function in Cloud Functions (see Cloud Functions pricing).
If you no longer need the resources you created, delete them.
Create a database for storing your Tracker data
- Navigate to the management console.
- Navigate to Managed Service for ClickHouse.
- Click Create ClickHouse cluster.
- Specify the cluster parameters:
- Basic parameters:
- Environment:
PRODUCTION - Version:
22.8 LTS
- Environment:
- Resources:
- Platform:
Intel Ice Lake - Type:
standart - Host class:
s3-c2-m8 (2 vCPU, 8 GB)
- Platform:
- Storage size:
30 GB - Hosts:
- Public access:
Enabled
- Public access:
- DBMS settings:
- User management via SQL:
Disabled - Managing databases via SQL:
Disabled - Username:
tracker_data - DB name:
db1
- User management via SQL:
- Service settings:
- DataLens access:
Enabled - Serverless access:
Enabled
For the full list of settings, see Managed Service for ClickHouse® settings.
- DataLens access:
- Basic parameters:
- Click Create cluster. Wait for the new cluster status to change to
Alive. - Copy and save the host name for further Cloud Functions setup.
Create an OAuth token to access Tracker
-
Go to the Create an app page.
-
In the What app do you want to create? window, leave
For user authorizationand click Proceed to creation. If you see a verification window for your Public Services Portal account, close it. -
In the Create app window:
- Enter your Service name.
- Add an icon for your service.
- Specify the email address for notifications about changes in external authorization.
Click Next.
-
In the App platforms window, select
Web services. In the Redirect URI field, specify the URL where to redirect the user after they have allowed or denied access to the app, or enterhttps://oauth.yandex.ru/verification_codefor debugging.Click Next.
-
In the User data access permissions window, under Additional, specify:
Read from trackerWrite to tracker
Click Next.
-
Check the data and click Everything is correct, create app.
-
Copy the app ID from the ClientID field.
-
In the window that opens, enter the following URL in the browser search bar:
https://oauth.yandex.ru/authorize?response_type=token&client_id=<app_ID>Where
client_idis the new app ID copied from the ClientID field. -
Log in under the Tracker account you will use for data visualization.
-
Save the OAuth token you got.
Create a function in Cloud Functions for importing data
- Navigate to the management console.
- Navigate to Cloud Functions.
- Click Create function.
- Specify a name for the function and click Create.
- In the Editor window that opens, select the
Pythonruntime environment. - Click Continue.
- In the Code source field, click ZIP archive.
- Attach a test archive.
- In the Entry point field, specify
tracker_import.handler. - Under Parameters, specify:
- Timeout:
60 - Memory:
1024 - Environment variables:
-
TRACKER_ORG_ID: ID of the Yandex 360 for Business organization.Note
If you are using a Yandex Identity Hub organization (you can check this on the administration page), replace the
X-Org-IDheader withX-Cloud-Org-Idin thetracker_import.pyfunction code. -
TRACKER_OAUTH_TOKEN: Tracker account OAuth token. -
CH_HOST: Host name. -
CH_DB: Database name. -
CH_USER: Username. -
CH_PASSWORD: Password. -
CH_ISSUES_TABLE:tracker_issues. -
CH_CHANGELOG_TABLE:tracker_changelog. -
TRACKER_INITIAL_HISTORY_DEPTH:1d. -
CH_STATUSES_VIEW:v_tracker_statuses.
-
- Timeout:
- Click Save changes.
- In the Testing tab, click Run test.
- The test result is a data import log:
{ "statusCode": 200, "headers": { "Content-Type": "text/plain" }, "isBase64Encoded": false, "body": "OK" } - Create a trigger to regularly export new data to the database:
- Open the Cloud Functions section.
- Click → Create trigger.
- Set the trigger type to Timer.
- In the Cron expression field, select
Every day. - Under Function settings, click Create.
- Enter the account name. By default, the account has the
functions.functionInvokerrole to work with the trigger. - Click Create.
- Click Create trigger.
Create a connection in DataLens
-
Open the Managed Service for ClickHouse® cluster.
-
On the left side of the window, select DataLens.
-
Click Create connection.
-
Set up your connection:
-
Connection:
Select in folder. -
Cluster: Cluster specified when creating the database.
-
Hostname: Host specified when creating the database.
-
HTTP interface port:
8443. -
Username: Username specified when creating the database.
-
Password: Password specified when creating the database.
-
Cache TTL in seconds:
Default. -
Raw SQL level:
Forbid. -
HTTPS:
Enabled.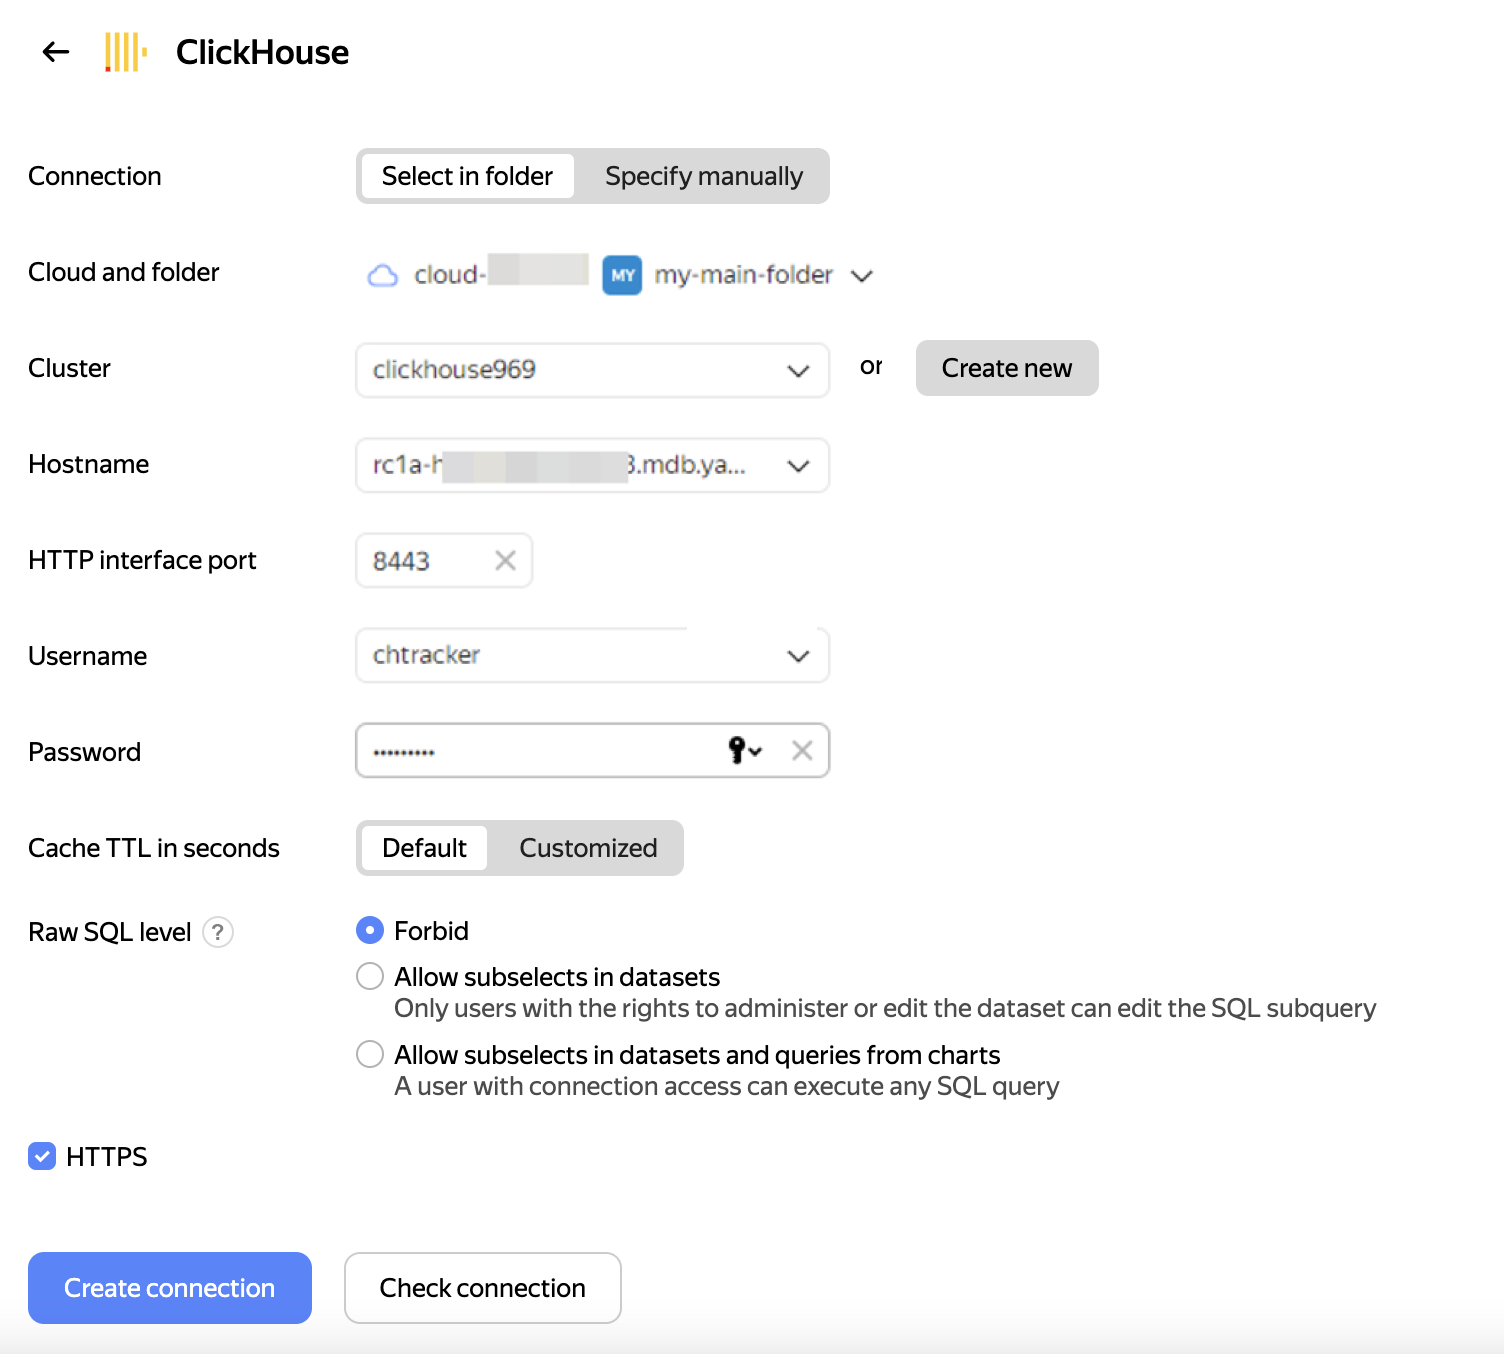
-
-
Click Create connection.
Create a dataset
- Go to the DataLens home page.
- Click Start in cloud.
- Go to the connections page.
- Select the connection.
- In the top-right corner, click Create dataset.
- Drag one or multiple tables to the workspace:
db1.v_tracker_issues: Current (most recent) issue slice.db1.v_tracker_changelog: Issue parameter change history.Db1.v_tracker_statuses: Status transition time based on the issue change history.
- Click Save.
Create a chart
-
Go to the DataLens home page.
-
In the left-hand panel, click Charts.
-
Click Create chart → Chart in Wizard.
-
In the top-left corner, click Select dataset.
-
In the Datasets drop-down list, select the dataset you created in the previous step.
-
On the top panel, select the visualization type. By default, the Column chart type is selected.
Create a dashboard and add charts to it
-
In the left-hand panel, click Dashboards.
-
Click Create dashboard.
-
At the top of the dashboard page, click Add→ Chart.
-
Fill in the widget parameters. Pay close attention to the following fields:
- Name: It sets the widget name. It is displayed at the top of the widget.
- Chart: It sets the widget you are adding.
- Description: It sets the widget description. It is displayed at the bottom of the widget.
- Auto height: It sets the automatic height for a widget of the Table or Markdown type. If it is disabled, you can set the widget height on the page using the mouse.
-
Click Add. The widget will appear on the dashboard.
-
Save the dashboard:
- In the top-right corner of the dashboard, click Save.
- Enter a name for the dashboard and click Create.
For more information about setting up dashboards, see this section.
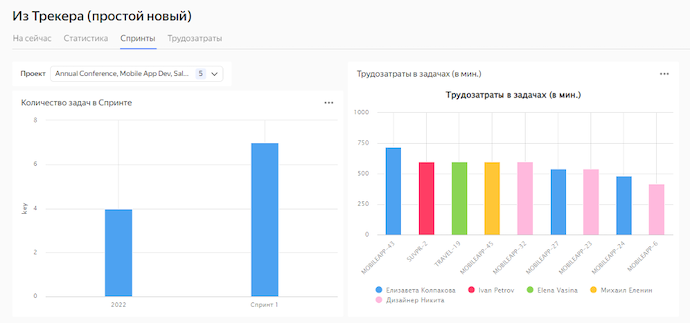
Example of a dashboard based on data from the v_tracker_issues table
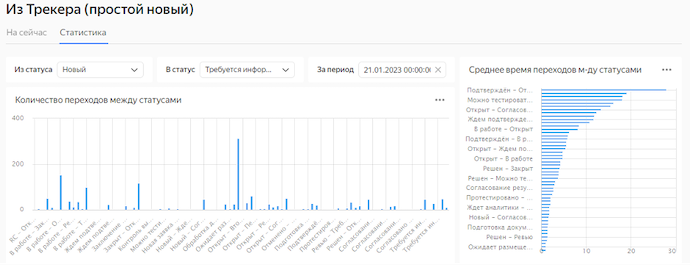
Example of a dashboard based on data from the db1.v_tracker_statuses table
How to delete the resources you created
To stop paying for the resources you created:
ClickHouse® is a registered trademark of ClickHouse, Inc.