Retail chain's dashboard based on a ClickHouse® database
Note
In this tutorial, all objects will be created and stored in a workbook. If using legacy folder navigation, create an individual folder to work in.
Create a folder
- Go to the DataLens home page.
- In the left-hand panel, select All objects or Personal folder.
- In the top-right corner, click Create → Folder.
- Enter a name for the folder.
- Click Create.
In this tutorial, you will set up a dashboard to visualize sales analytics for a Moscow retail chain. This dashboard will present:
- Sales dynamics by day and month.
- Sales by product categories.
- Heat map of orders.
As our data source, we will use a ClickHouse® demo database with a Moscow retail chain's sales data.
To visualize and explore data, set up DataLens and follow the steps below:
- Create a workbook.
- Create a connection.
- Create a dataset.
- Create a line chart.
- Create a bar chart.
- Create a pivot table chart.
- Create a heat map chart.
- Create a dashboard and add charts to it.
- Add selectors to the dashboard.
Getting started
To get started with DataLens:
- Log in to your Yandex account. If you do not have an account, create one.
- Open the DataLens home page.
- Click Start in cloud.
- Confirm that you have read the Terms of use and click Log in.
-
Log in to your Yandex account.
-
Open the DataLens home page.
-
Click Start in cloud.
-
Select one of these options:
-
If you already have an organization, select it from the drop-down menu in the Organizations tab and click DataLens.
Note
To activate a DataLens instance, the user must have the
adminorownerrole. For more information about roles, see Access management in Yandex Identity Hub. -
If you have a cloud but no organization, click Add new DataLens. In the window that opens, enter a name and description for your organization and click Create organization and DataLens. For more information about working with organizations, see Getting started with organizations.
-
If you encounter a technical issue with the service, contact Yandex Cloud support. To ask for advice, discuss a solution to your issue, or explore current best practices, join the DataLens chat in Telegram.
Create a workbook
- Go to the DataLens home page.
- In the left-hand panel, select Collections and workbooks.
- In the top-right corner, click Create → Create workbook.
- Enter
Tutorialsfor the workbook name. - Click Create.
Create a connection
A connection named Sample ClickHouse will be created for database access.
-
In the top-right corner of the workbook, click Create → Connection.
-
Under Databases, select the ClickHouse® connection.
-
In the window that opens, select
Specify manuallyfor the connection type and provide the following connection parameters:- Host name:
rc1a-ckg8nrosr2lim5iz.mdb.yandexcloud.net - HTTP interface port:
8443(default). - Username:
samples_ro. - Password:
MsgfcjEhJk.
- Host name:
-
Enable the SQL to read option.
-
Click Check connection and make sure you get a green check mark.
-
Click Create connection.
-
Enter the connection name:
Sample ClickHouse. -
Click Create.
-
Wait for the connection to be saved.
Create a dataset
Create a dataset based on the Sample ClickHouse connection:
-
In the top-right corner of the connection page, click Create dataset.
-
Drag the
MS_SalesFactstable to the workspace.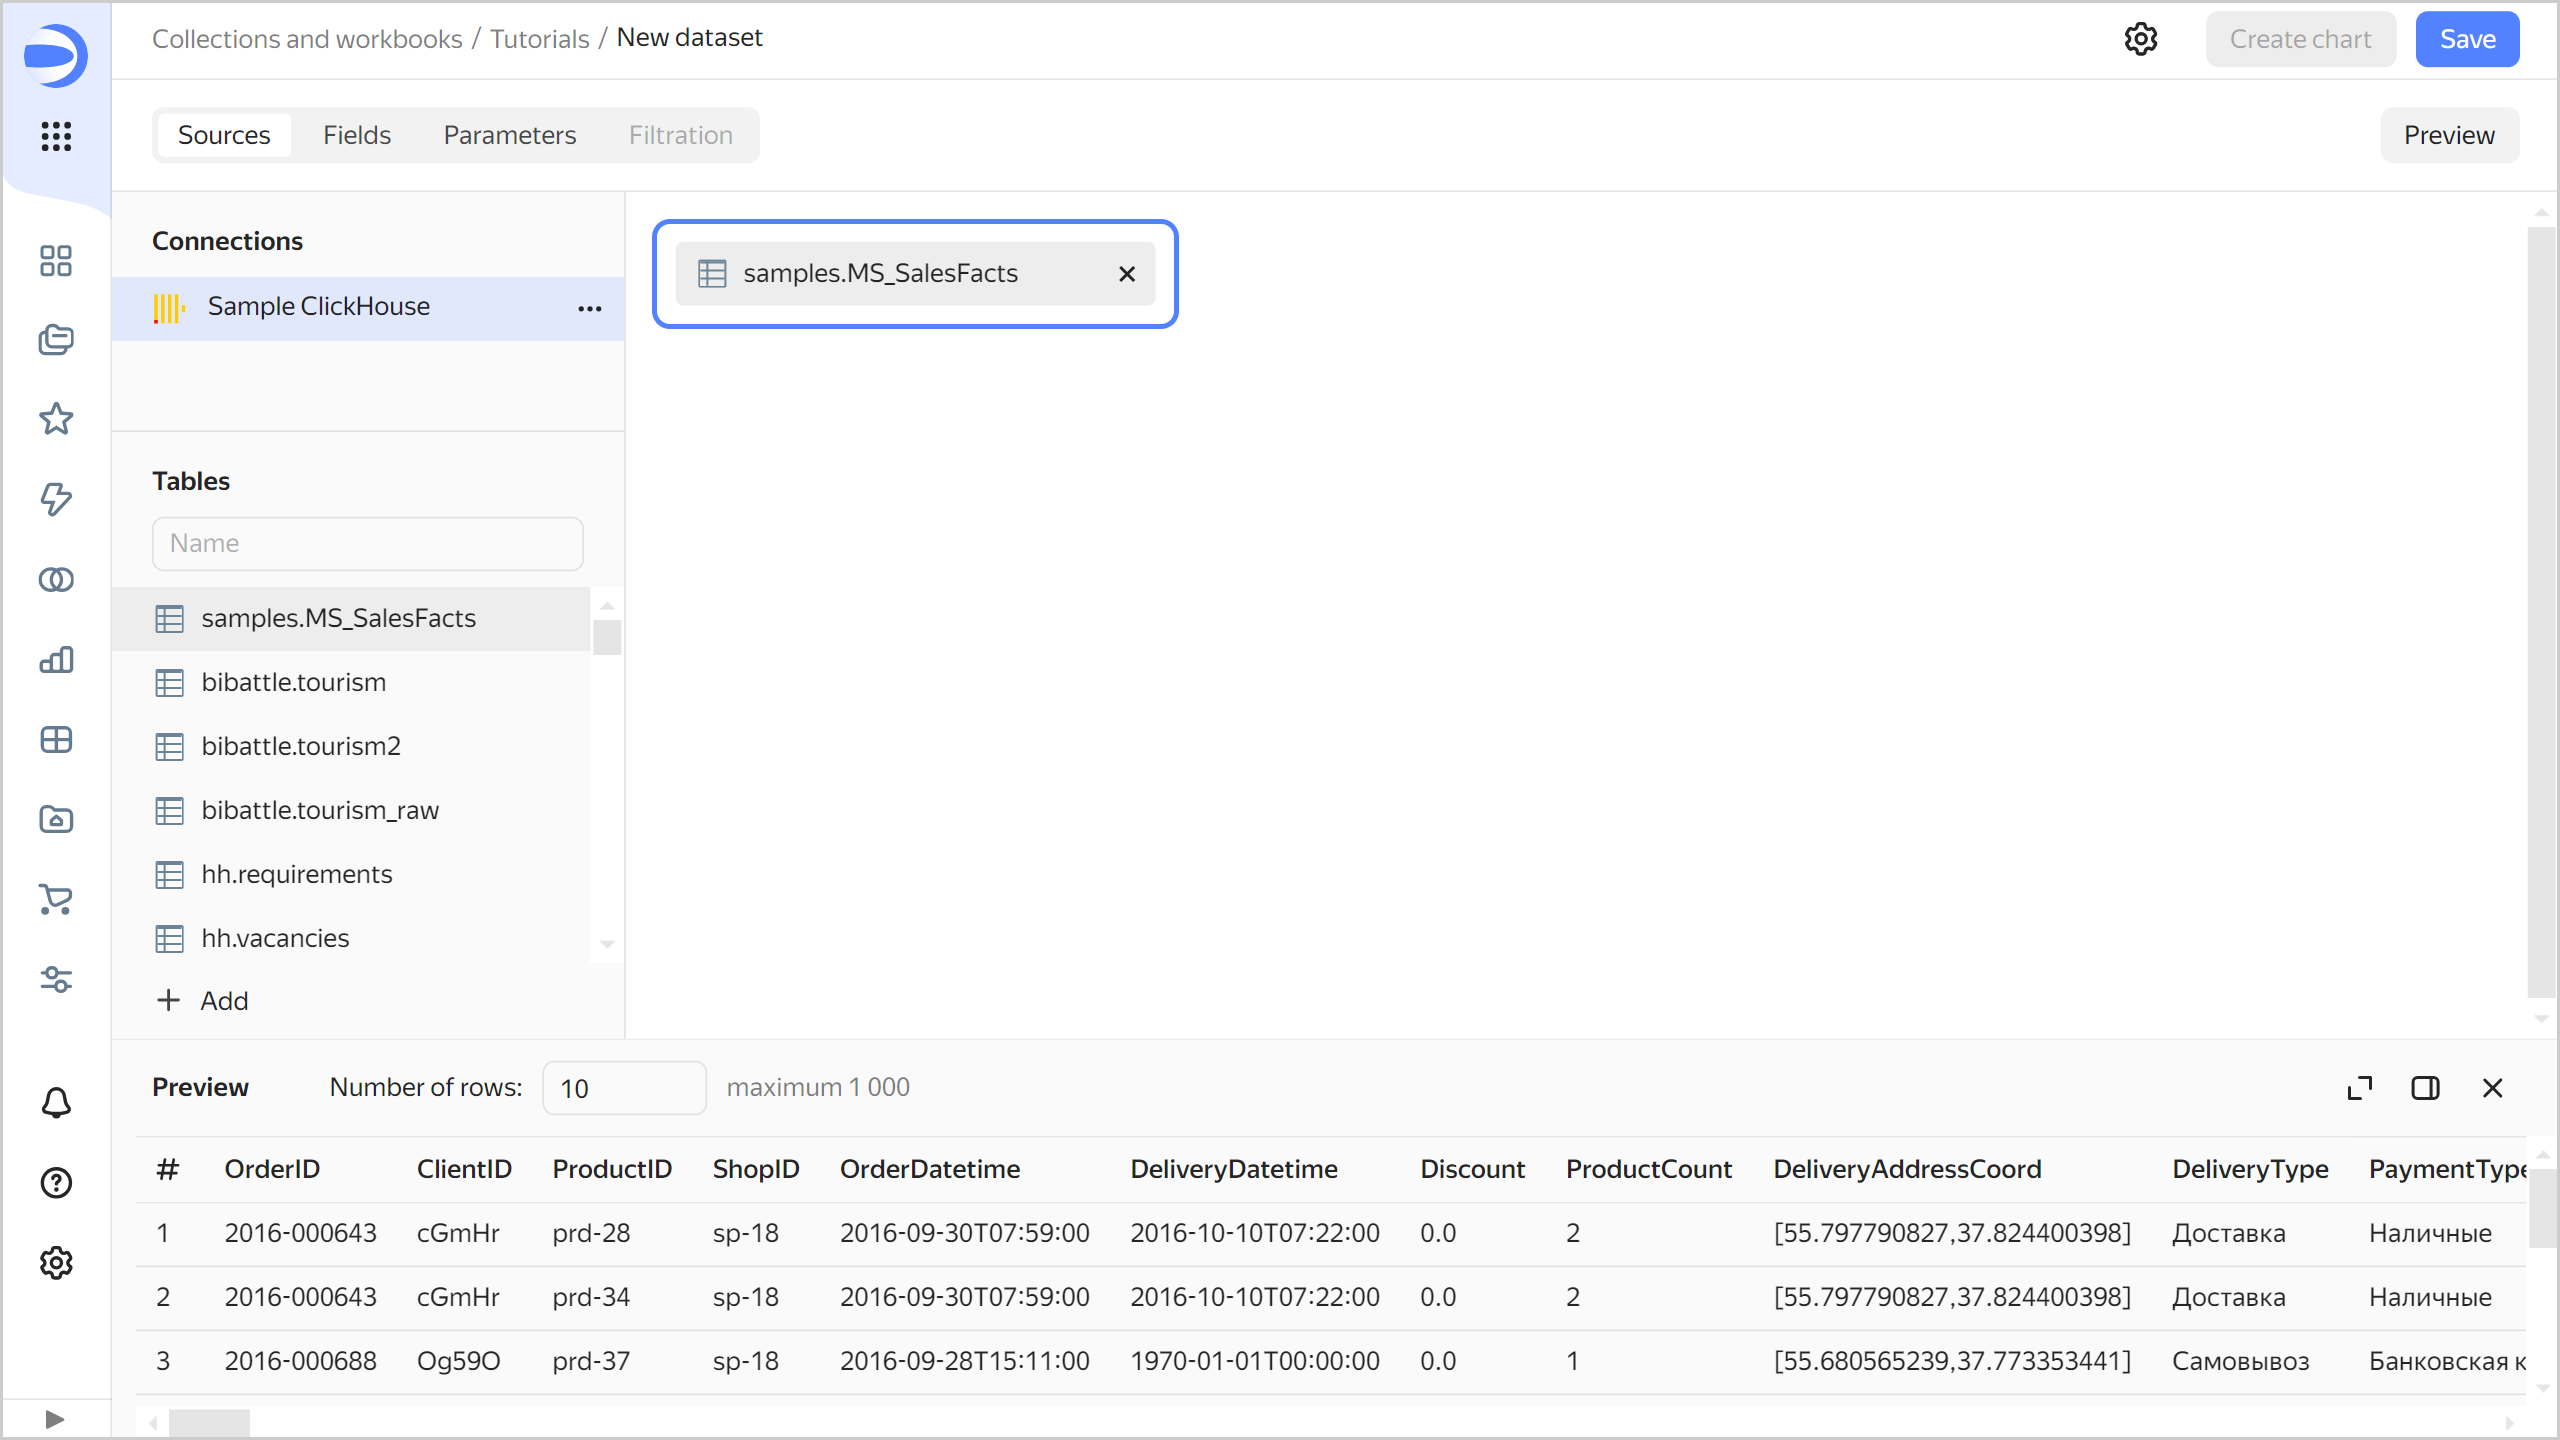
-
Drag the
MS_Clientstable to the workspace. The tables will be linked together automatically.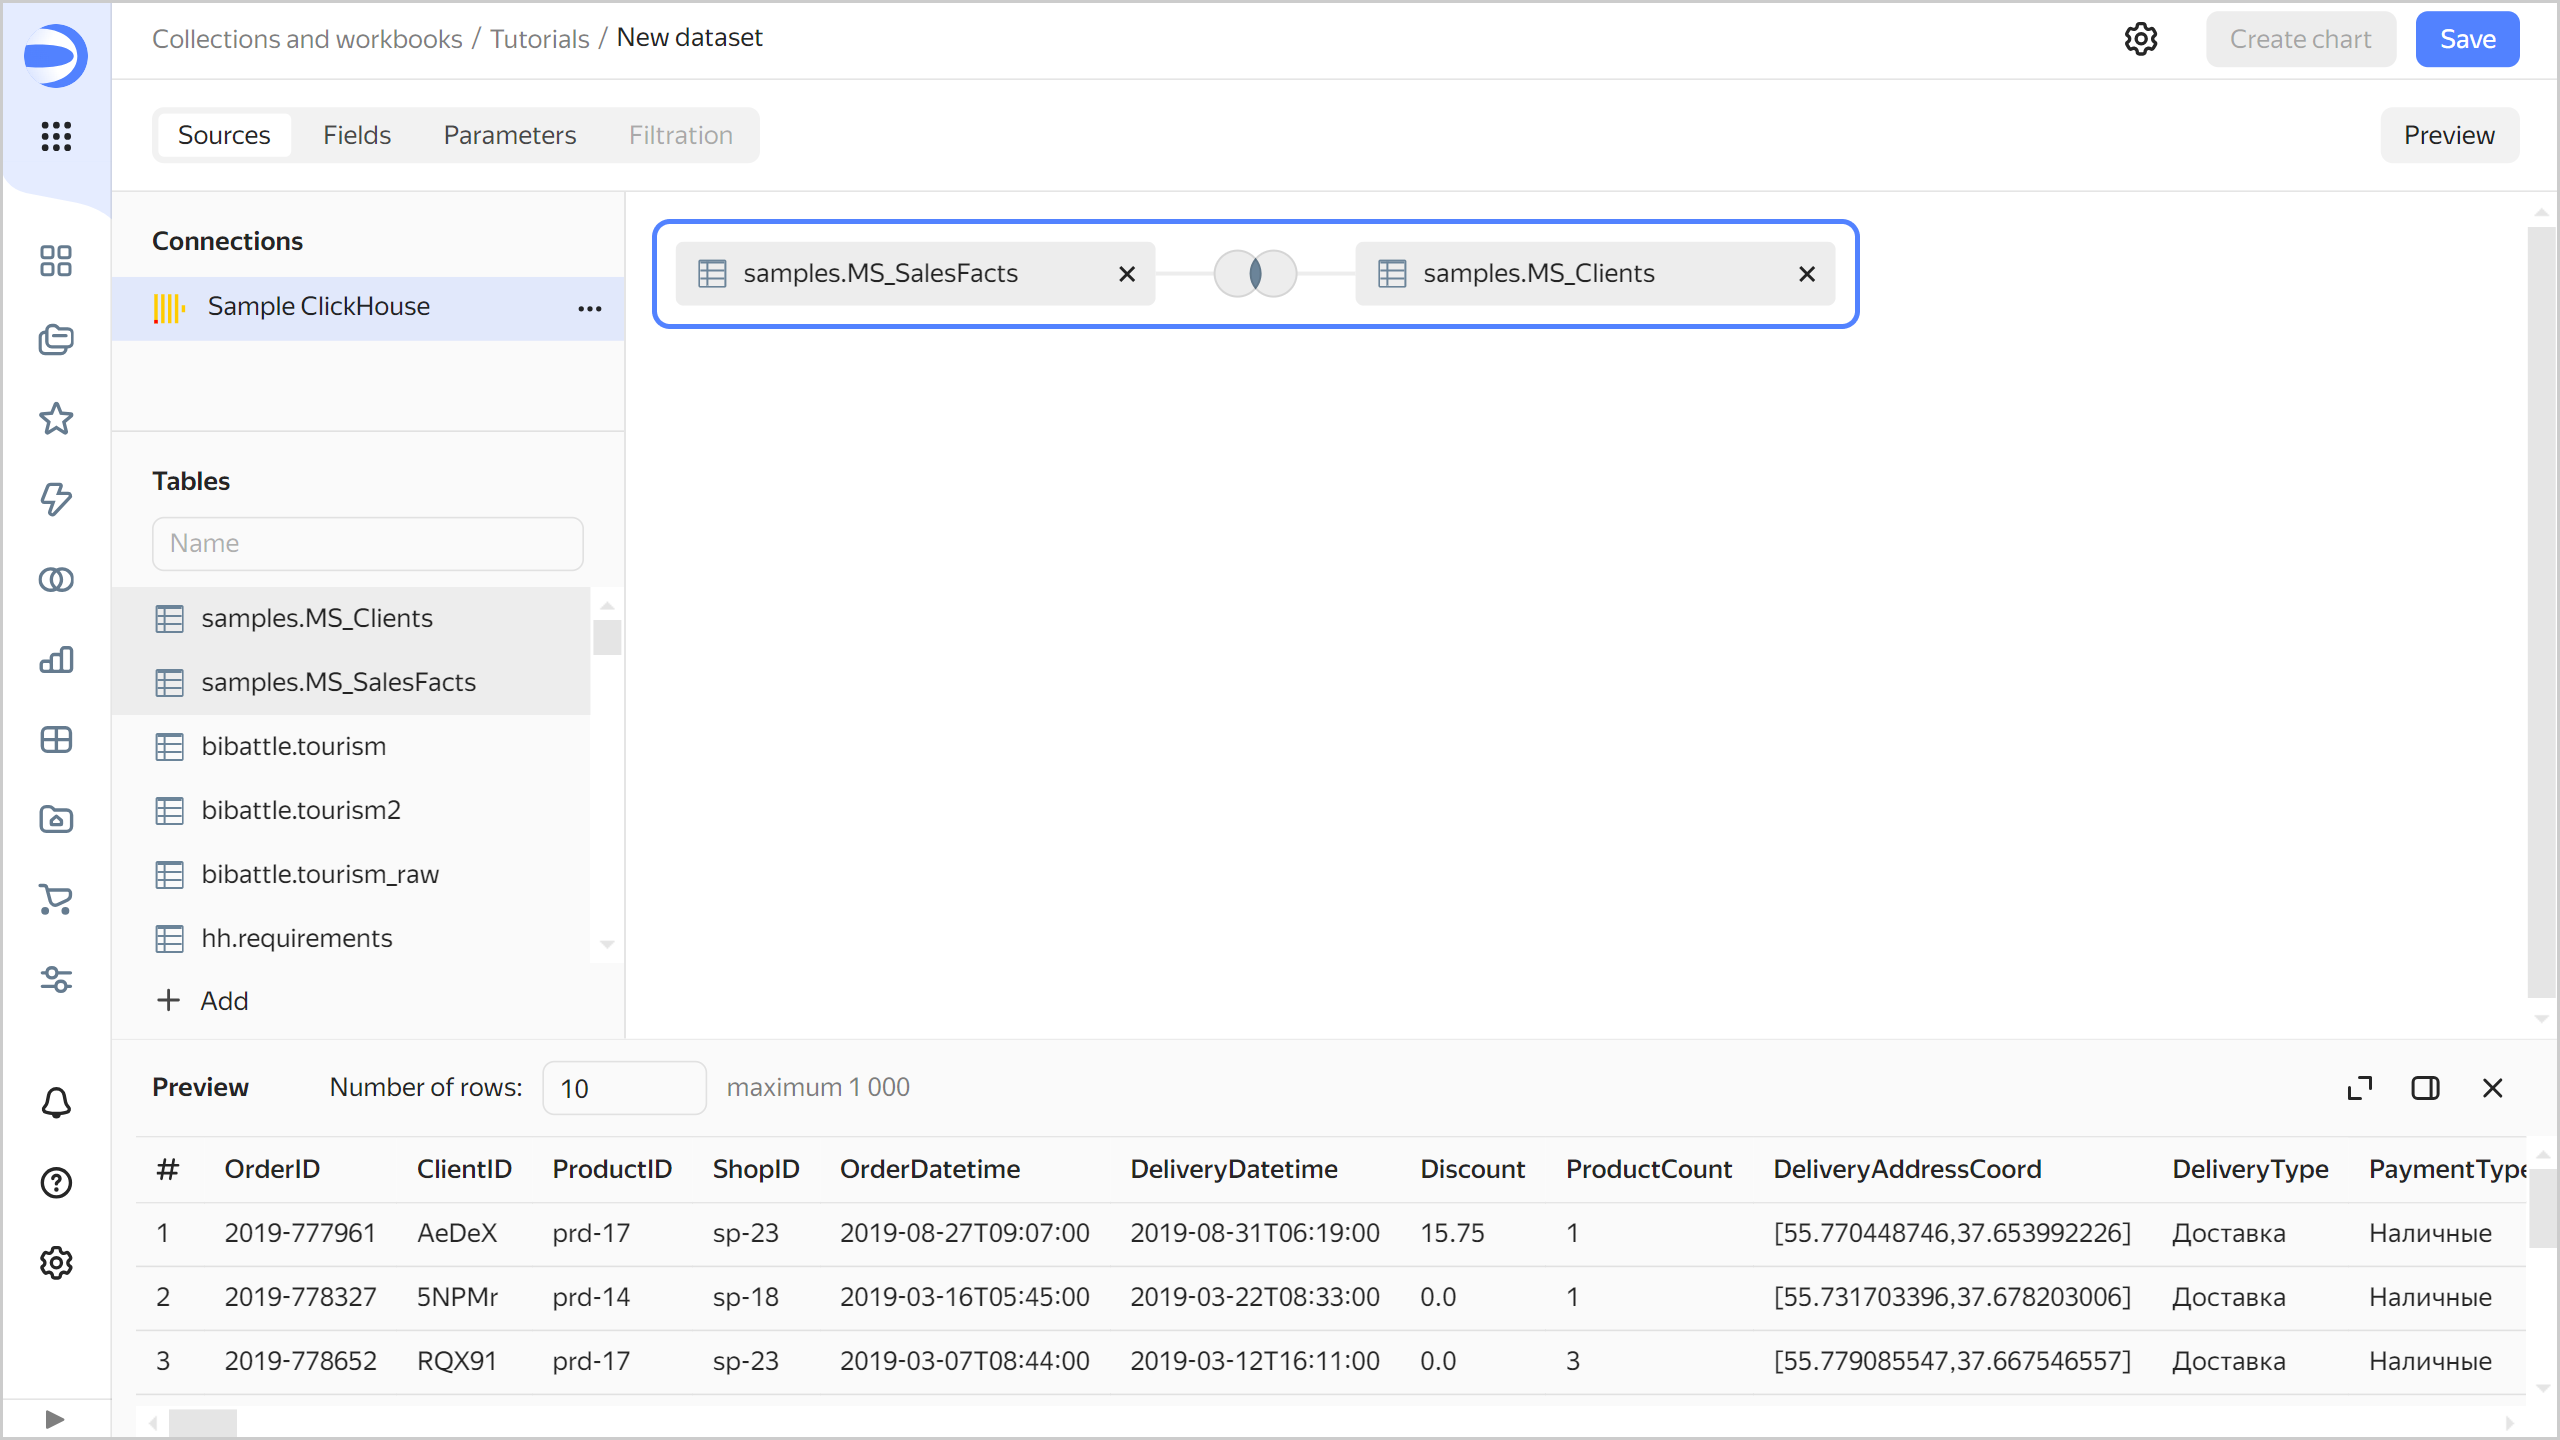
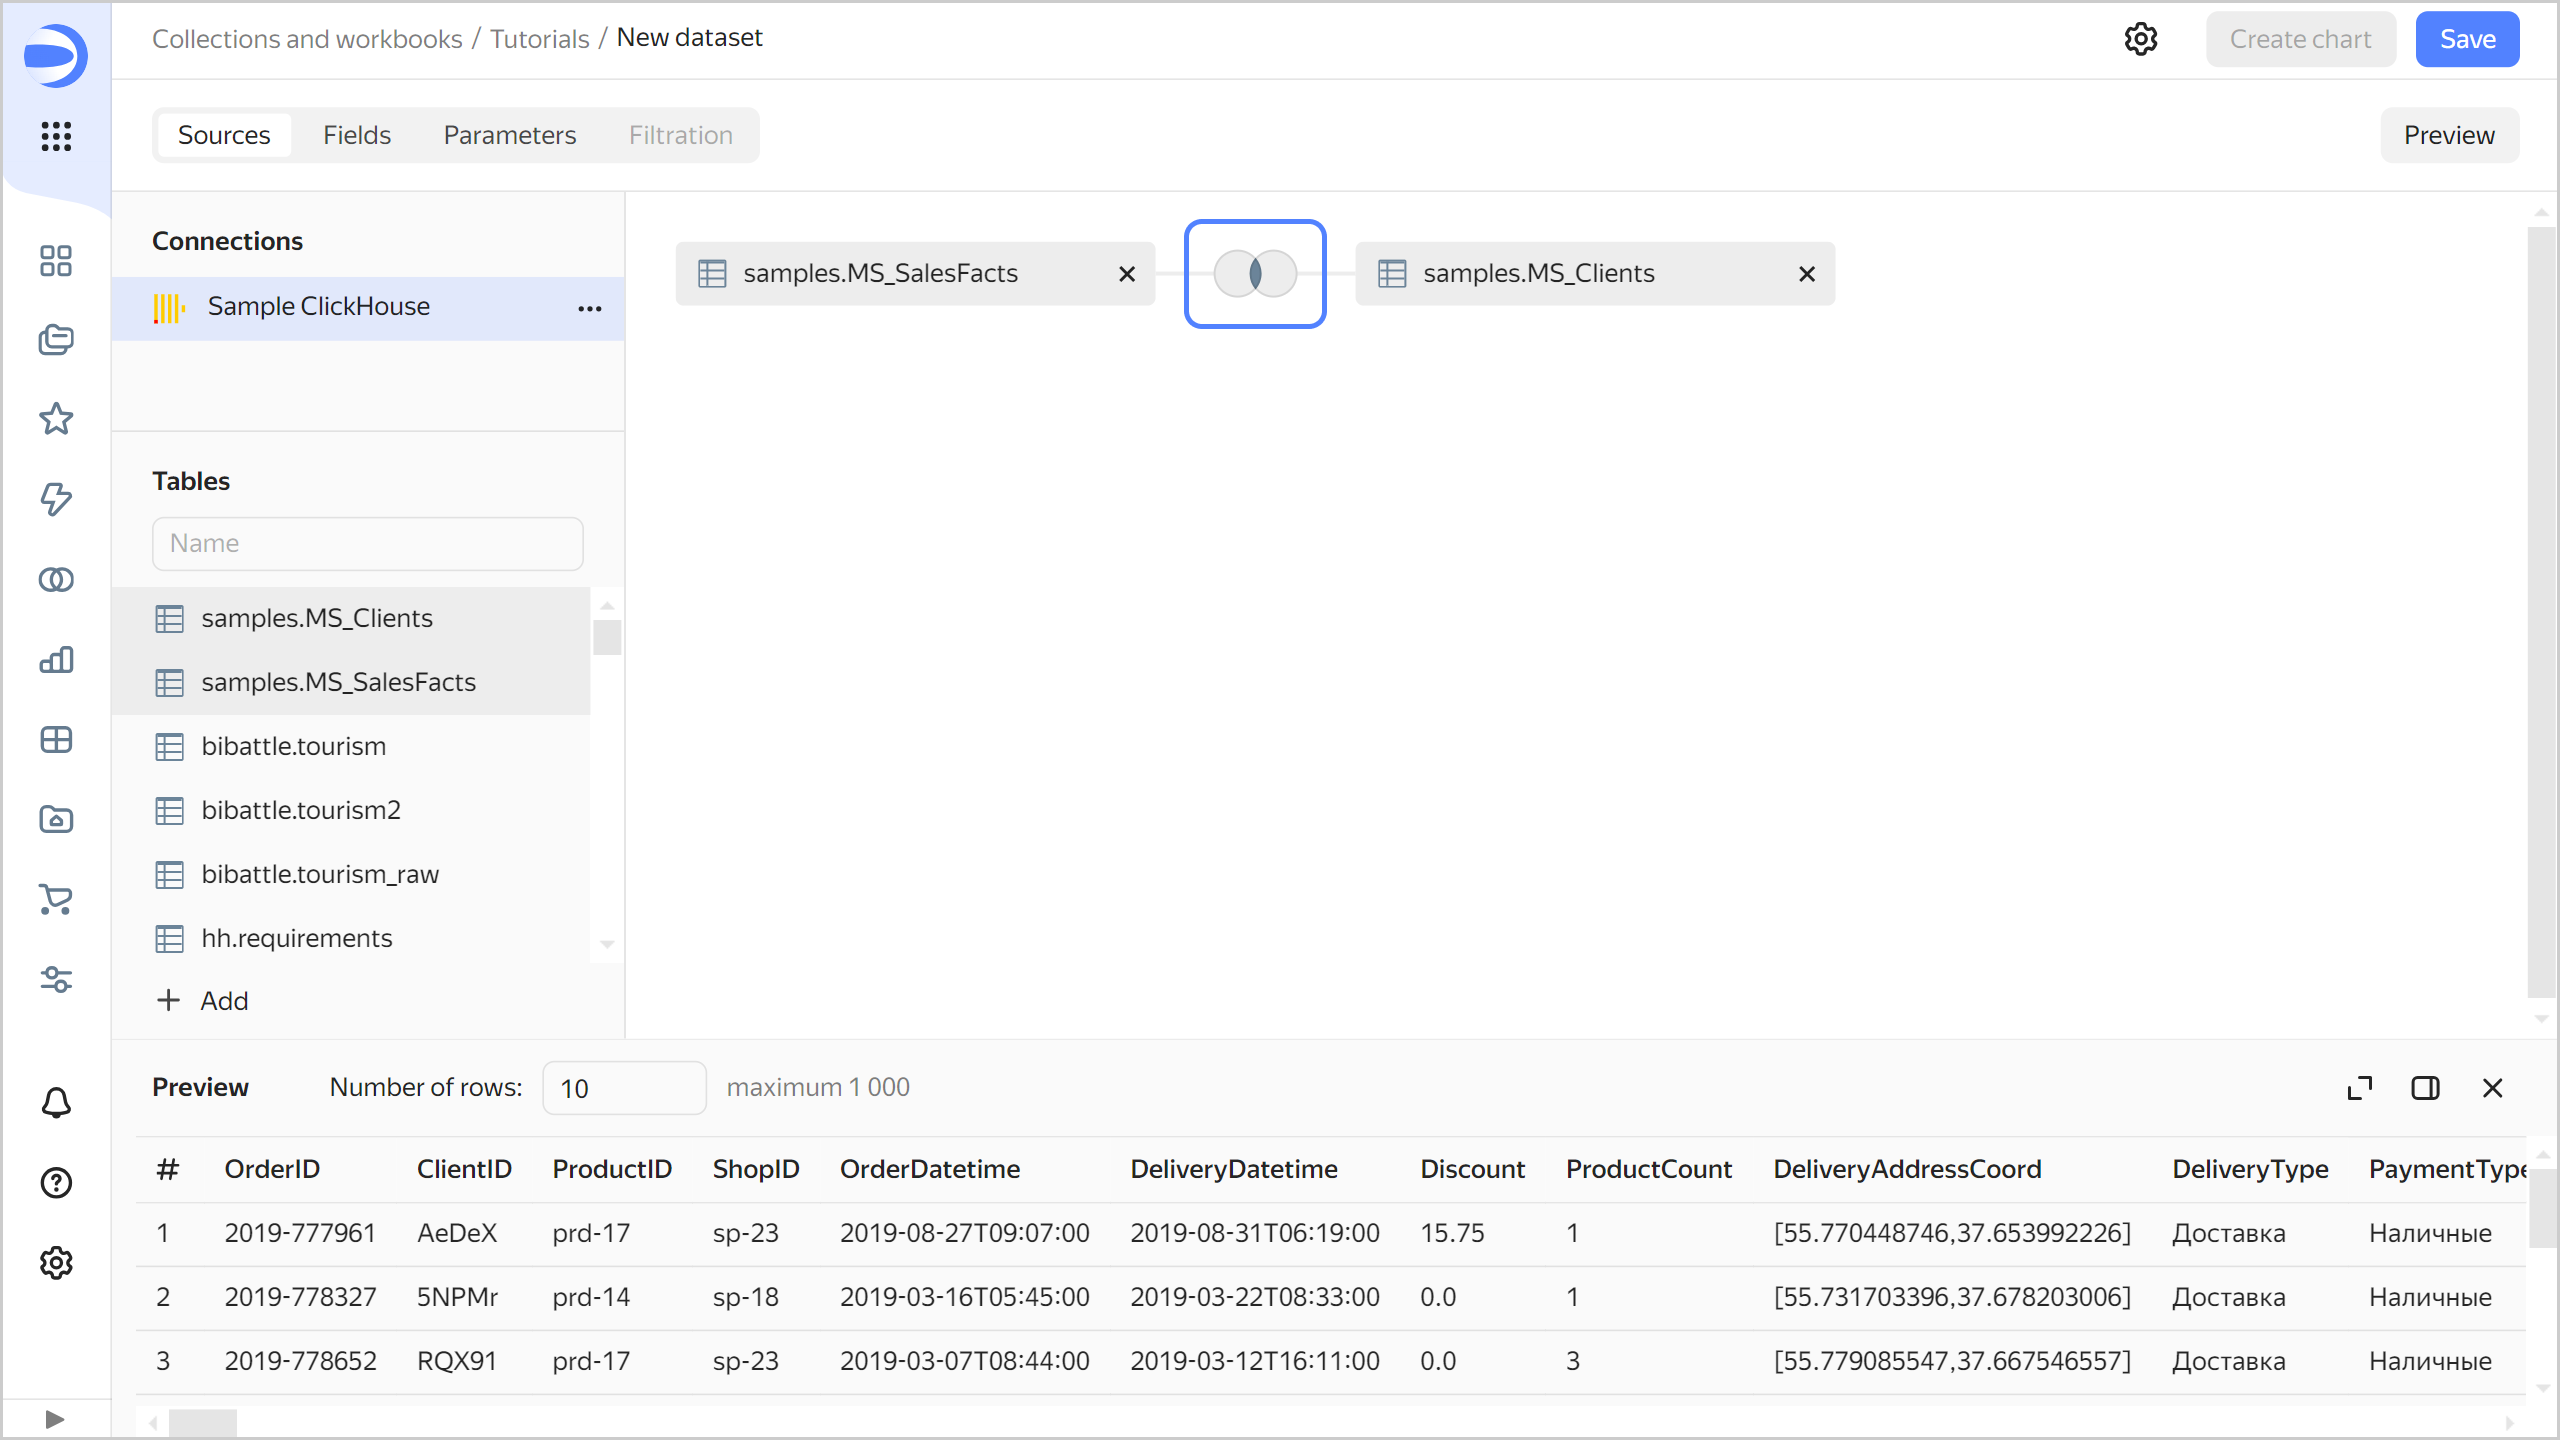
-
To check the link, click the link icon between the tables.
-
The tables are linked by the
ClientIDfield. You can edit or expand the link by specifying another pair of fields, if you need. To close the link settings window, click or anywhere outside the window.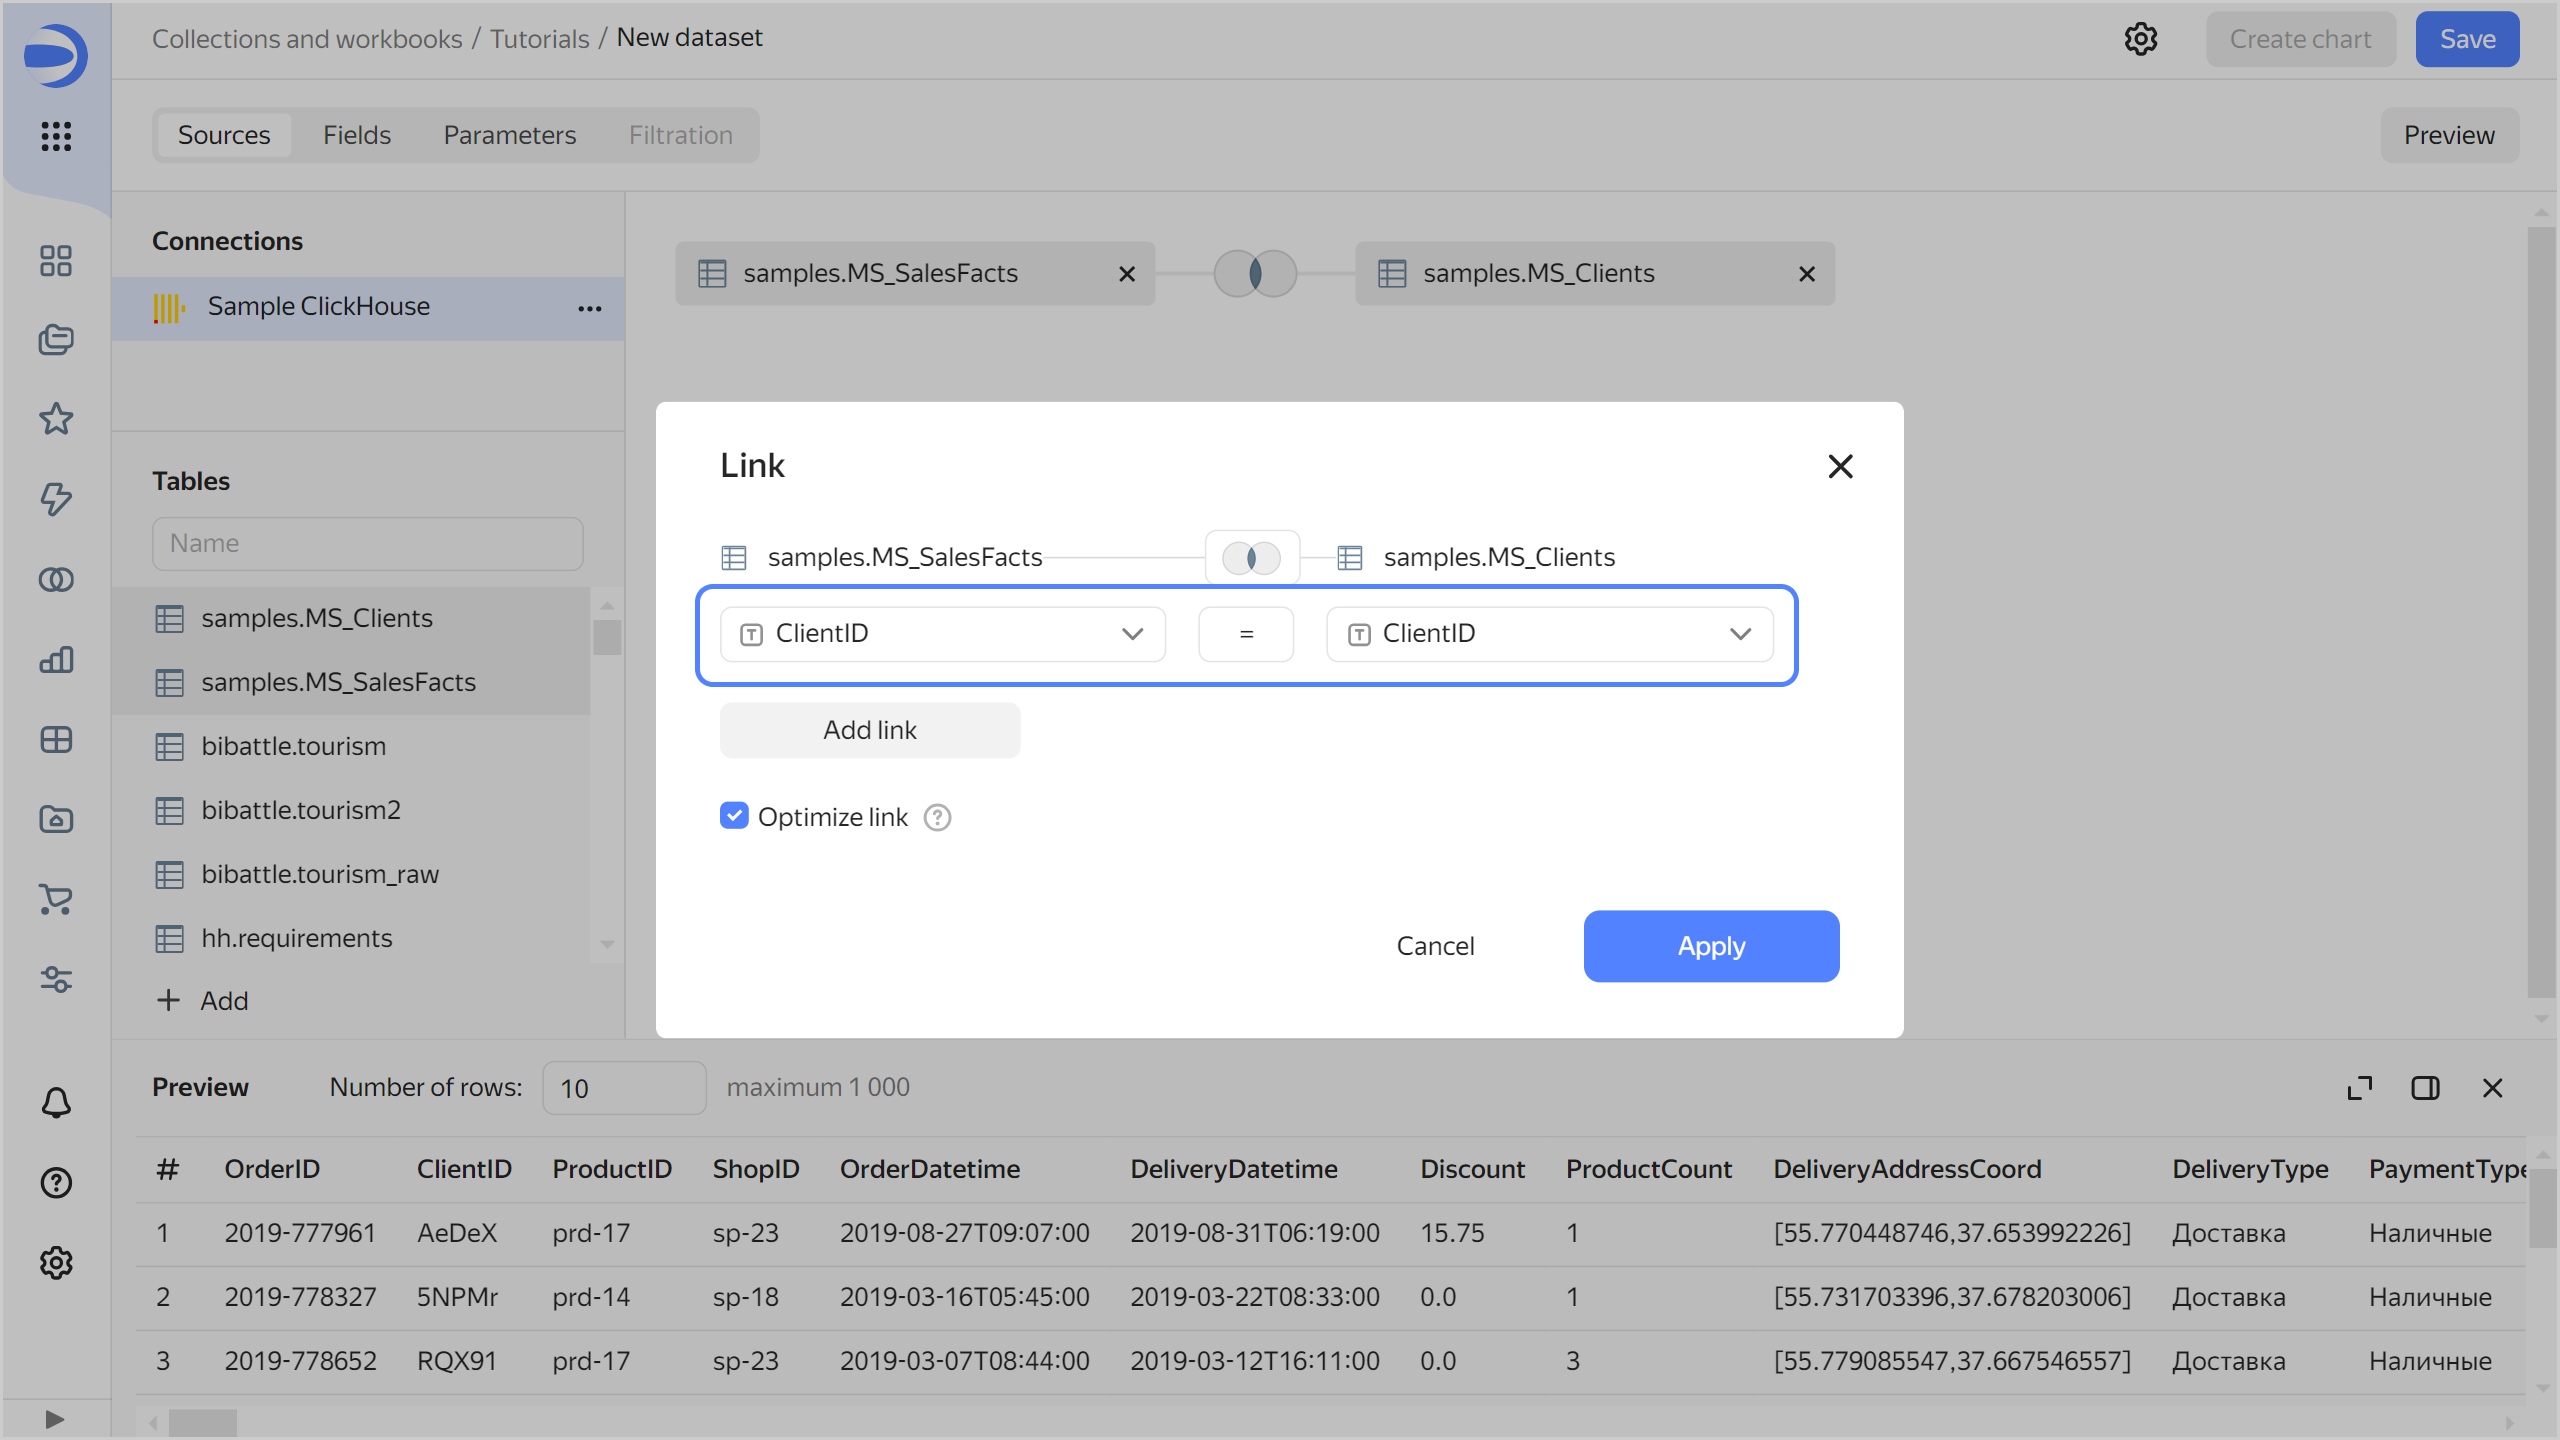
-
Drag the
MS_Productstable to the workspace. The table will automatically link with the left (root)MS_SalesFactstable.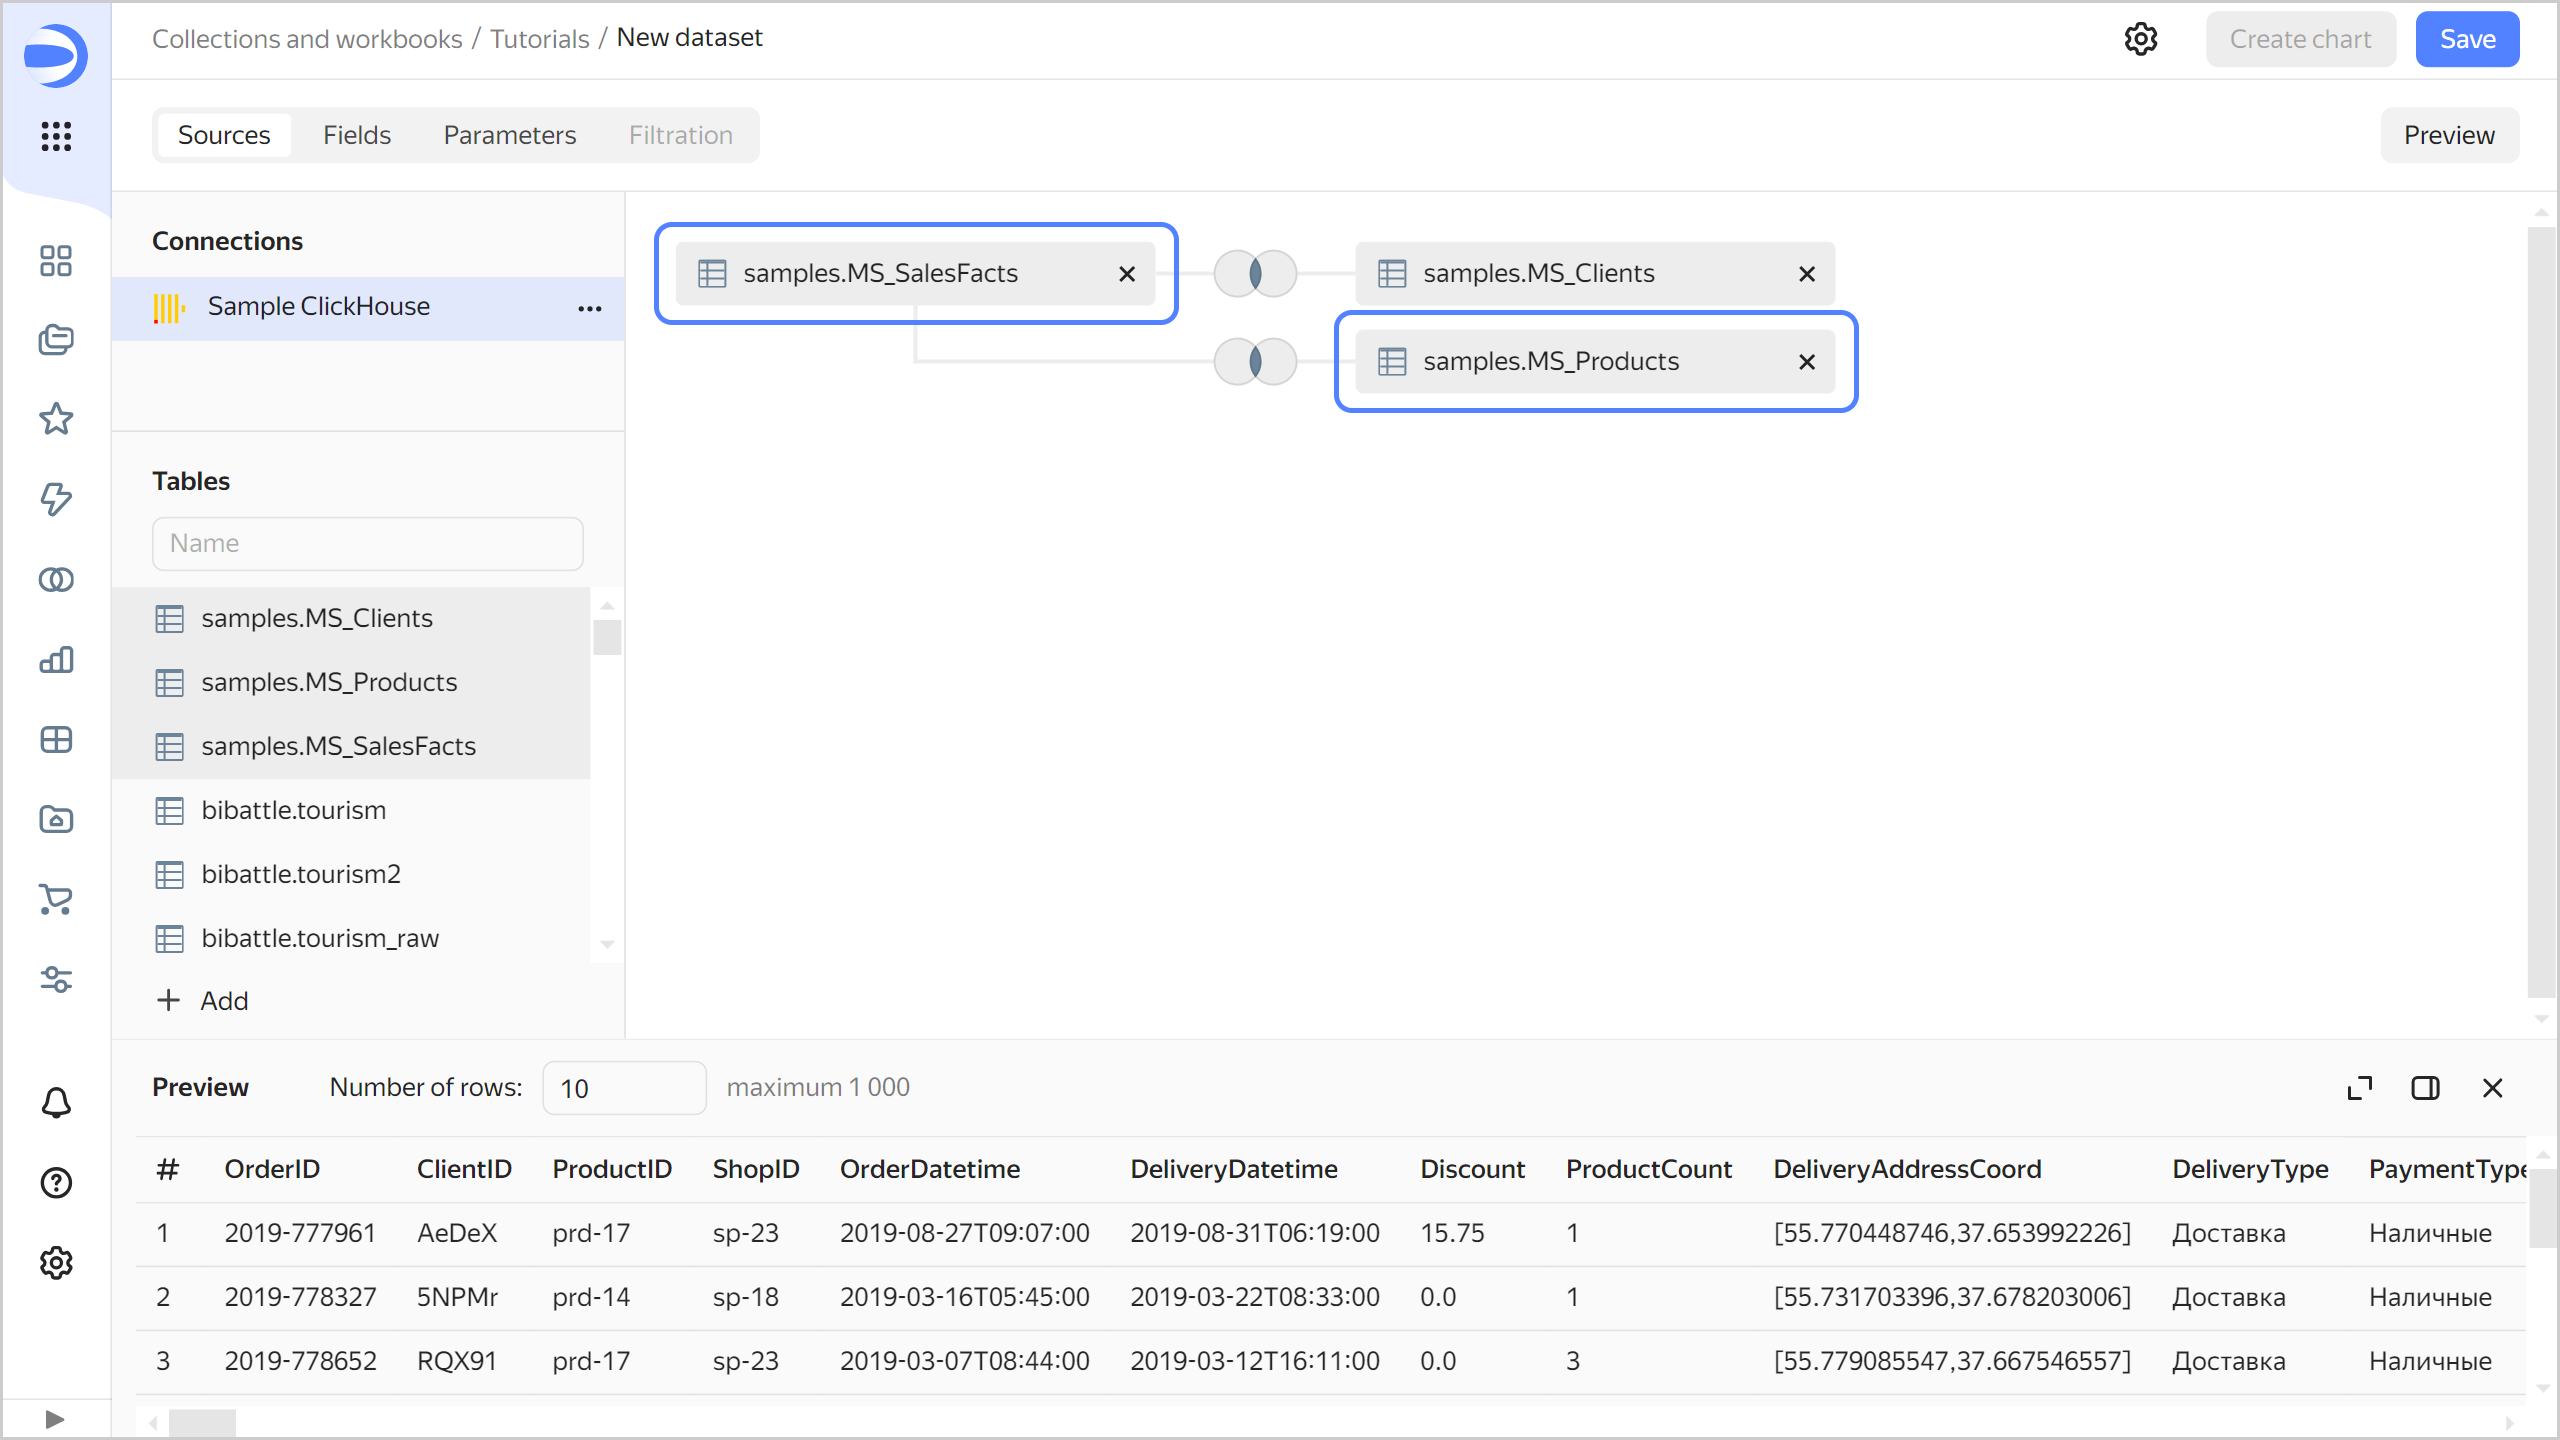
-
Drag the
MS_Shopstable to the workspace. The table will automatically link with the left (root)MS_SalesFactstable.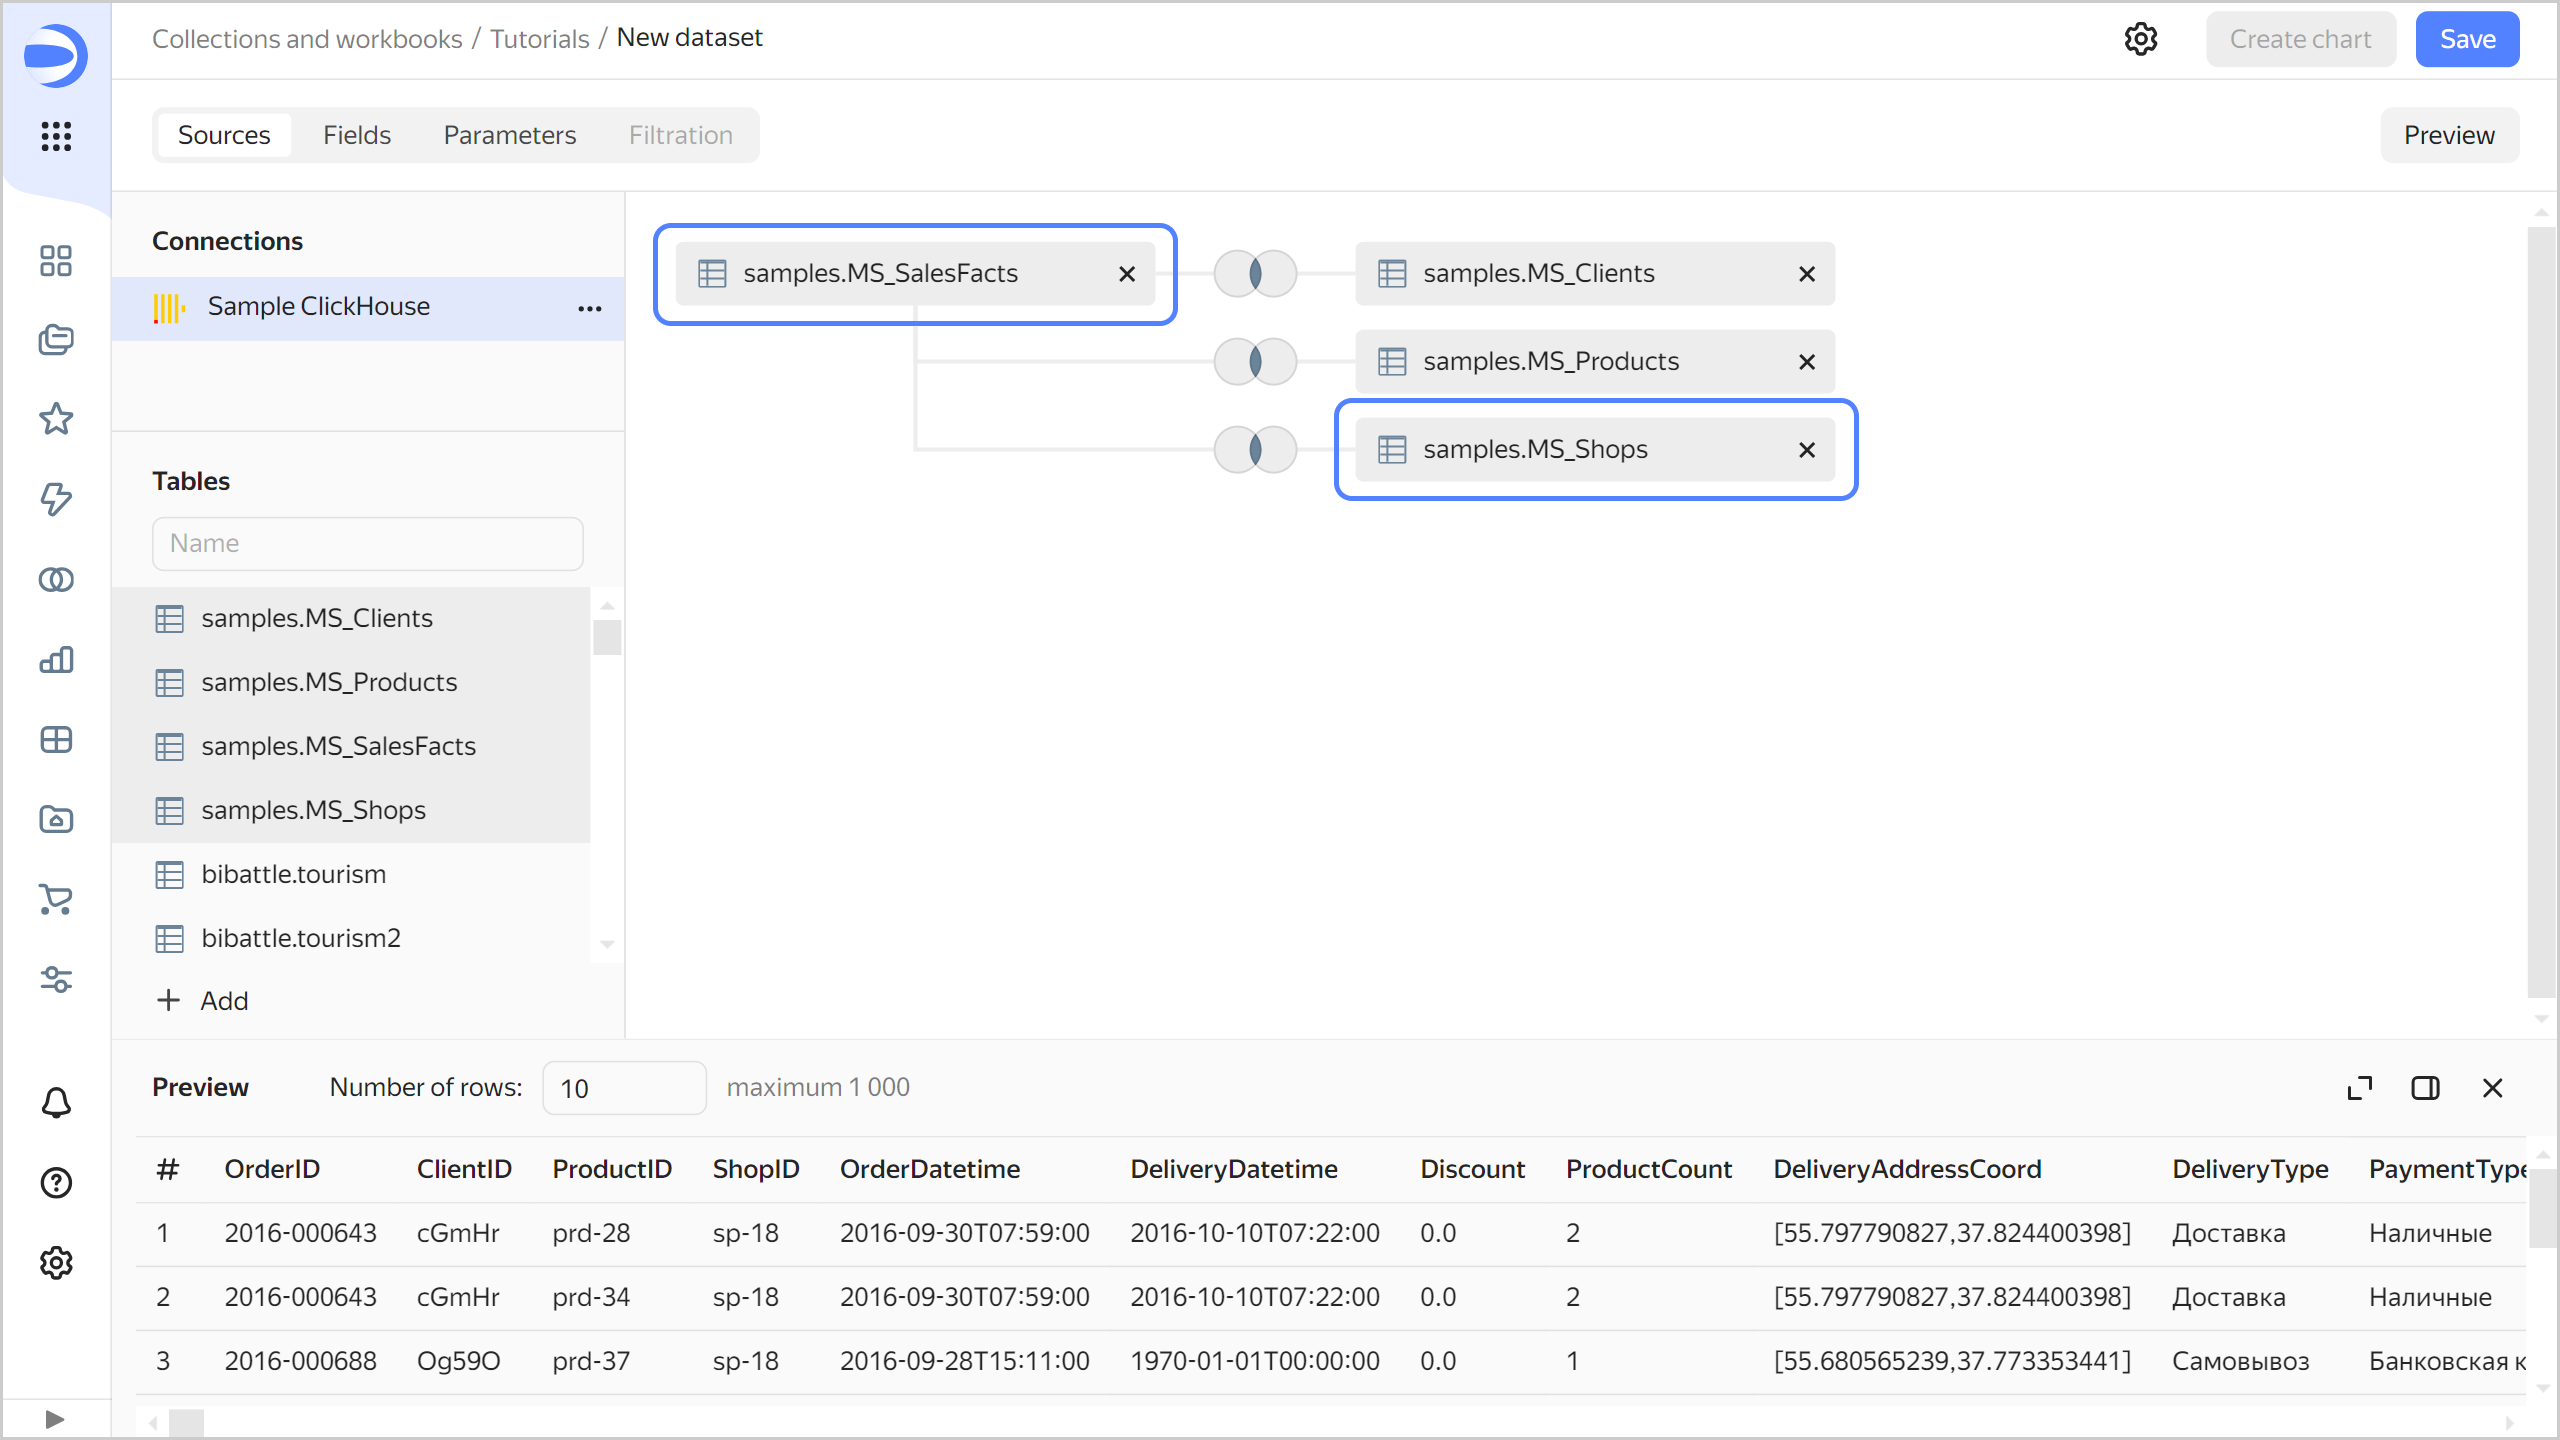
-
Navigate to the Fields tab.
-
Delete the duplicate fields left over from joining these tables:
ClientID (1),ProductID (1), andShopID (1). To do this, select them and click Delete in the panel below the list of fields.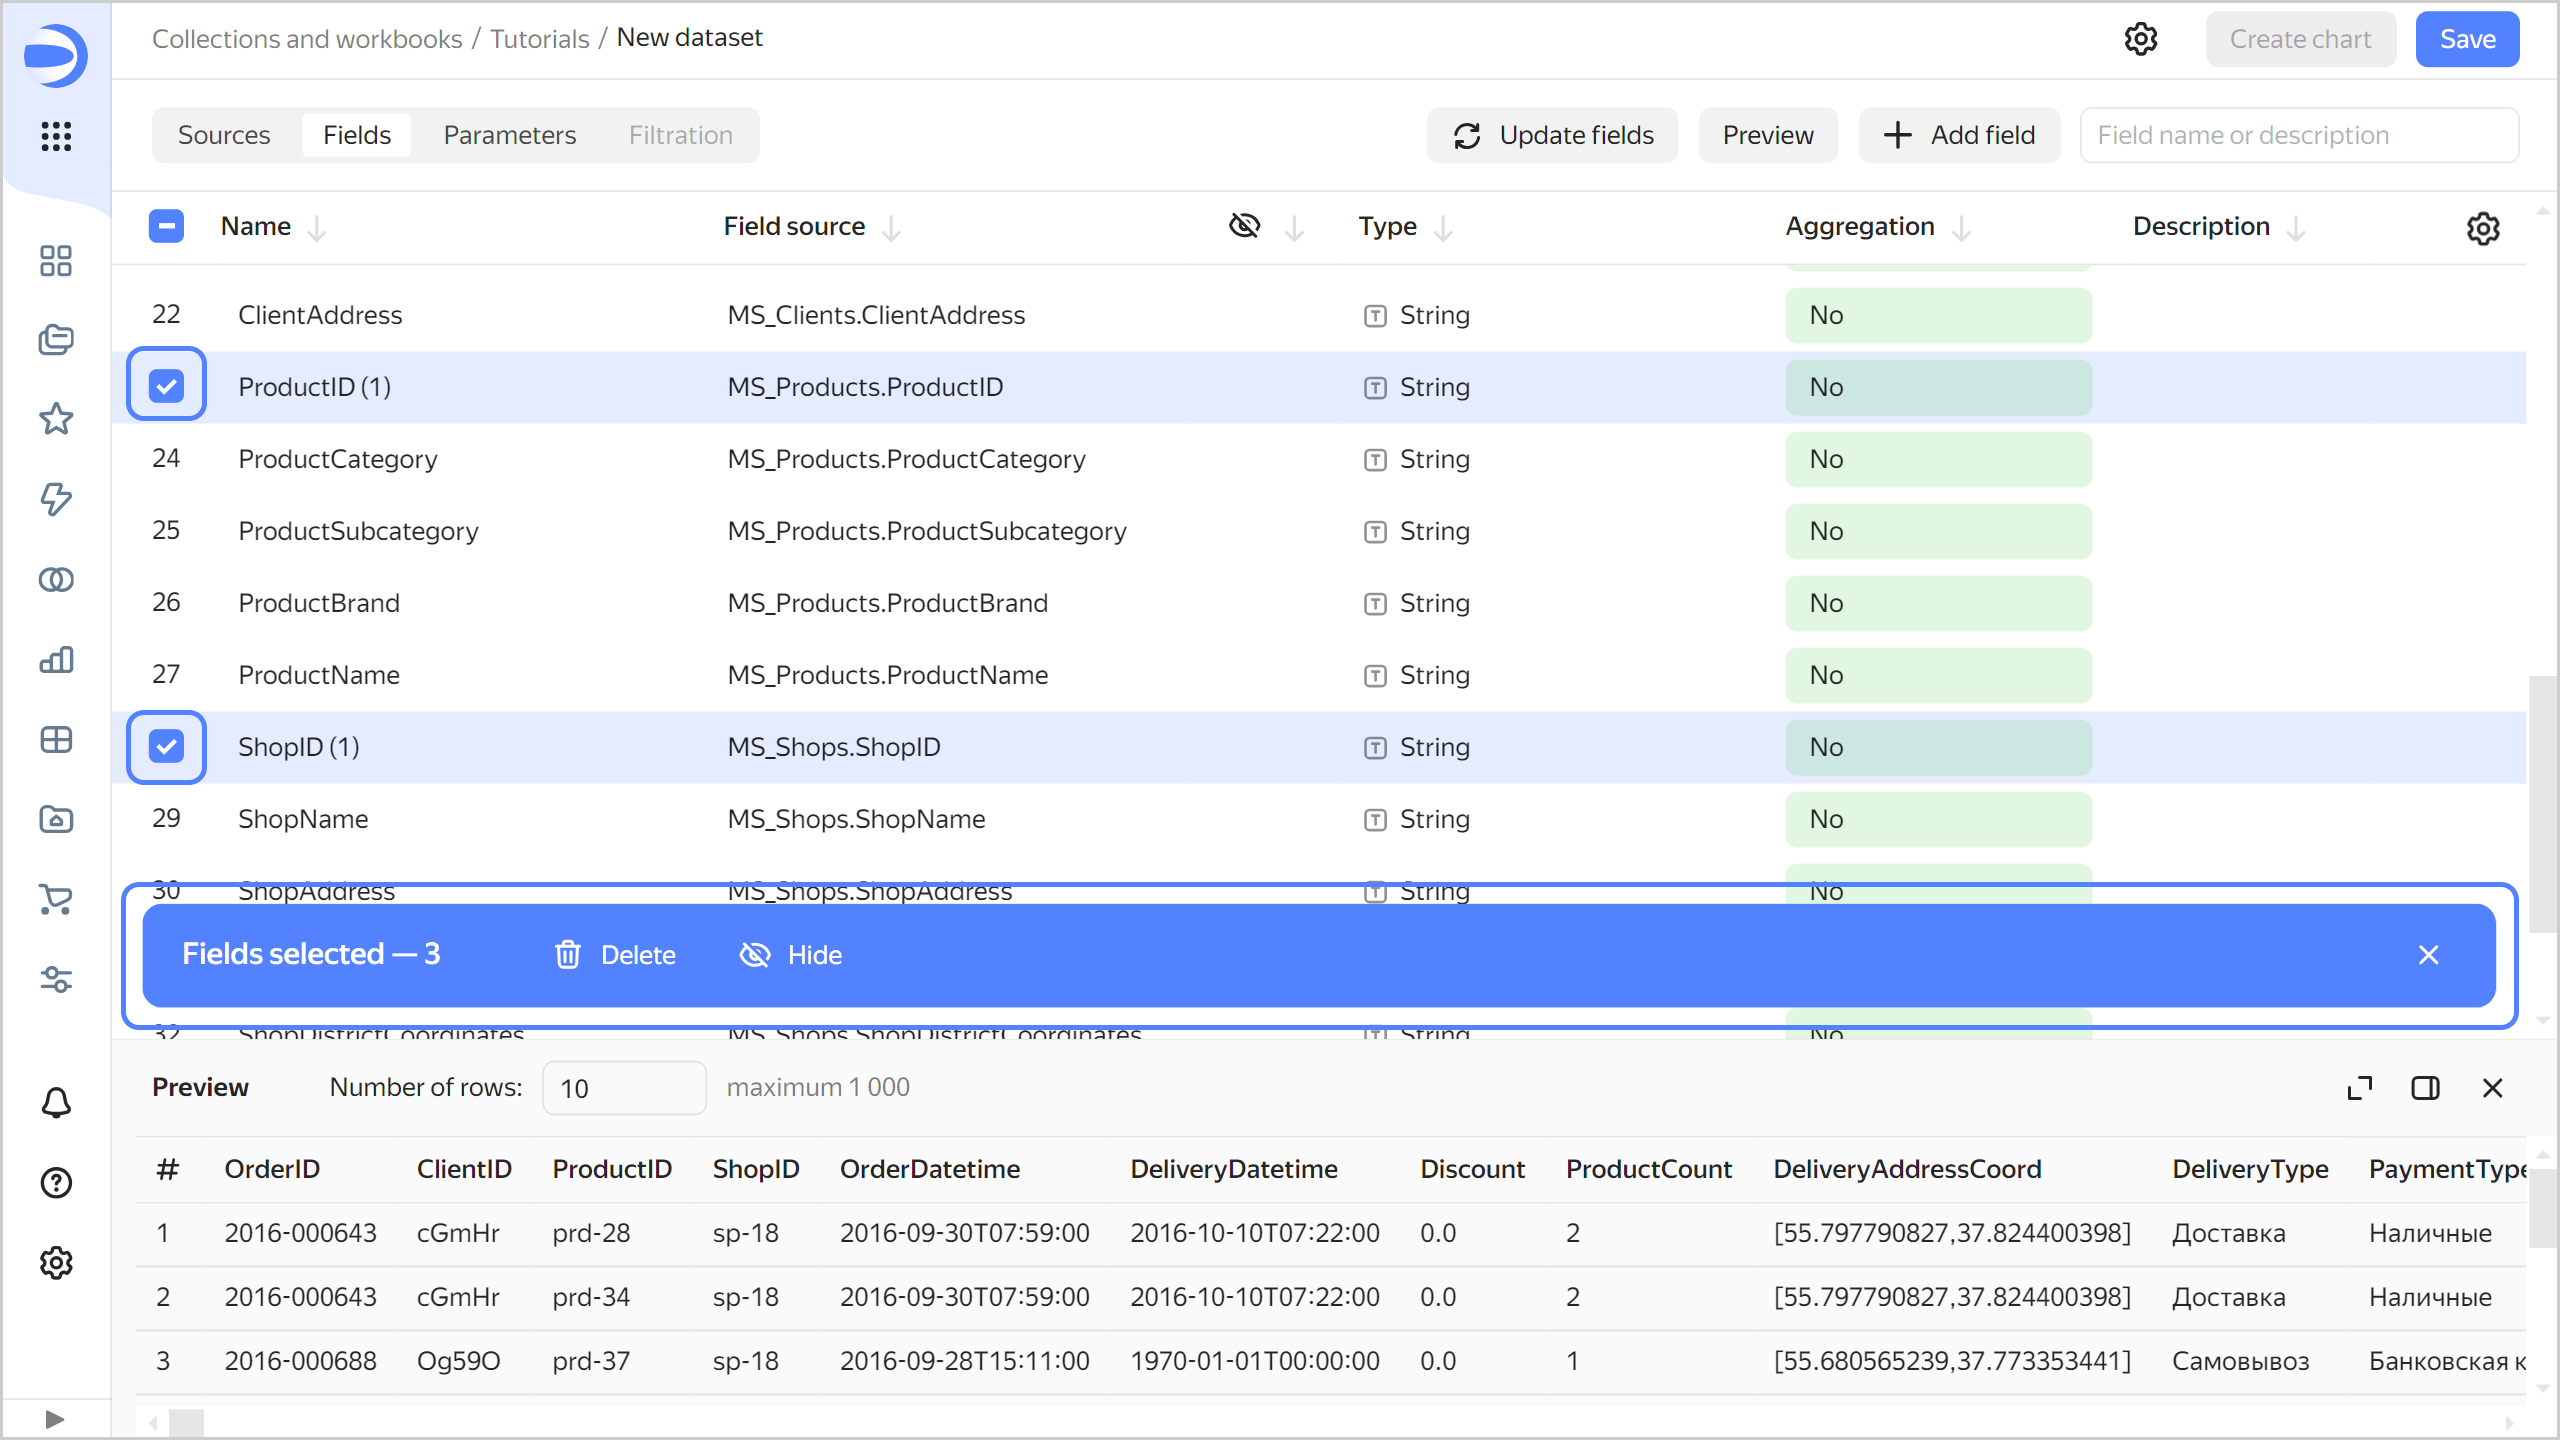
-
Create an order date field named
OrderDate:- Duplicate the
OrderDatetimefield: on the right side of the row with the field, click and select Duplicate. - Rename the
OrderDatetime (1)duplicate field toOrderDate: click the field name, delete the current name, and enter the new one. - In the Type column, change the data type from Date and time to Date.
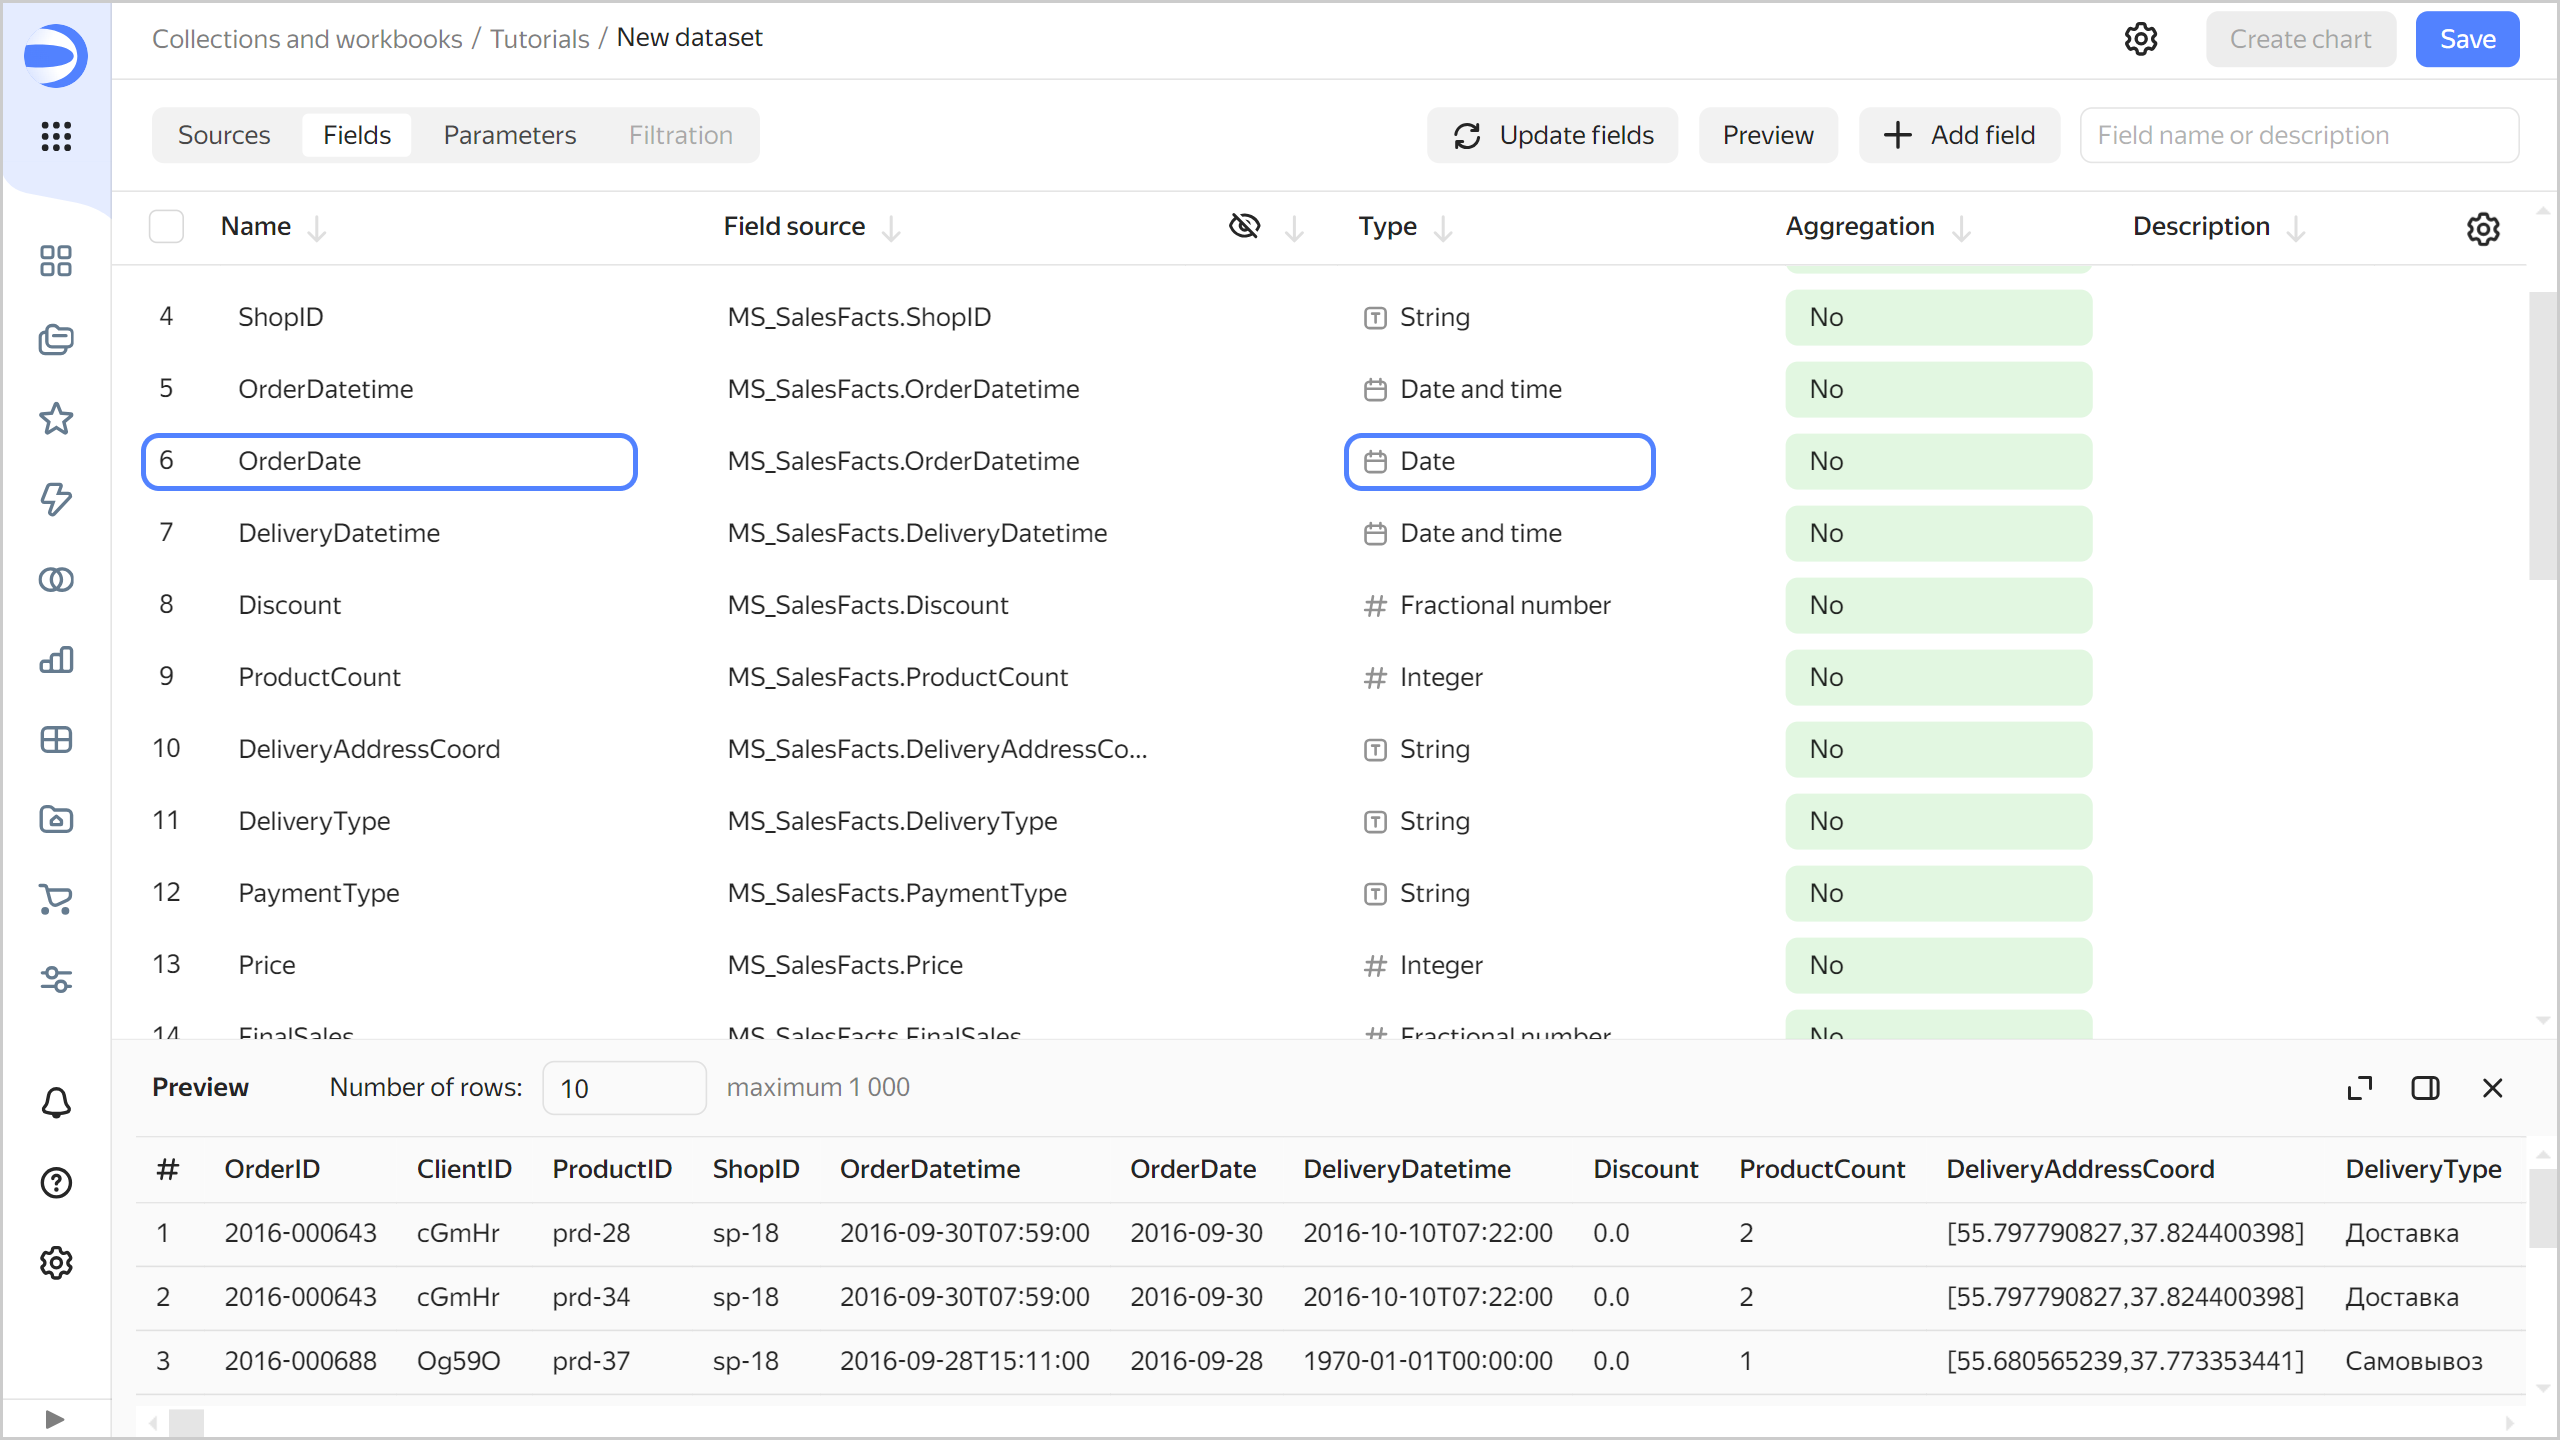
- Duplicate the
-
Change data types for the fields as follows:
ShopDistrictCoordinates: Change to Geopolygon.DeliveryDistrictCoordinates: Change to Geopolygon.DeliveryAddressCoord: Change to Geopoint.
-
Create a measure for the order amount: in the Aggregation column, select Sum for the
Pricefield. The aggregation field will change its color to blue: it is now a measure.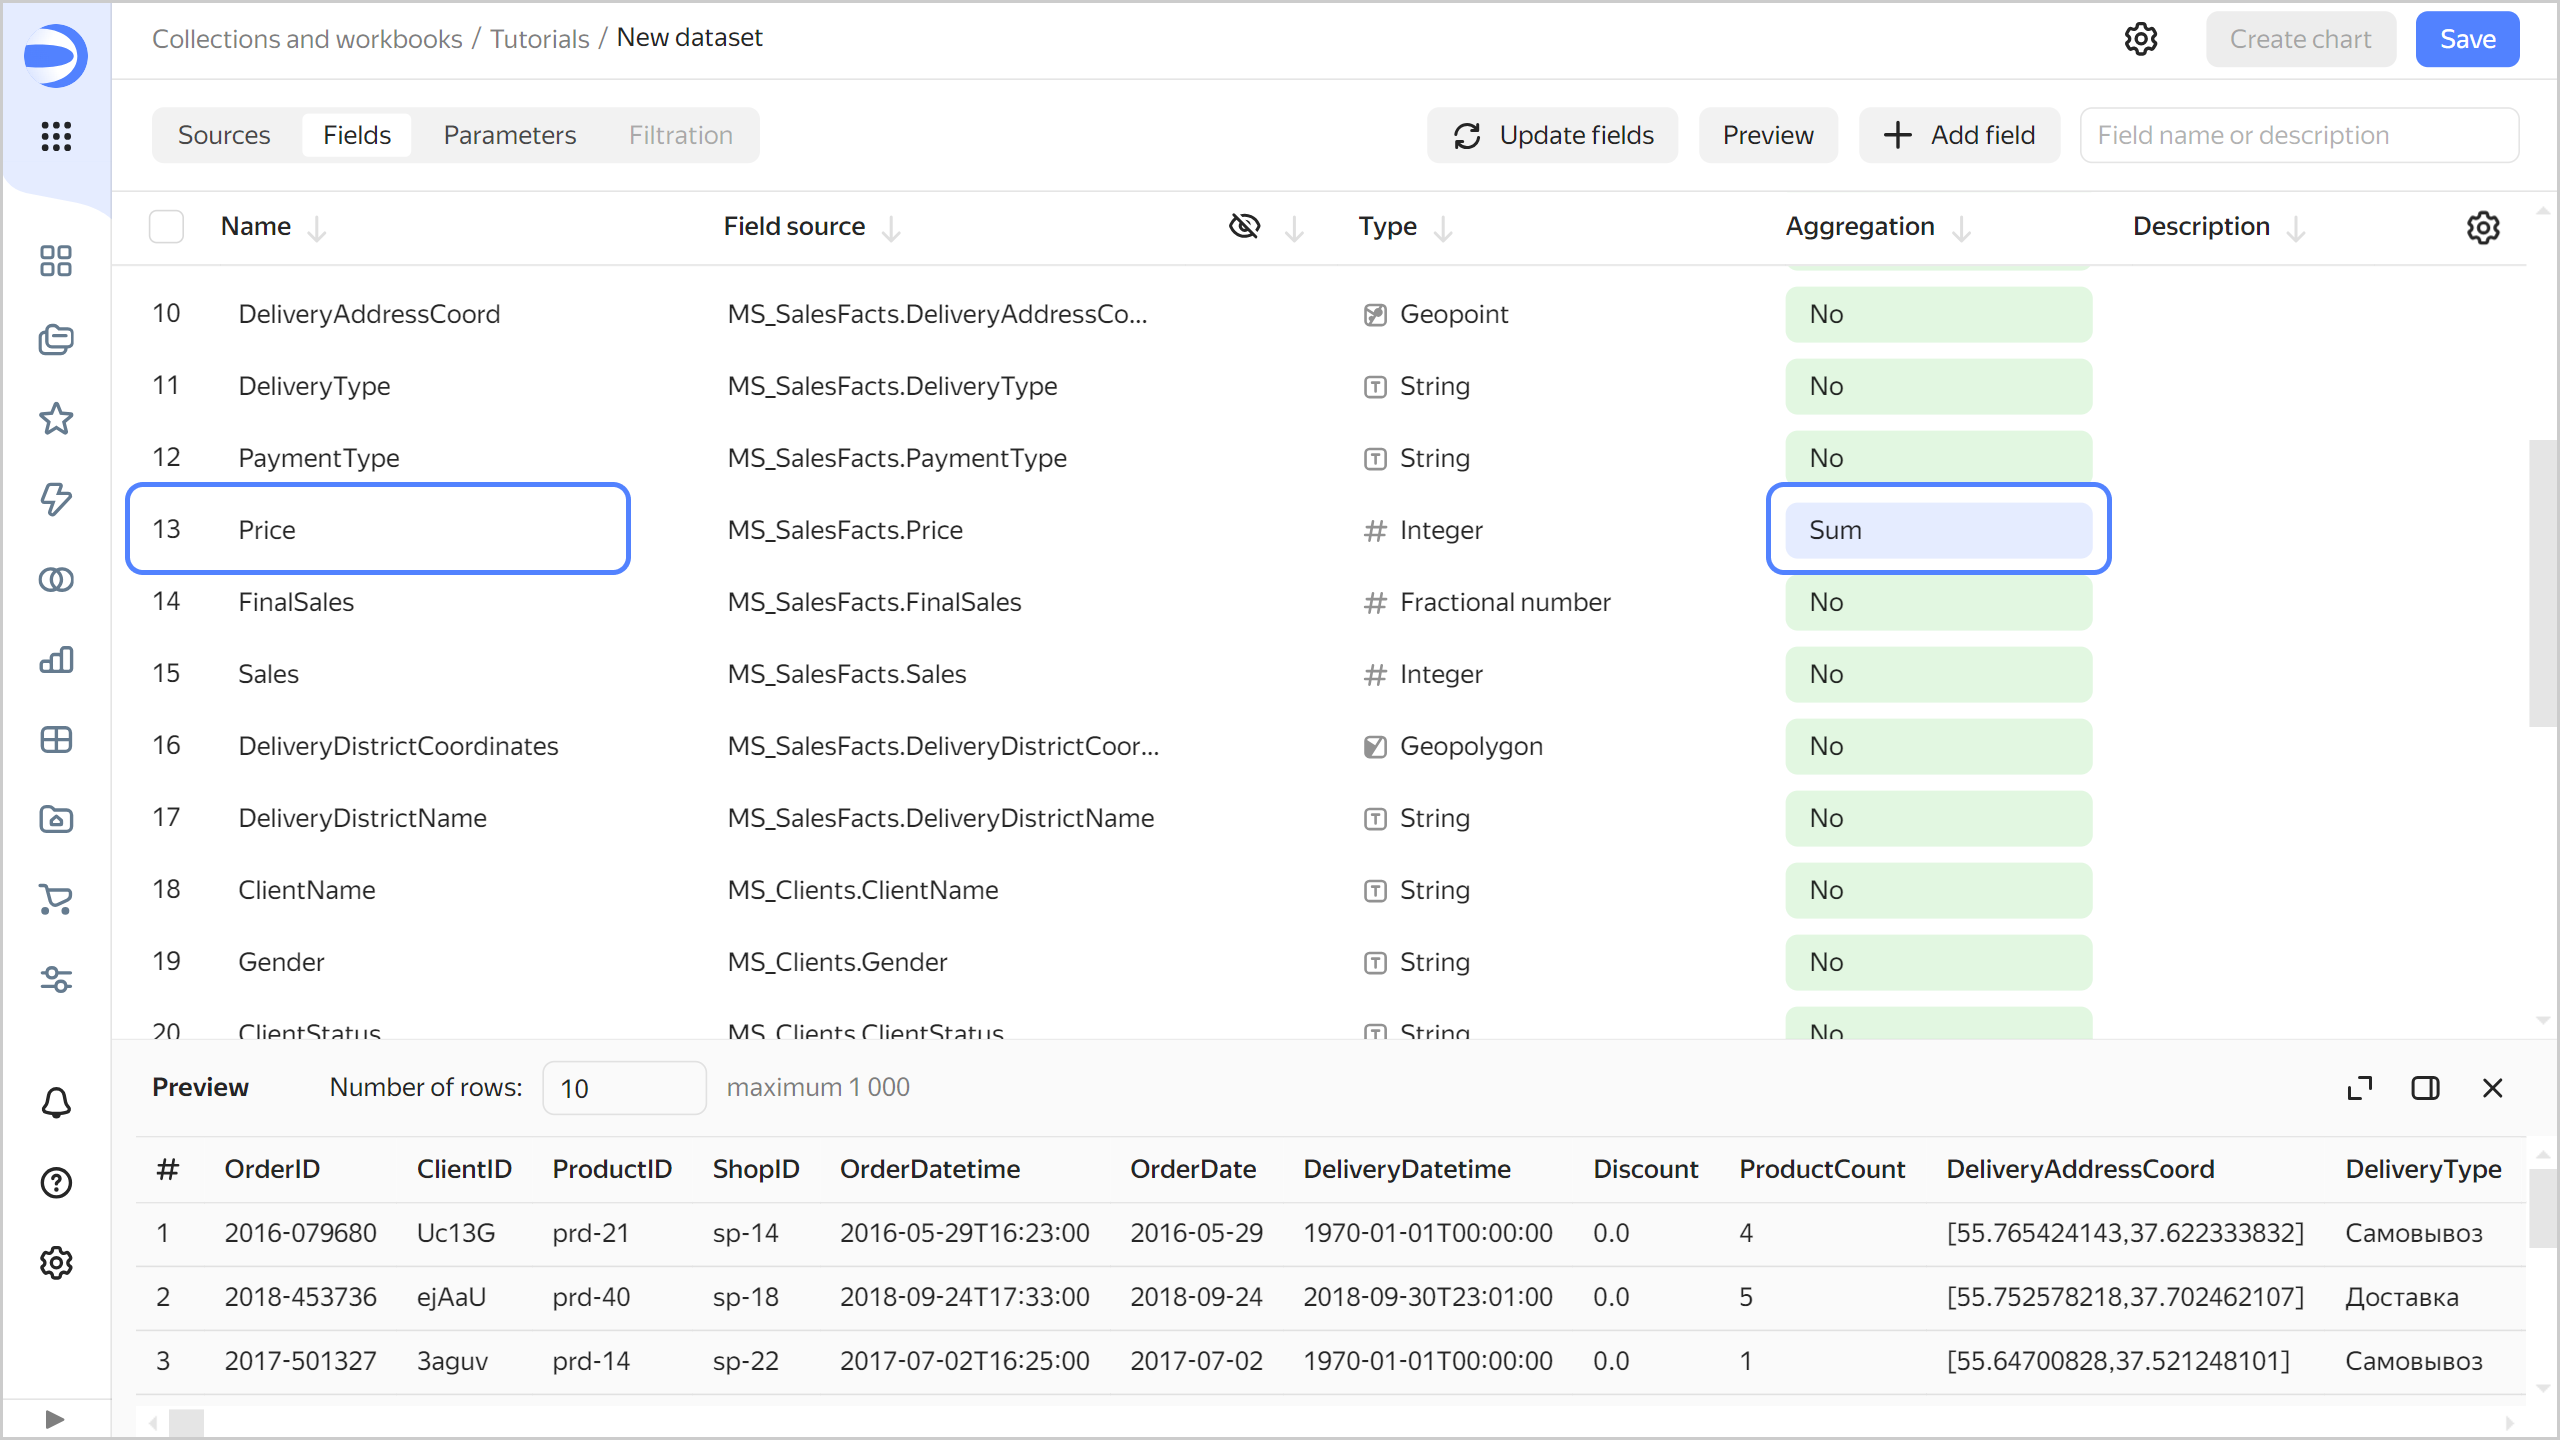
-
Create a measure for the number of orders:
- Duplicate the
OrderIDfield. - Rename the
OrderID (1)duplicate field toOrderCount. - Change the aggregation type to Number of unique.
- Duplicate the
-
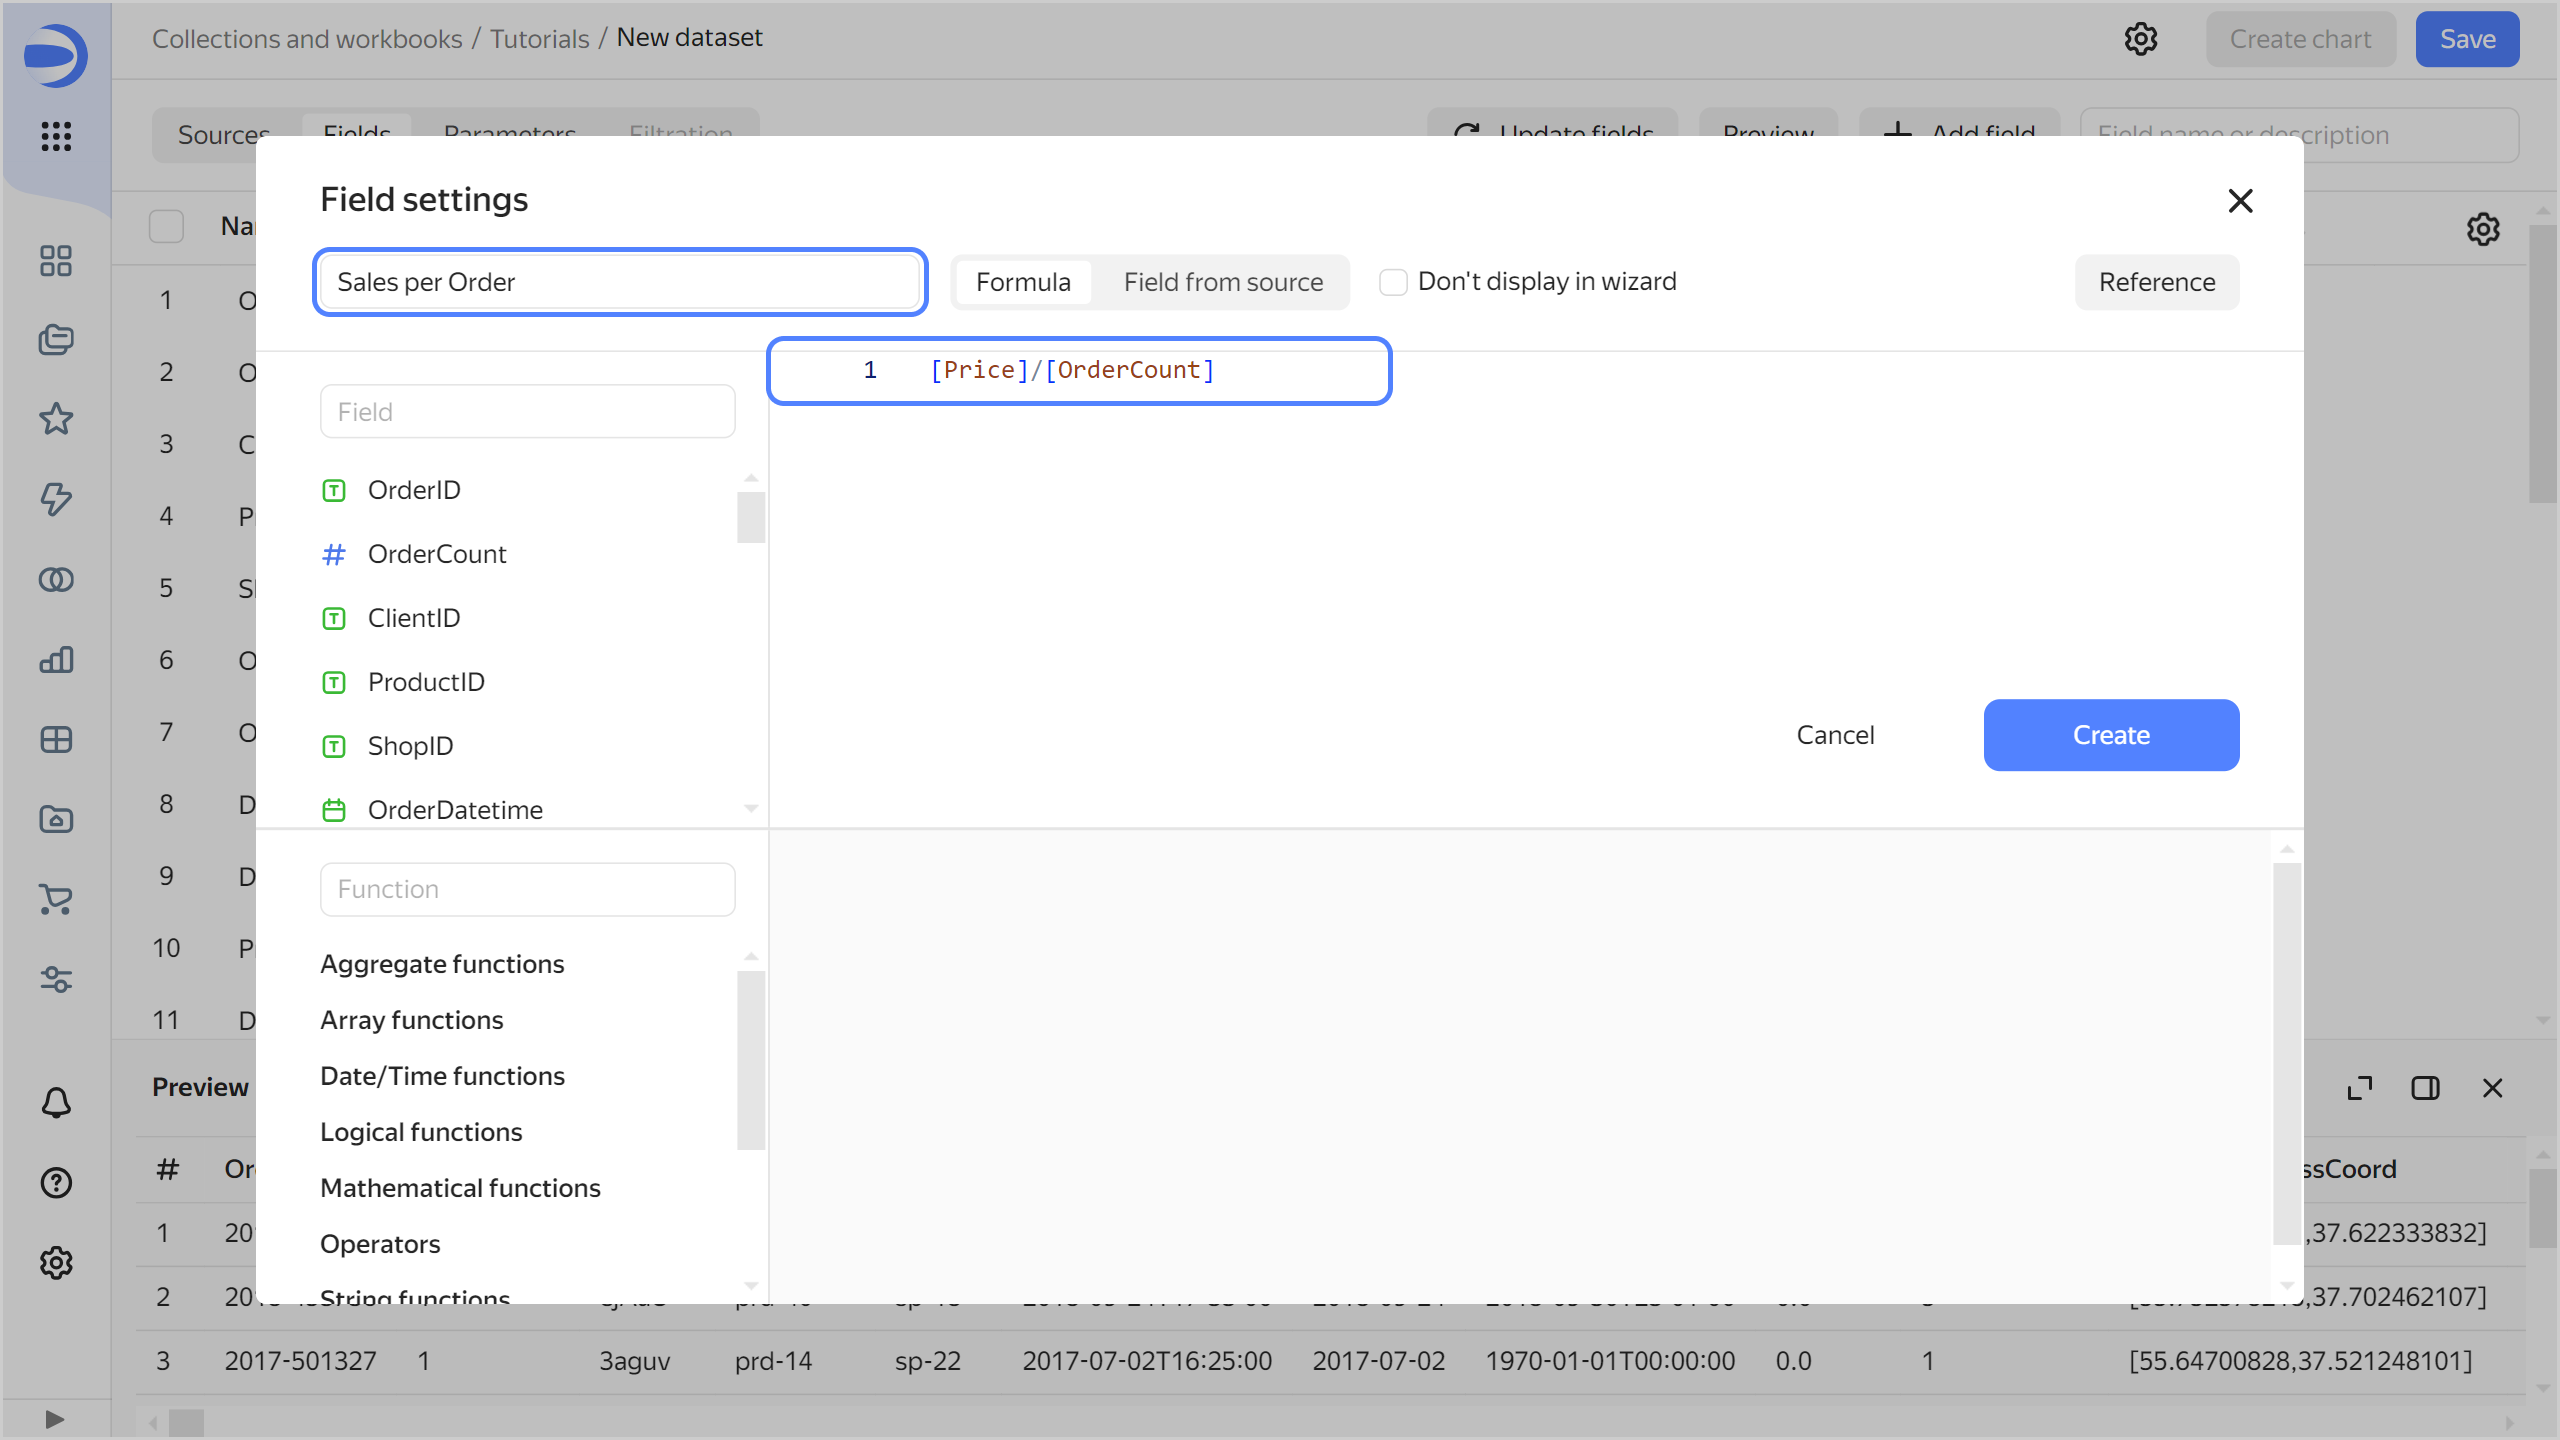
Create a calculated field for the average sales amount per order:
- In the top-right corner, click Add field.
- At the top-left, specify the field name:
Sales per Order. - In the column to the left, click the
Pricefield. - Enter
/. - In the column to the left, click the
OrderCountfield. - Click Create.
-
Save the dataset:
- In the top-right corner, click Save.
- Enter
Moscow Sales datasetfor the dataset name and click Create.
Create a line chart
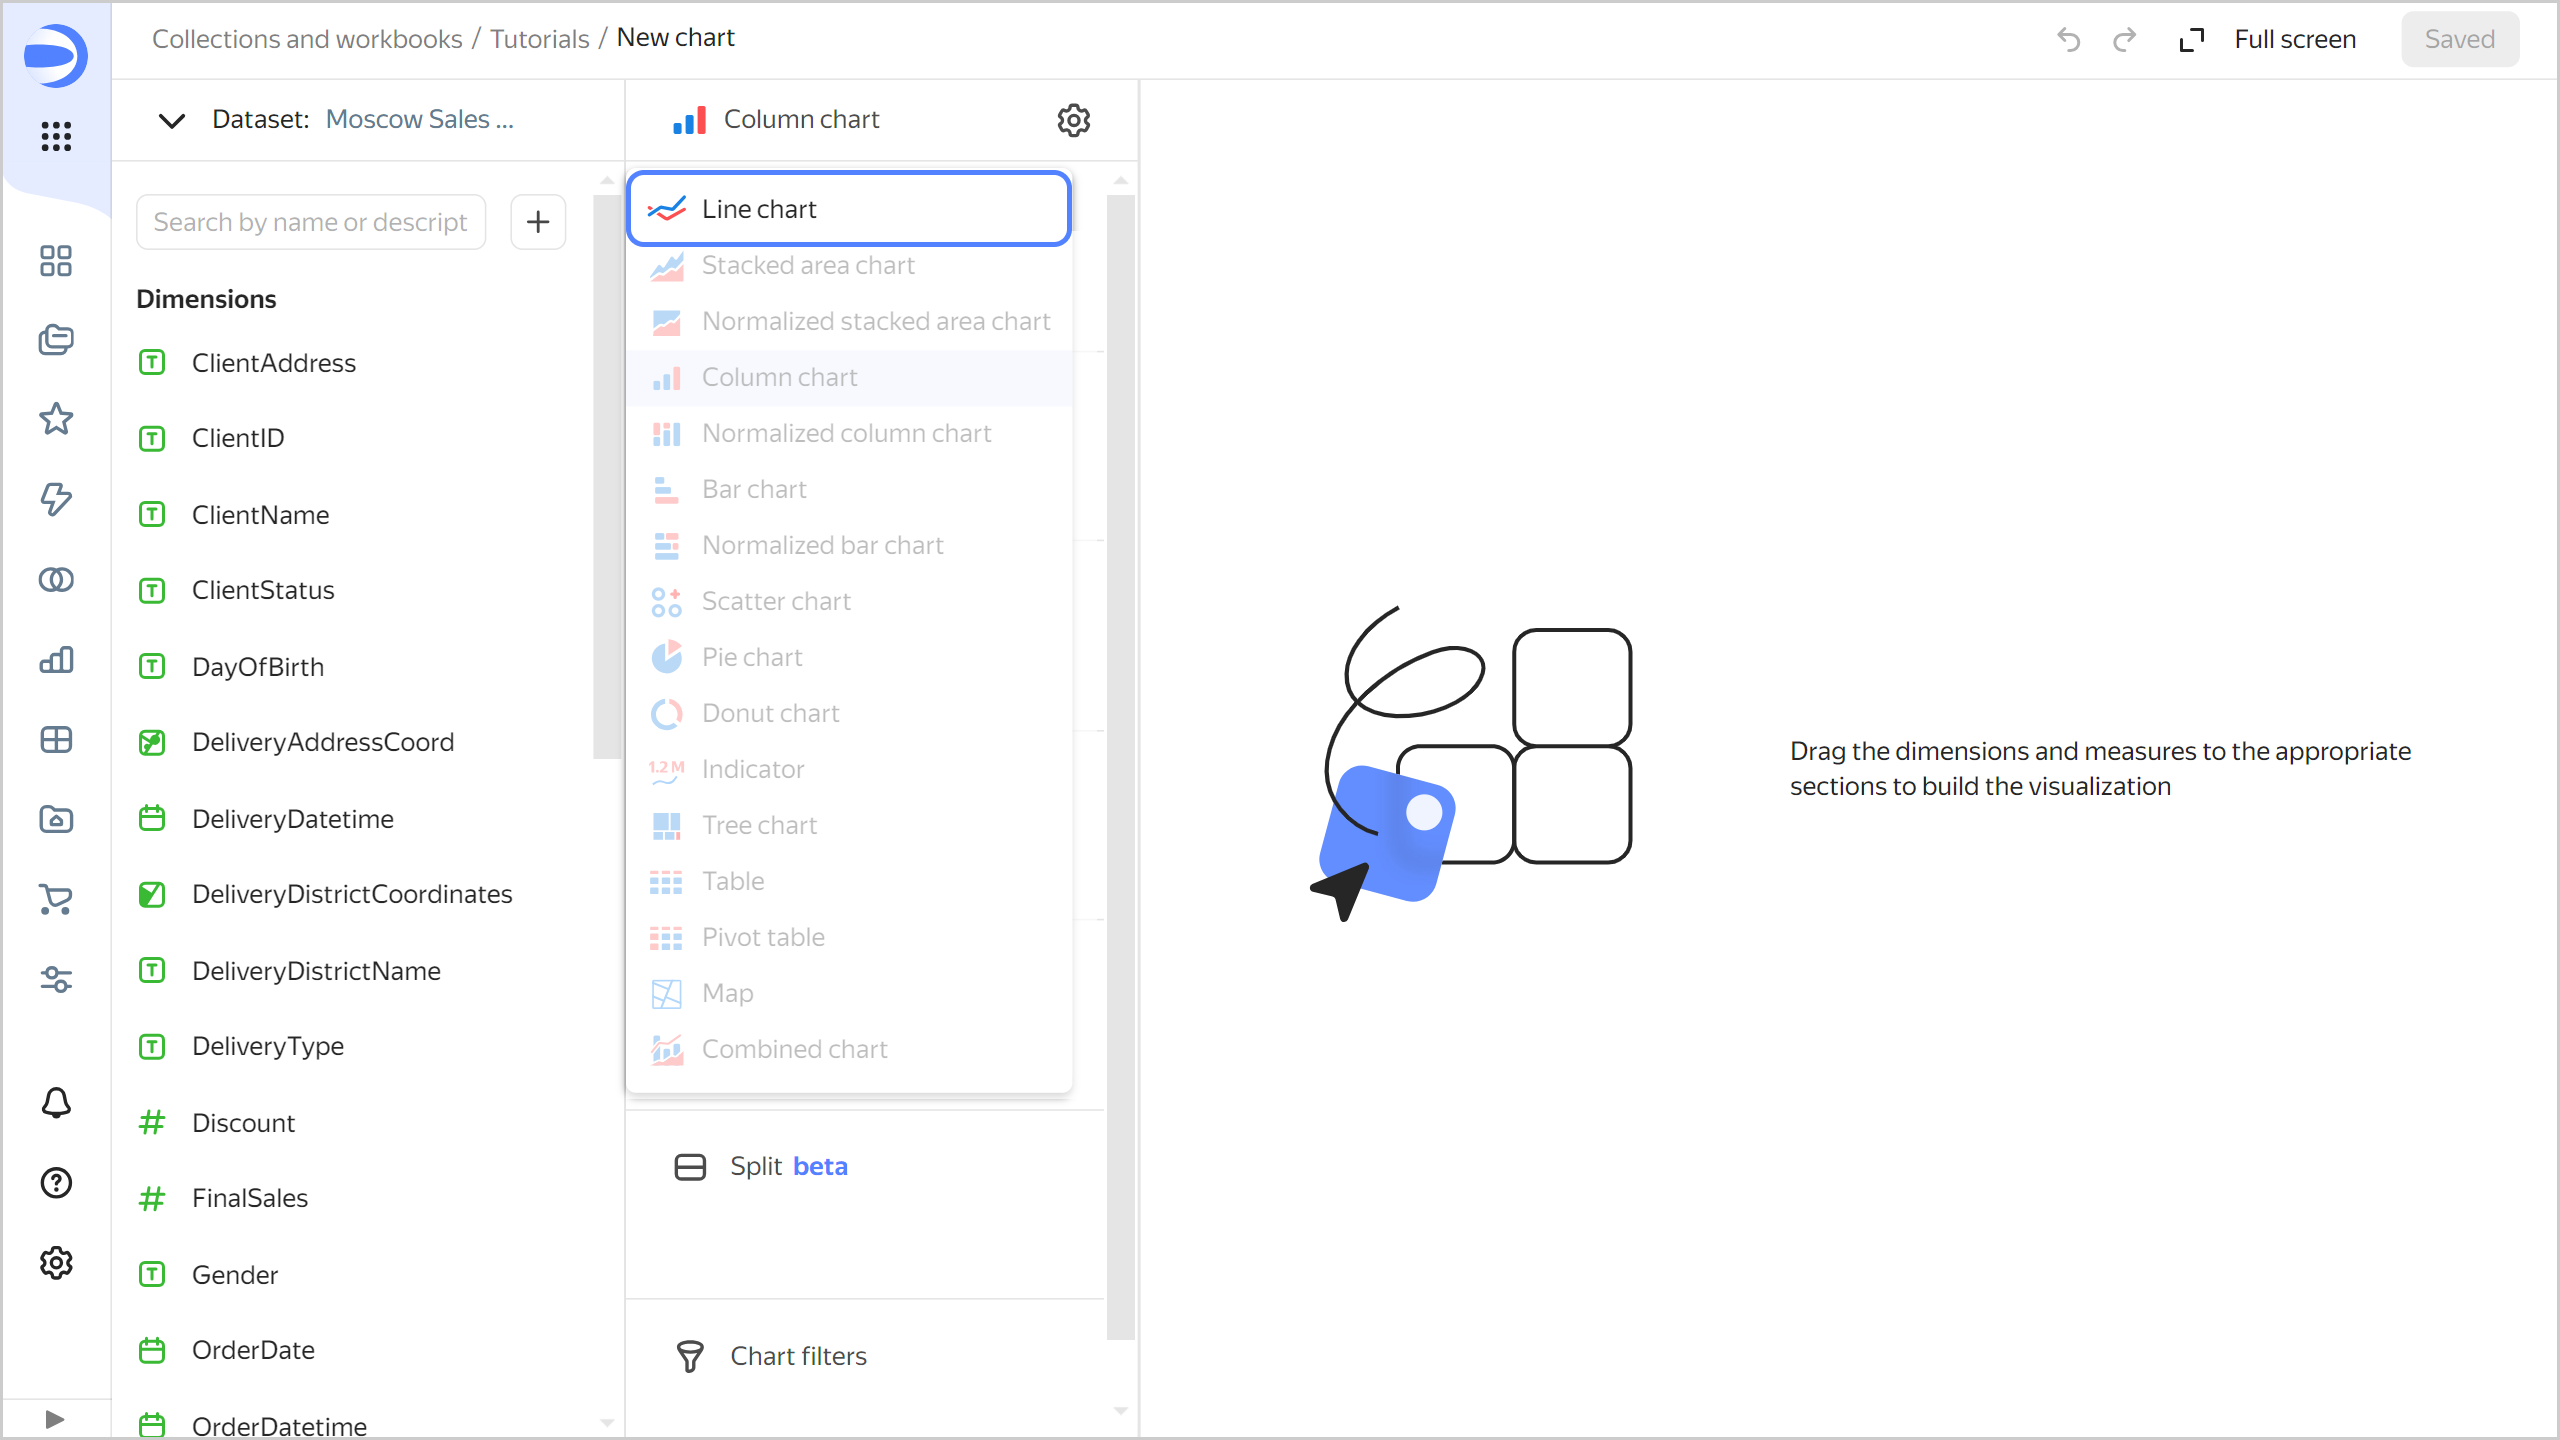
To visualize sales dynamics by month, create a line chart:
-
Click Create chart in the top-right corner of the dataset page.
-
Select Line chart as the visualization type.
-
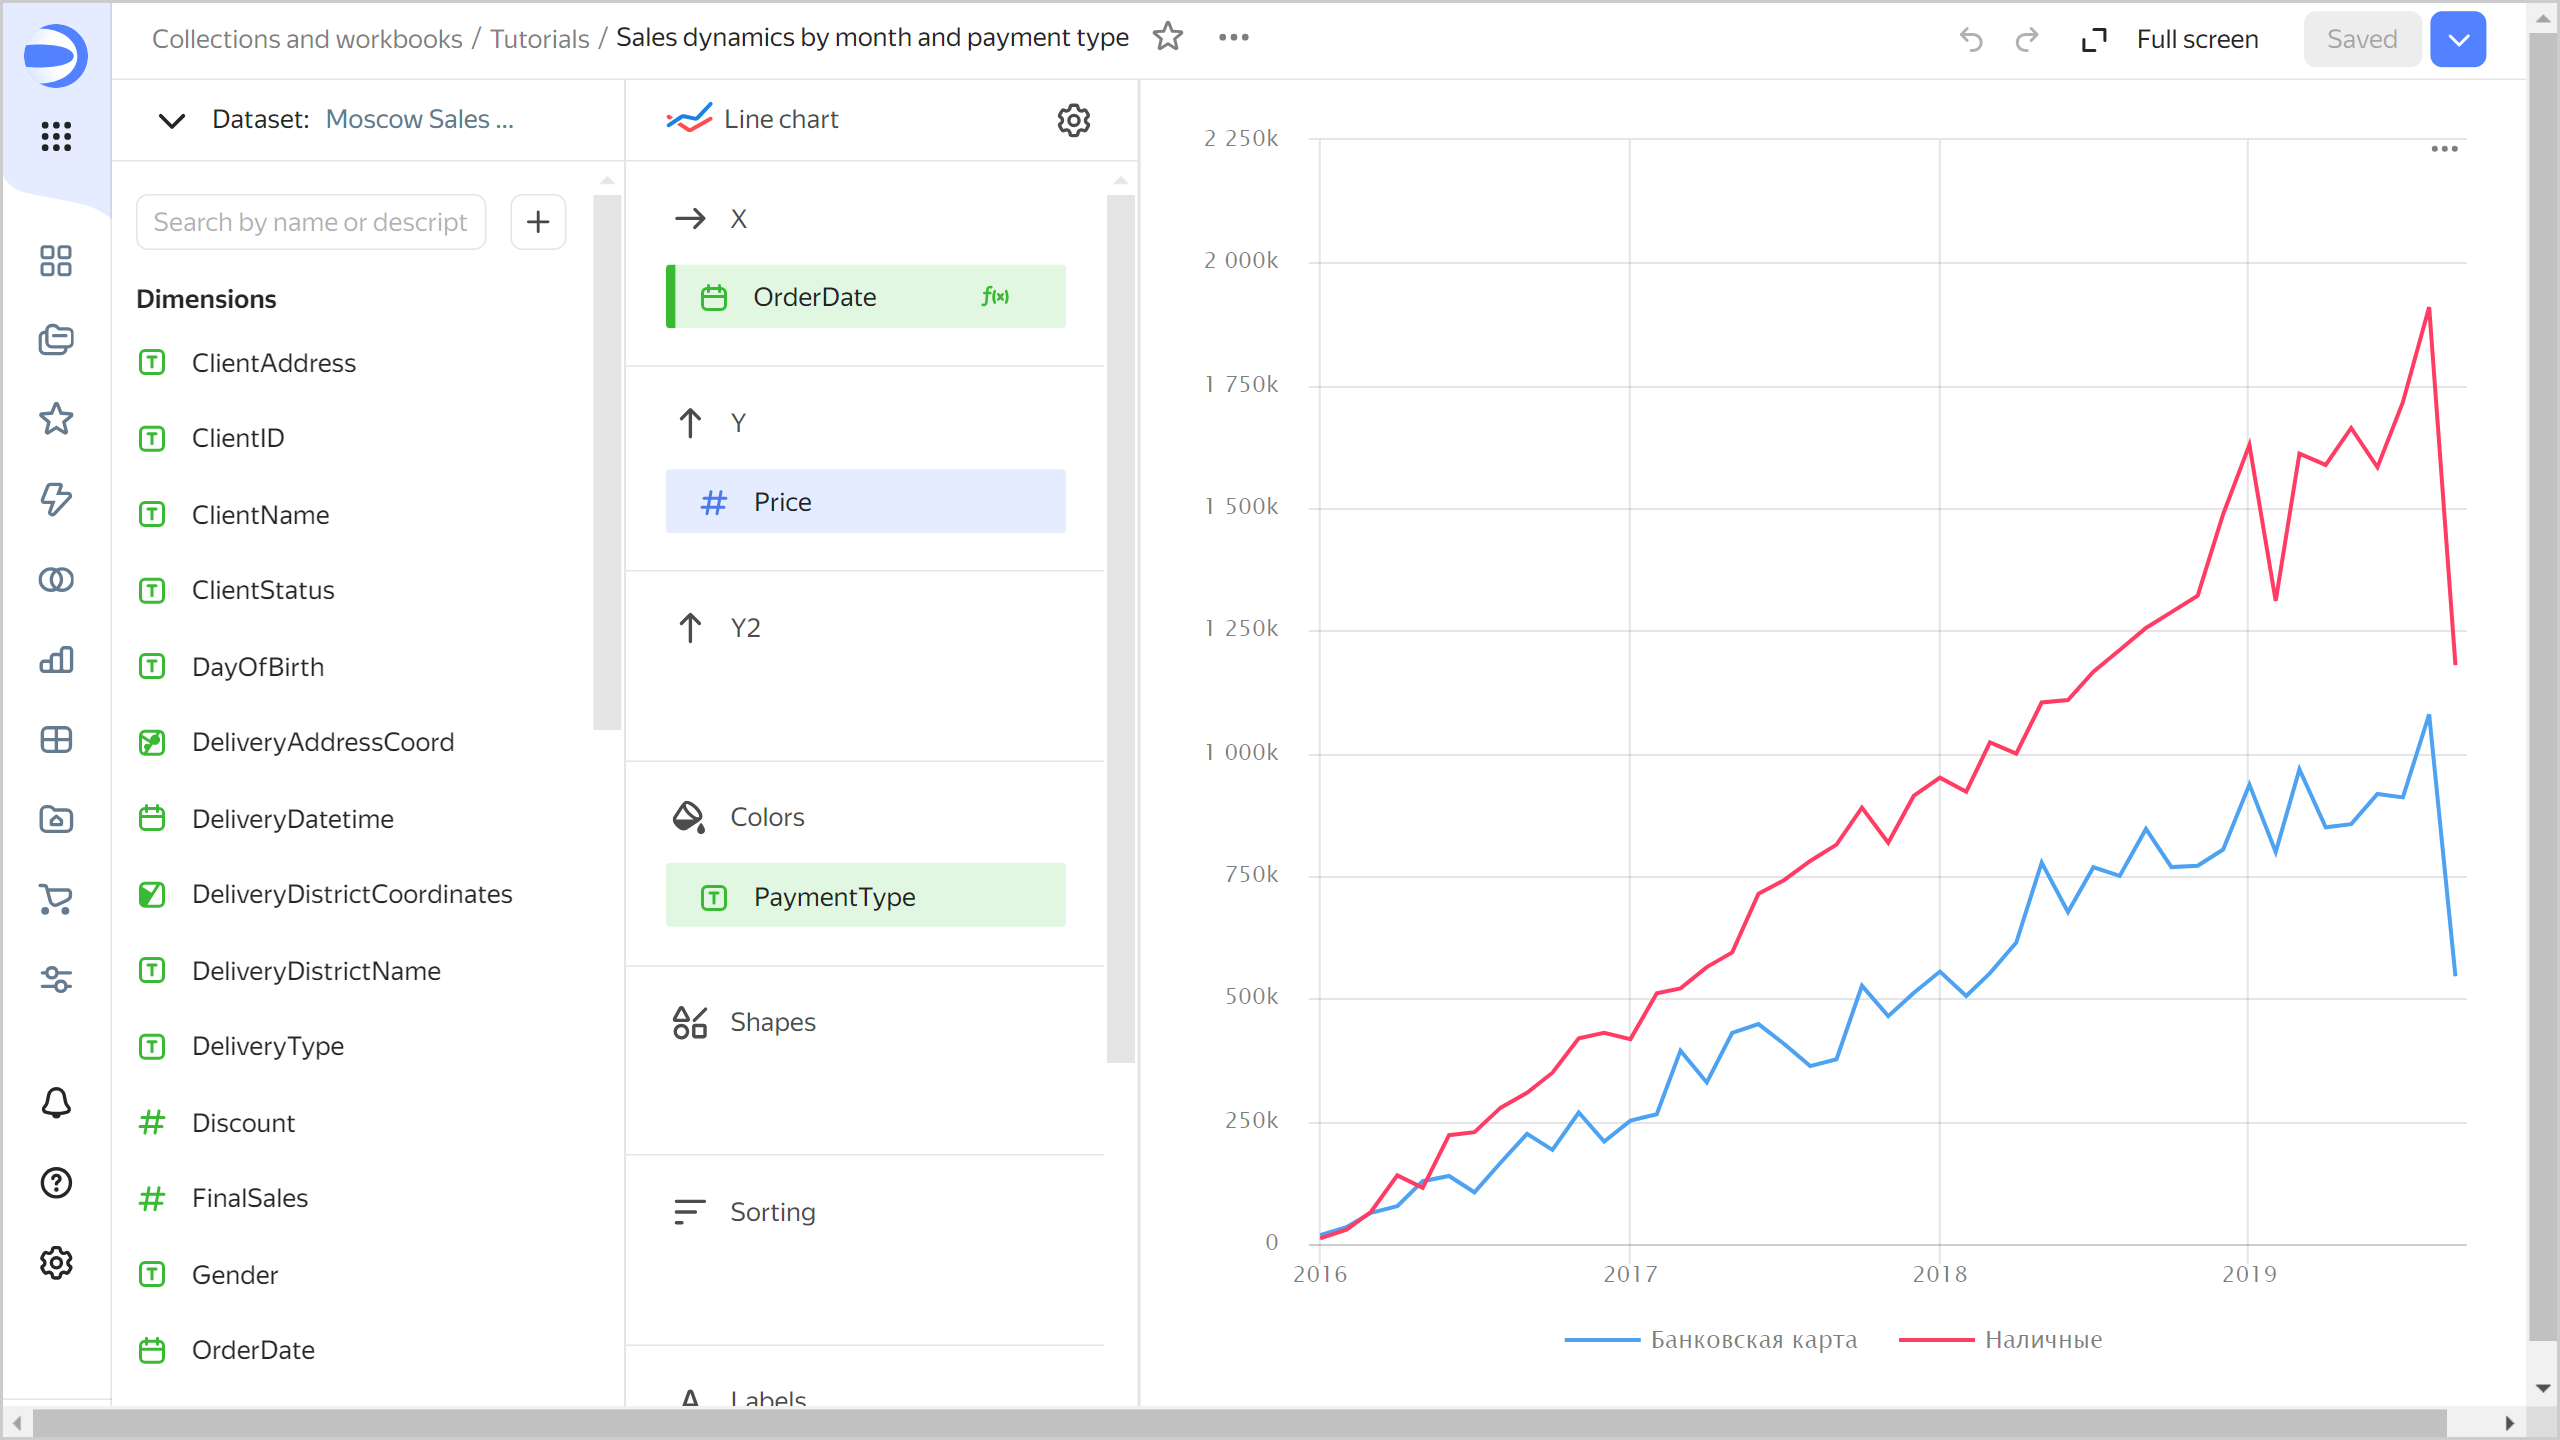
Add a sales date to the chart. To do this, drag the
OrderDatefield from Dimensions to the X section. -
Add a sales measure to the chart. To do this, drag the
Pricefield from Measures to the Y section. -
Add a delivery type to the chart. To do this, drag the
PaymentTypefield from Dimensions to the Colors section.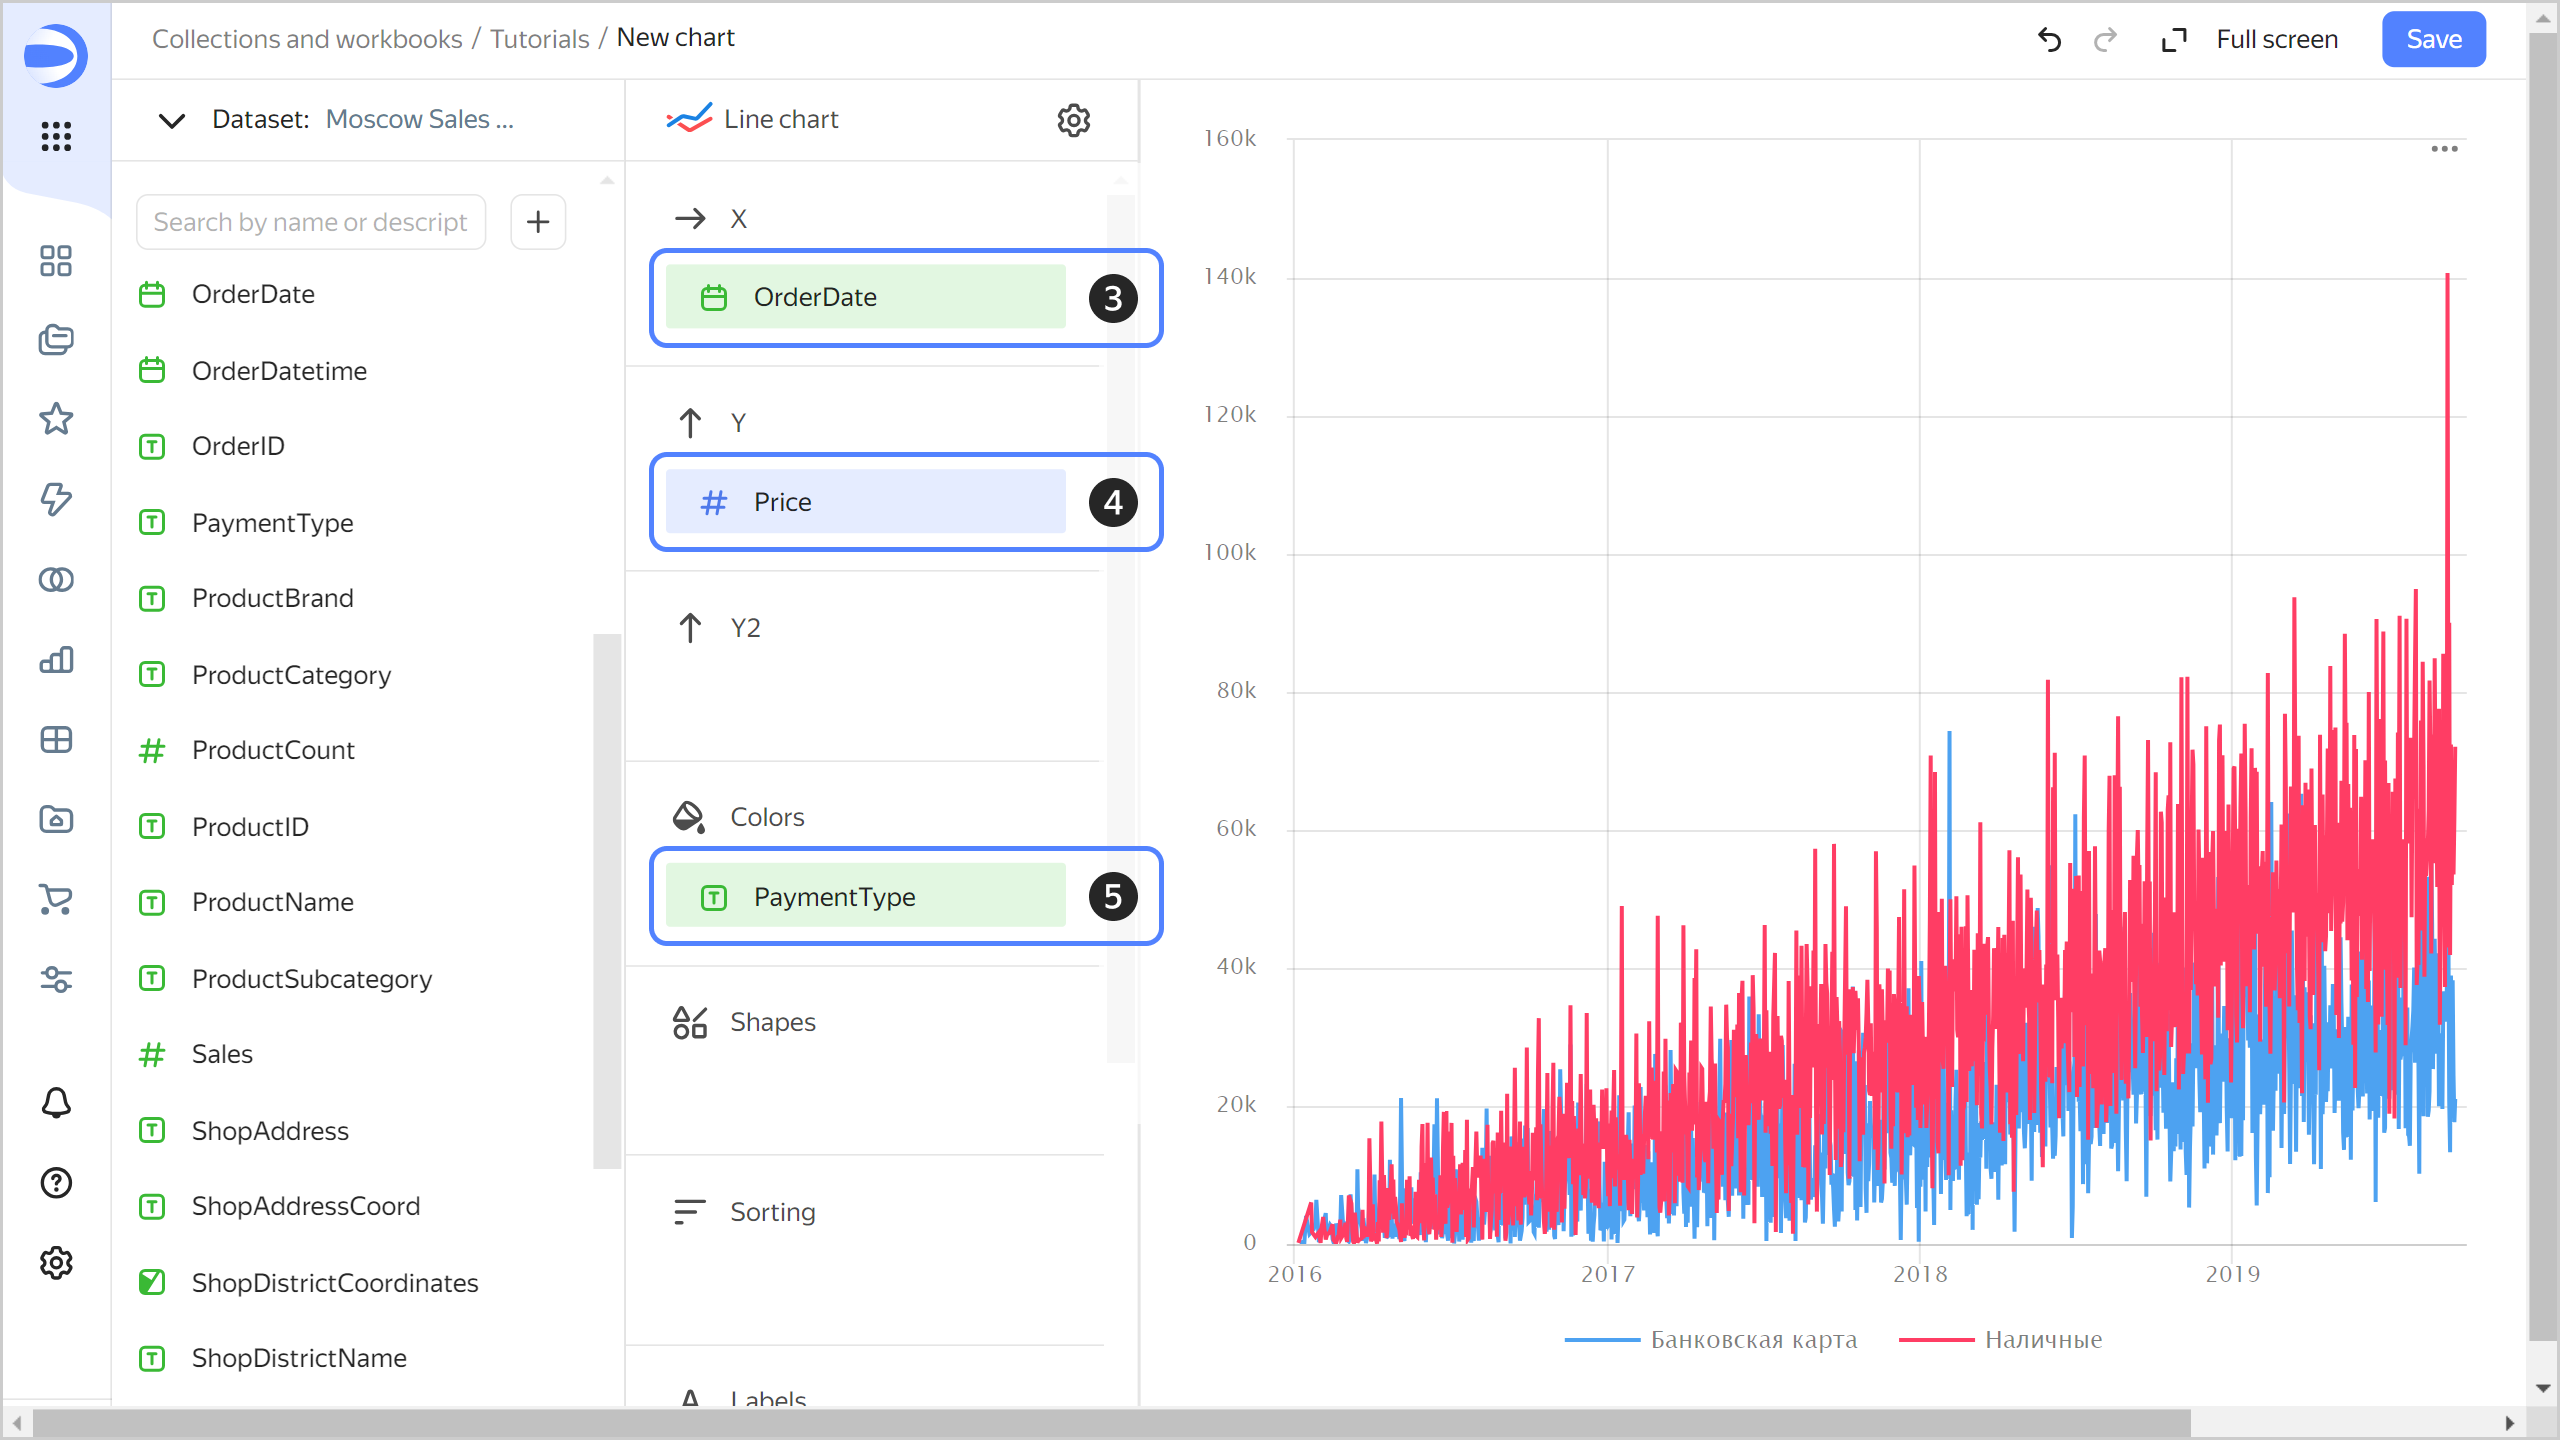
-
Display the chart by month:
- Click the calendar icon next to the
OrderDatefield in the X section. - In the Grouping field, select Rounding ⟶ Month and click Apply.
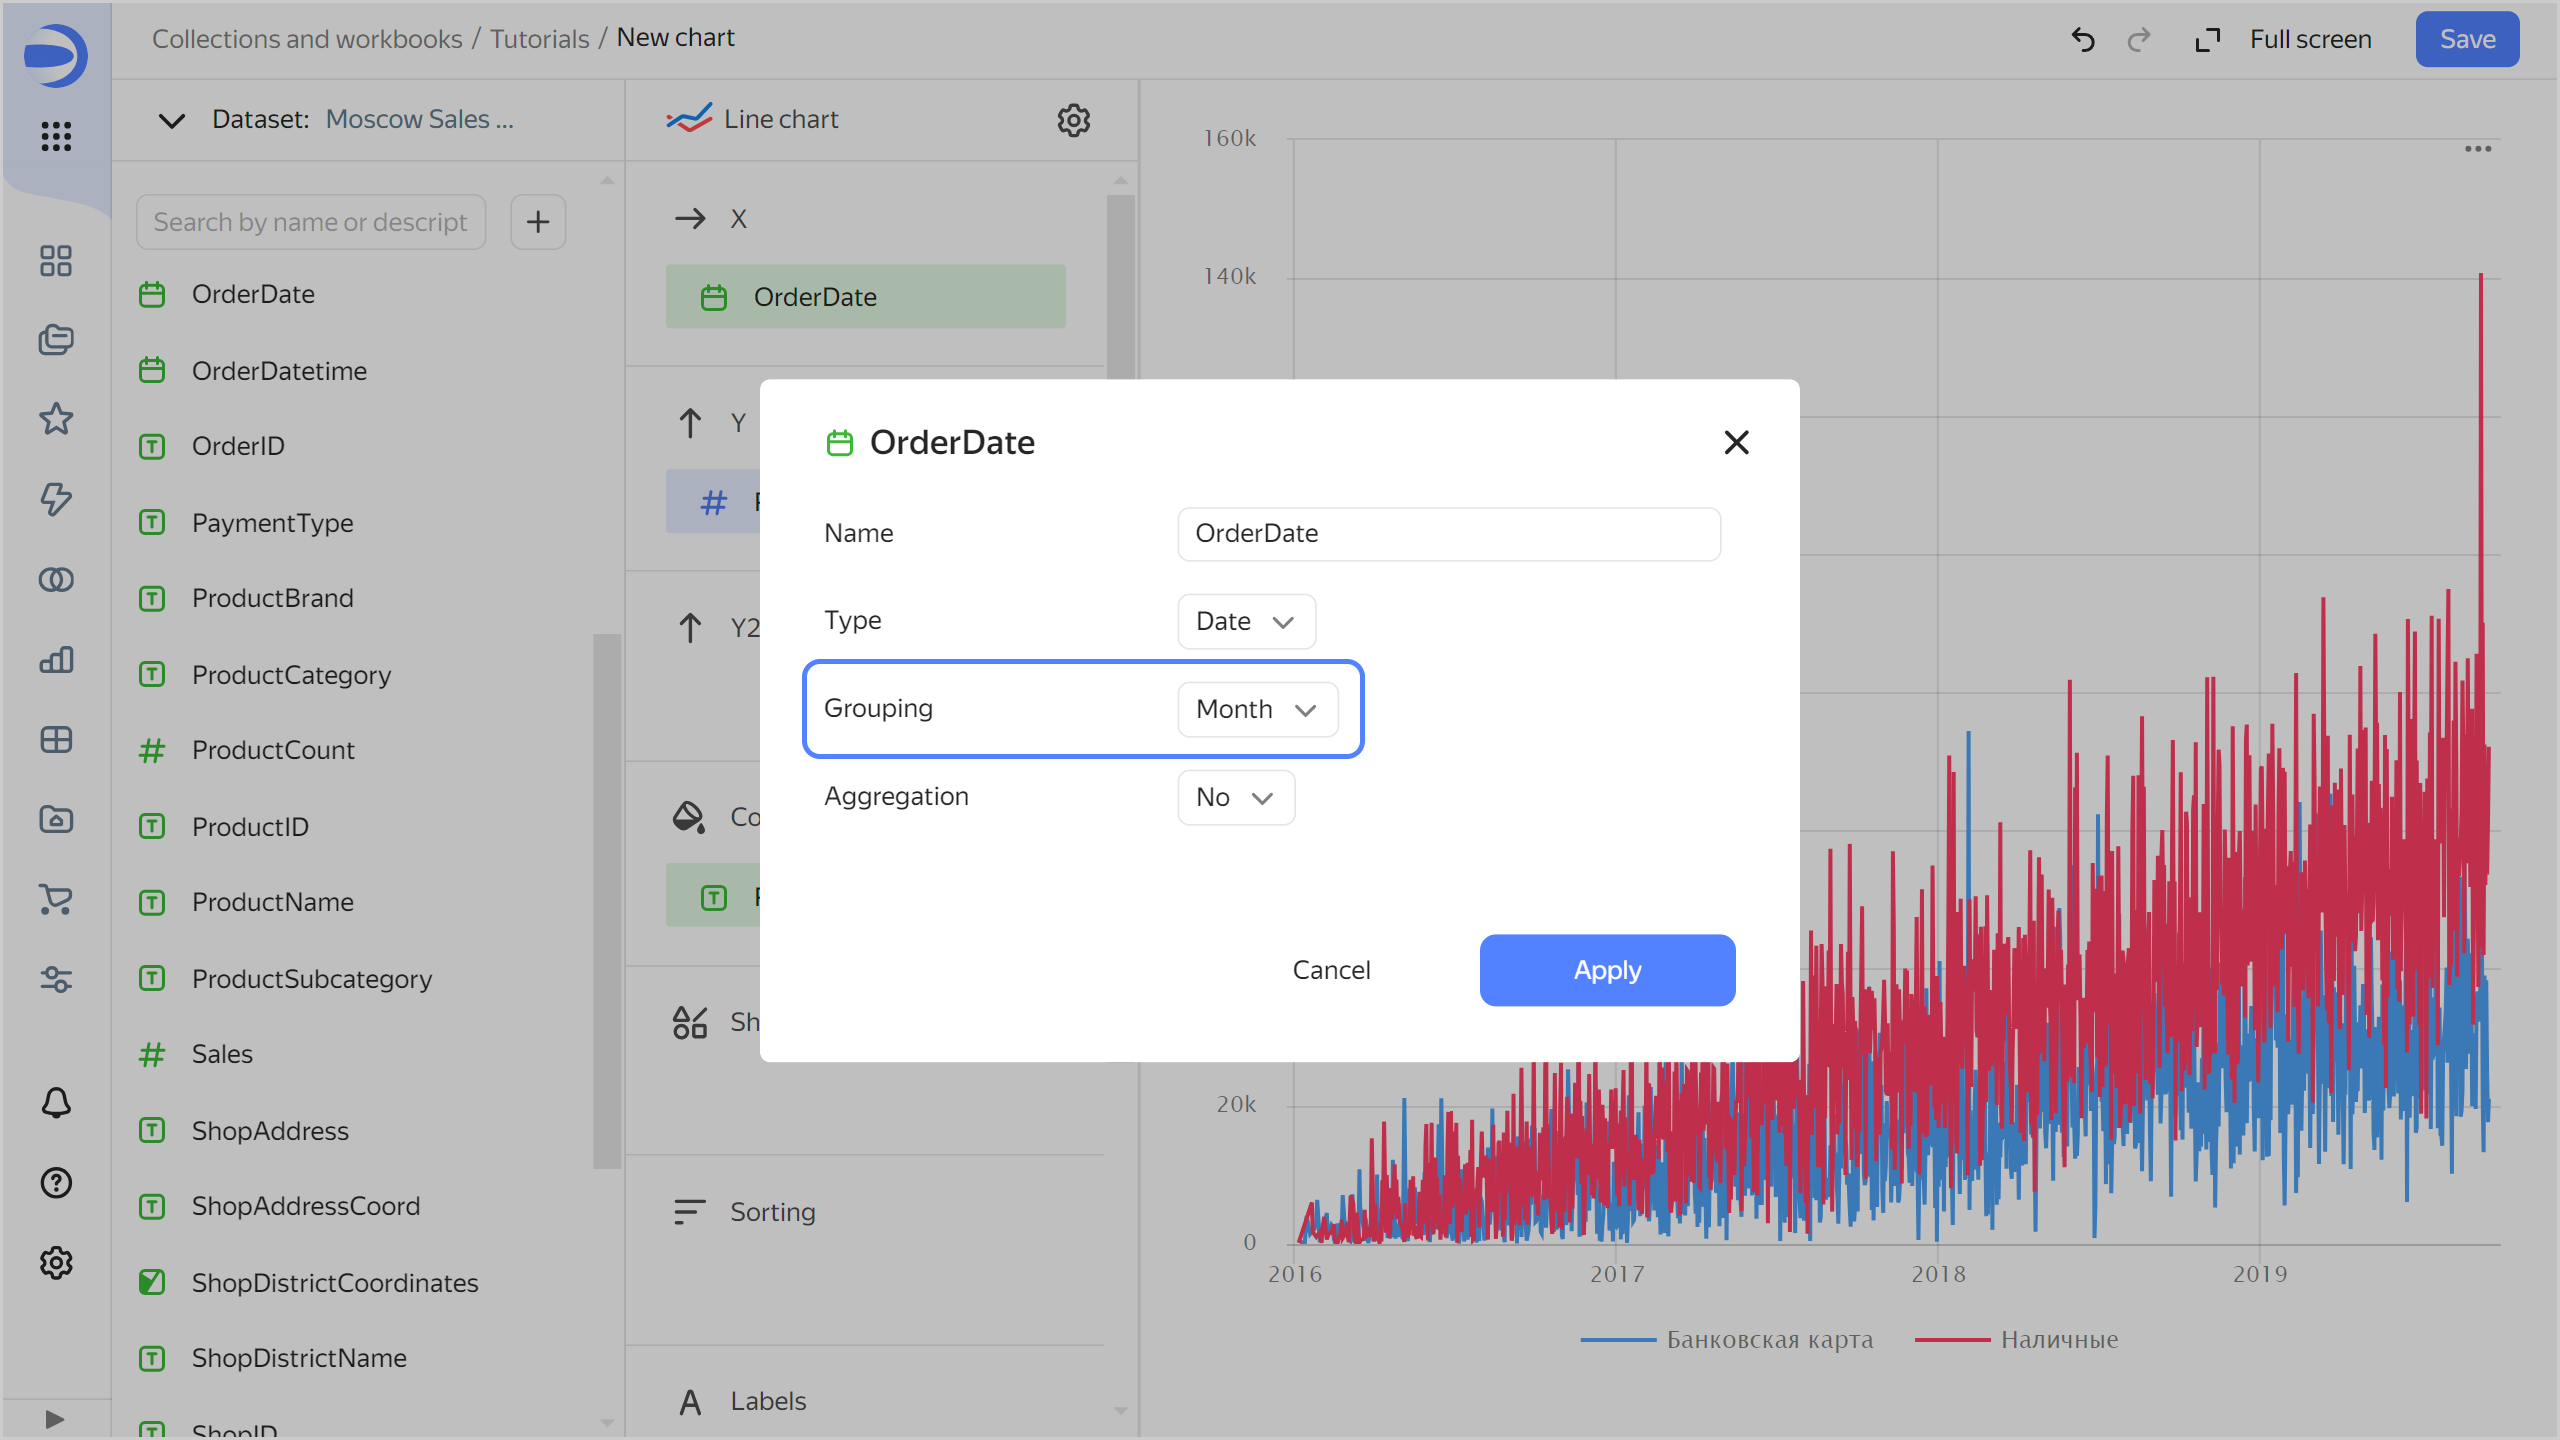
- Click the calendar icon next to the
-
Save the chart:
- In the top-right corner, click Save.
- In the window that opens, enter
Sales dynamics by month and payment typefor the chart name and click Save.
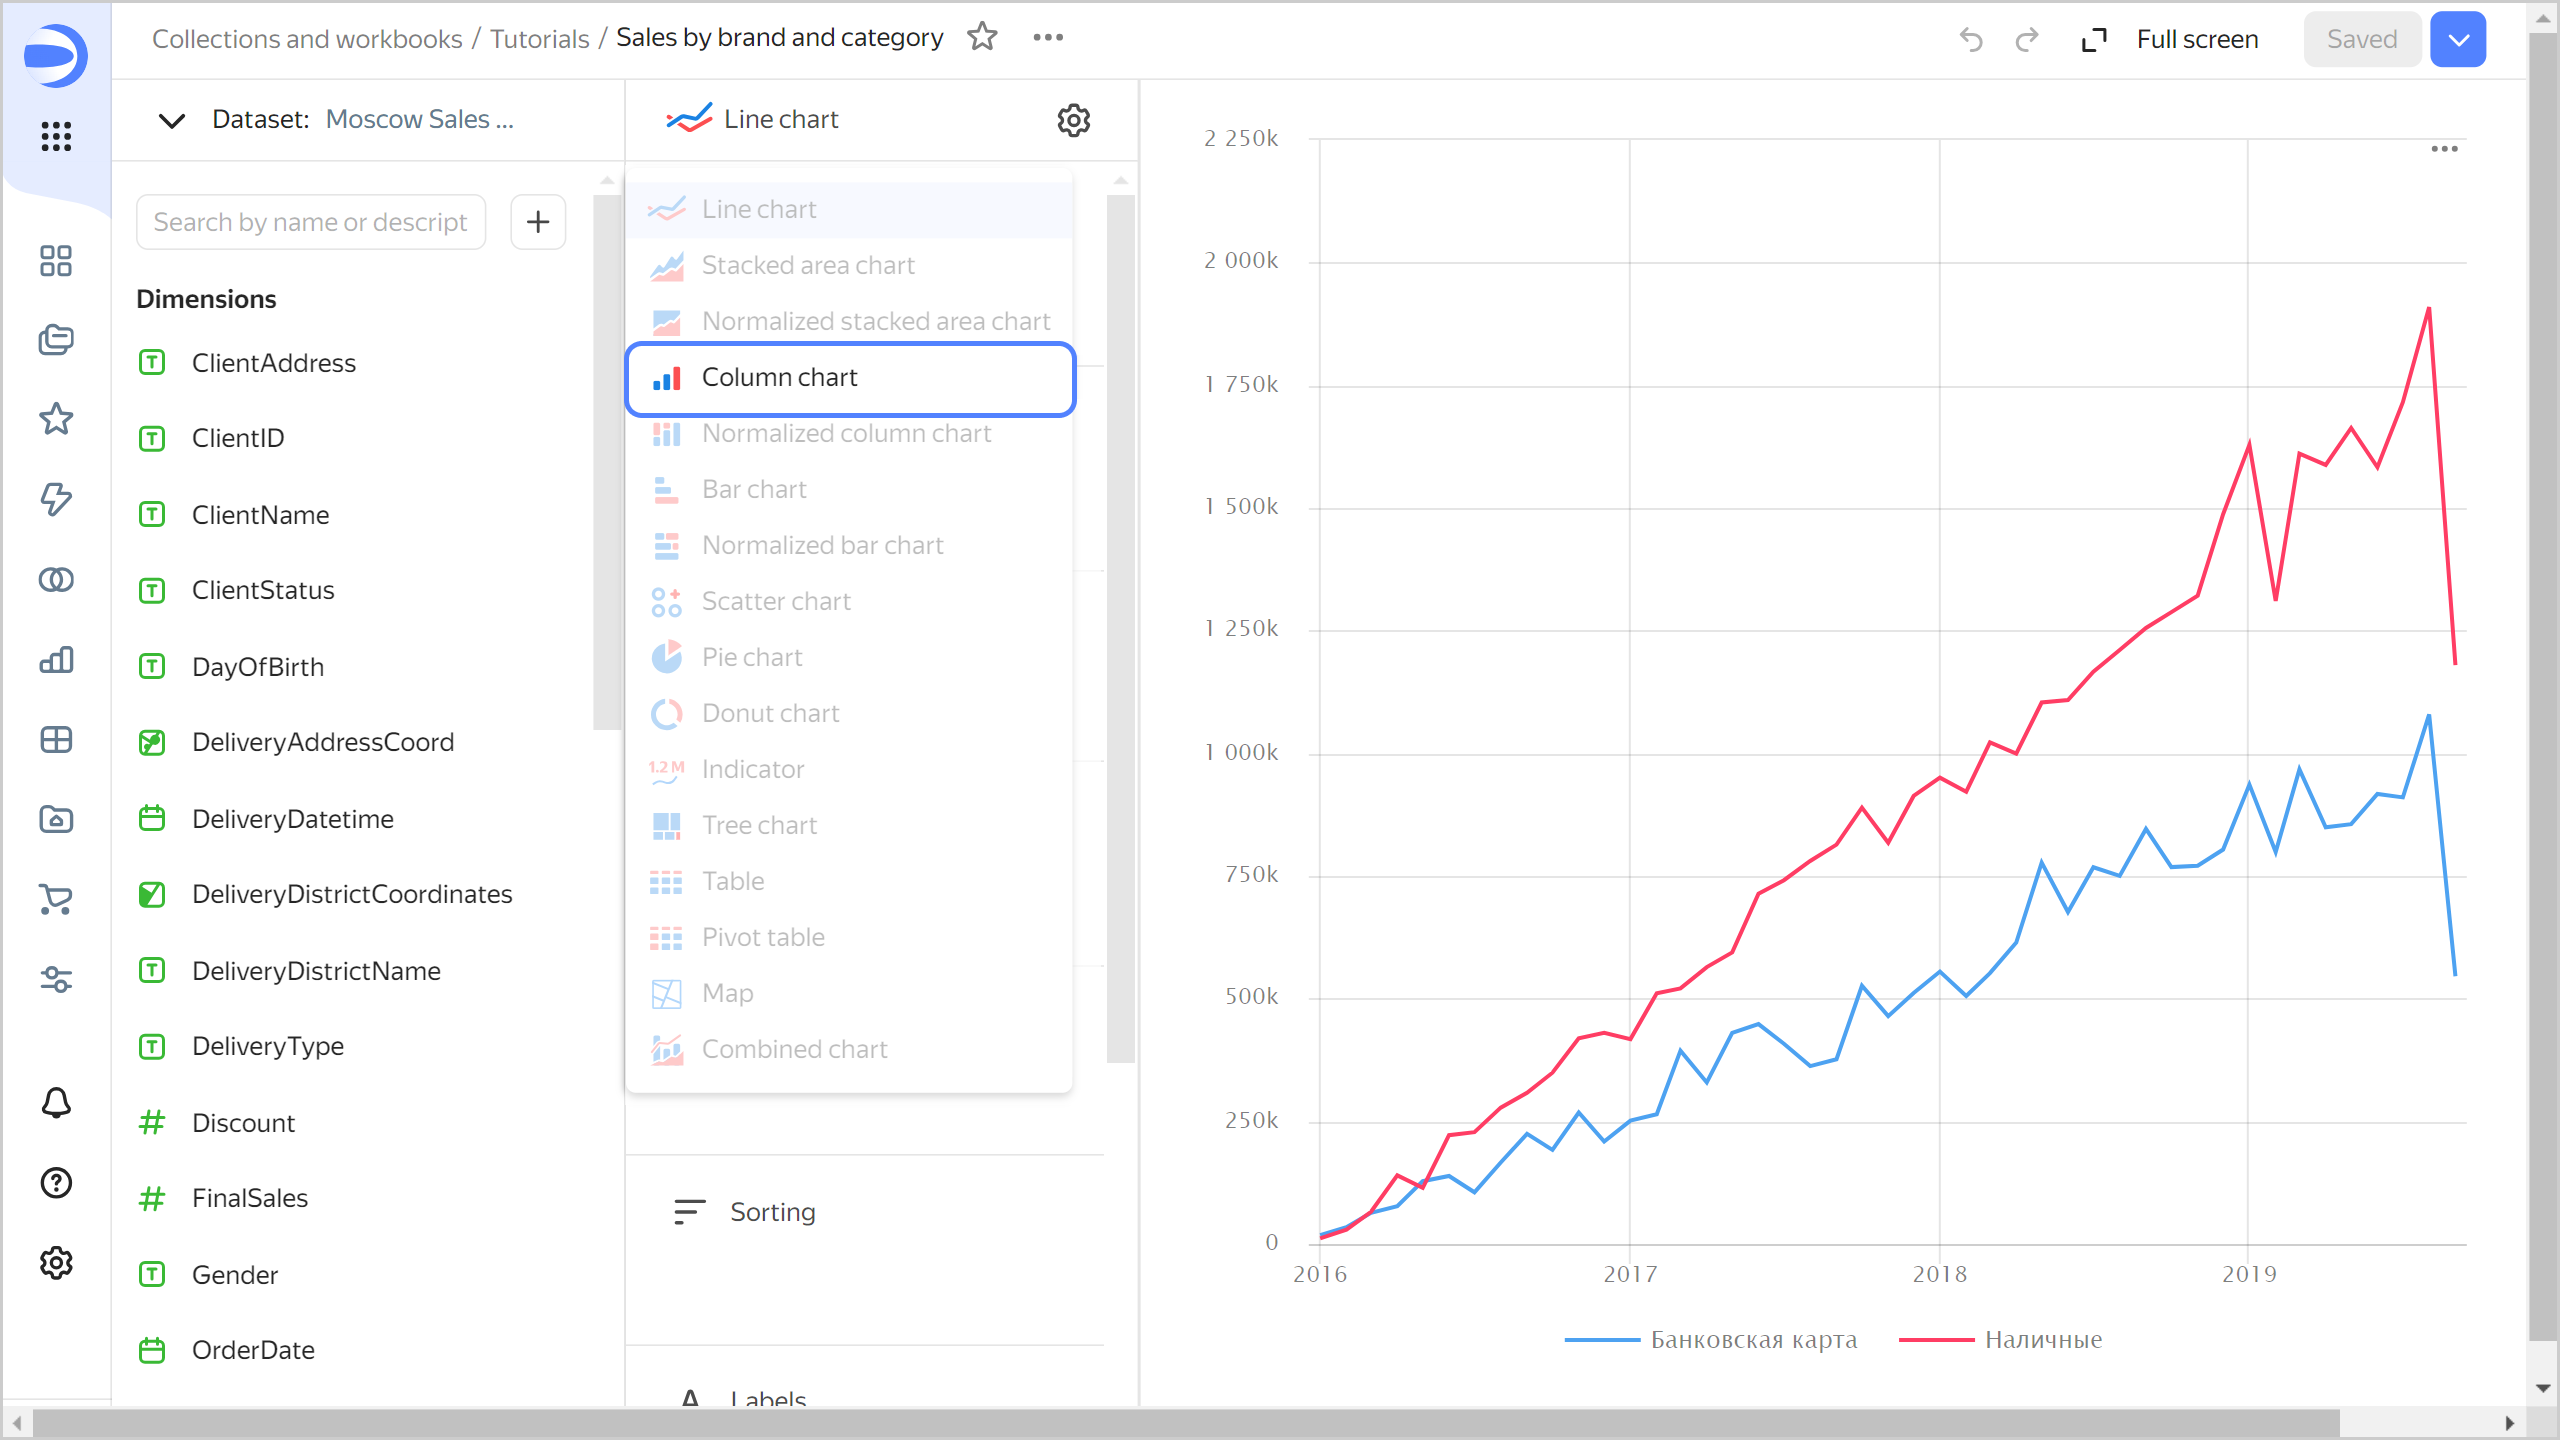
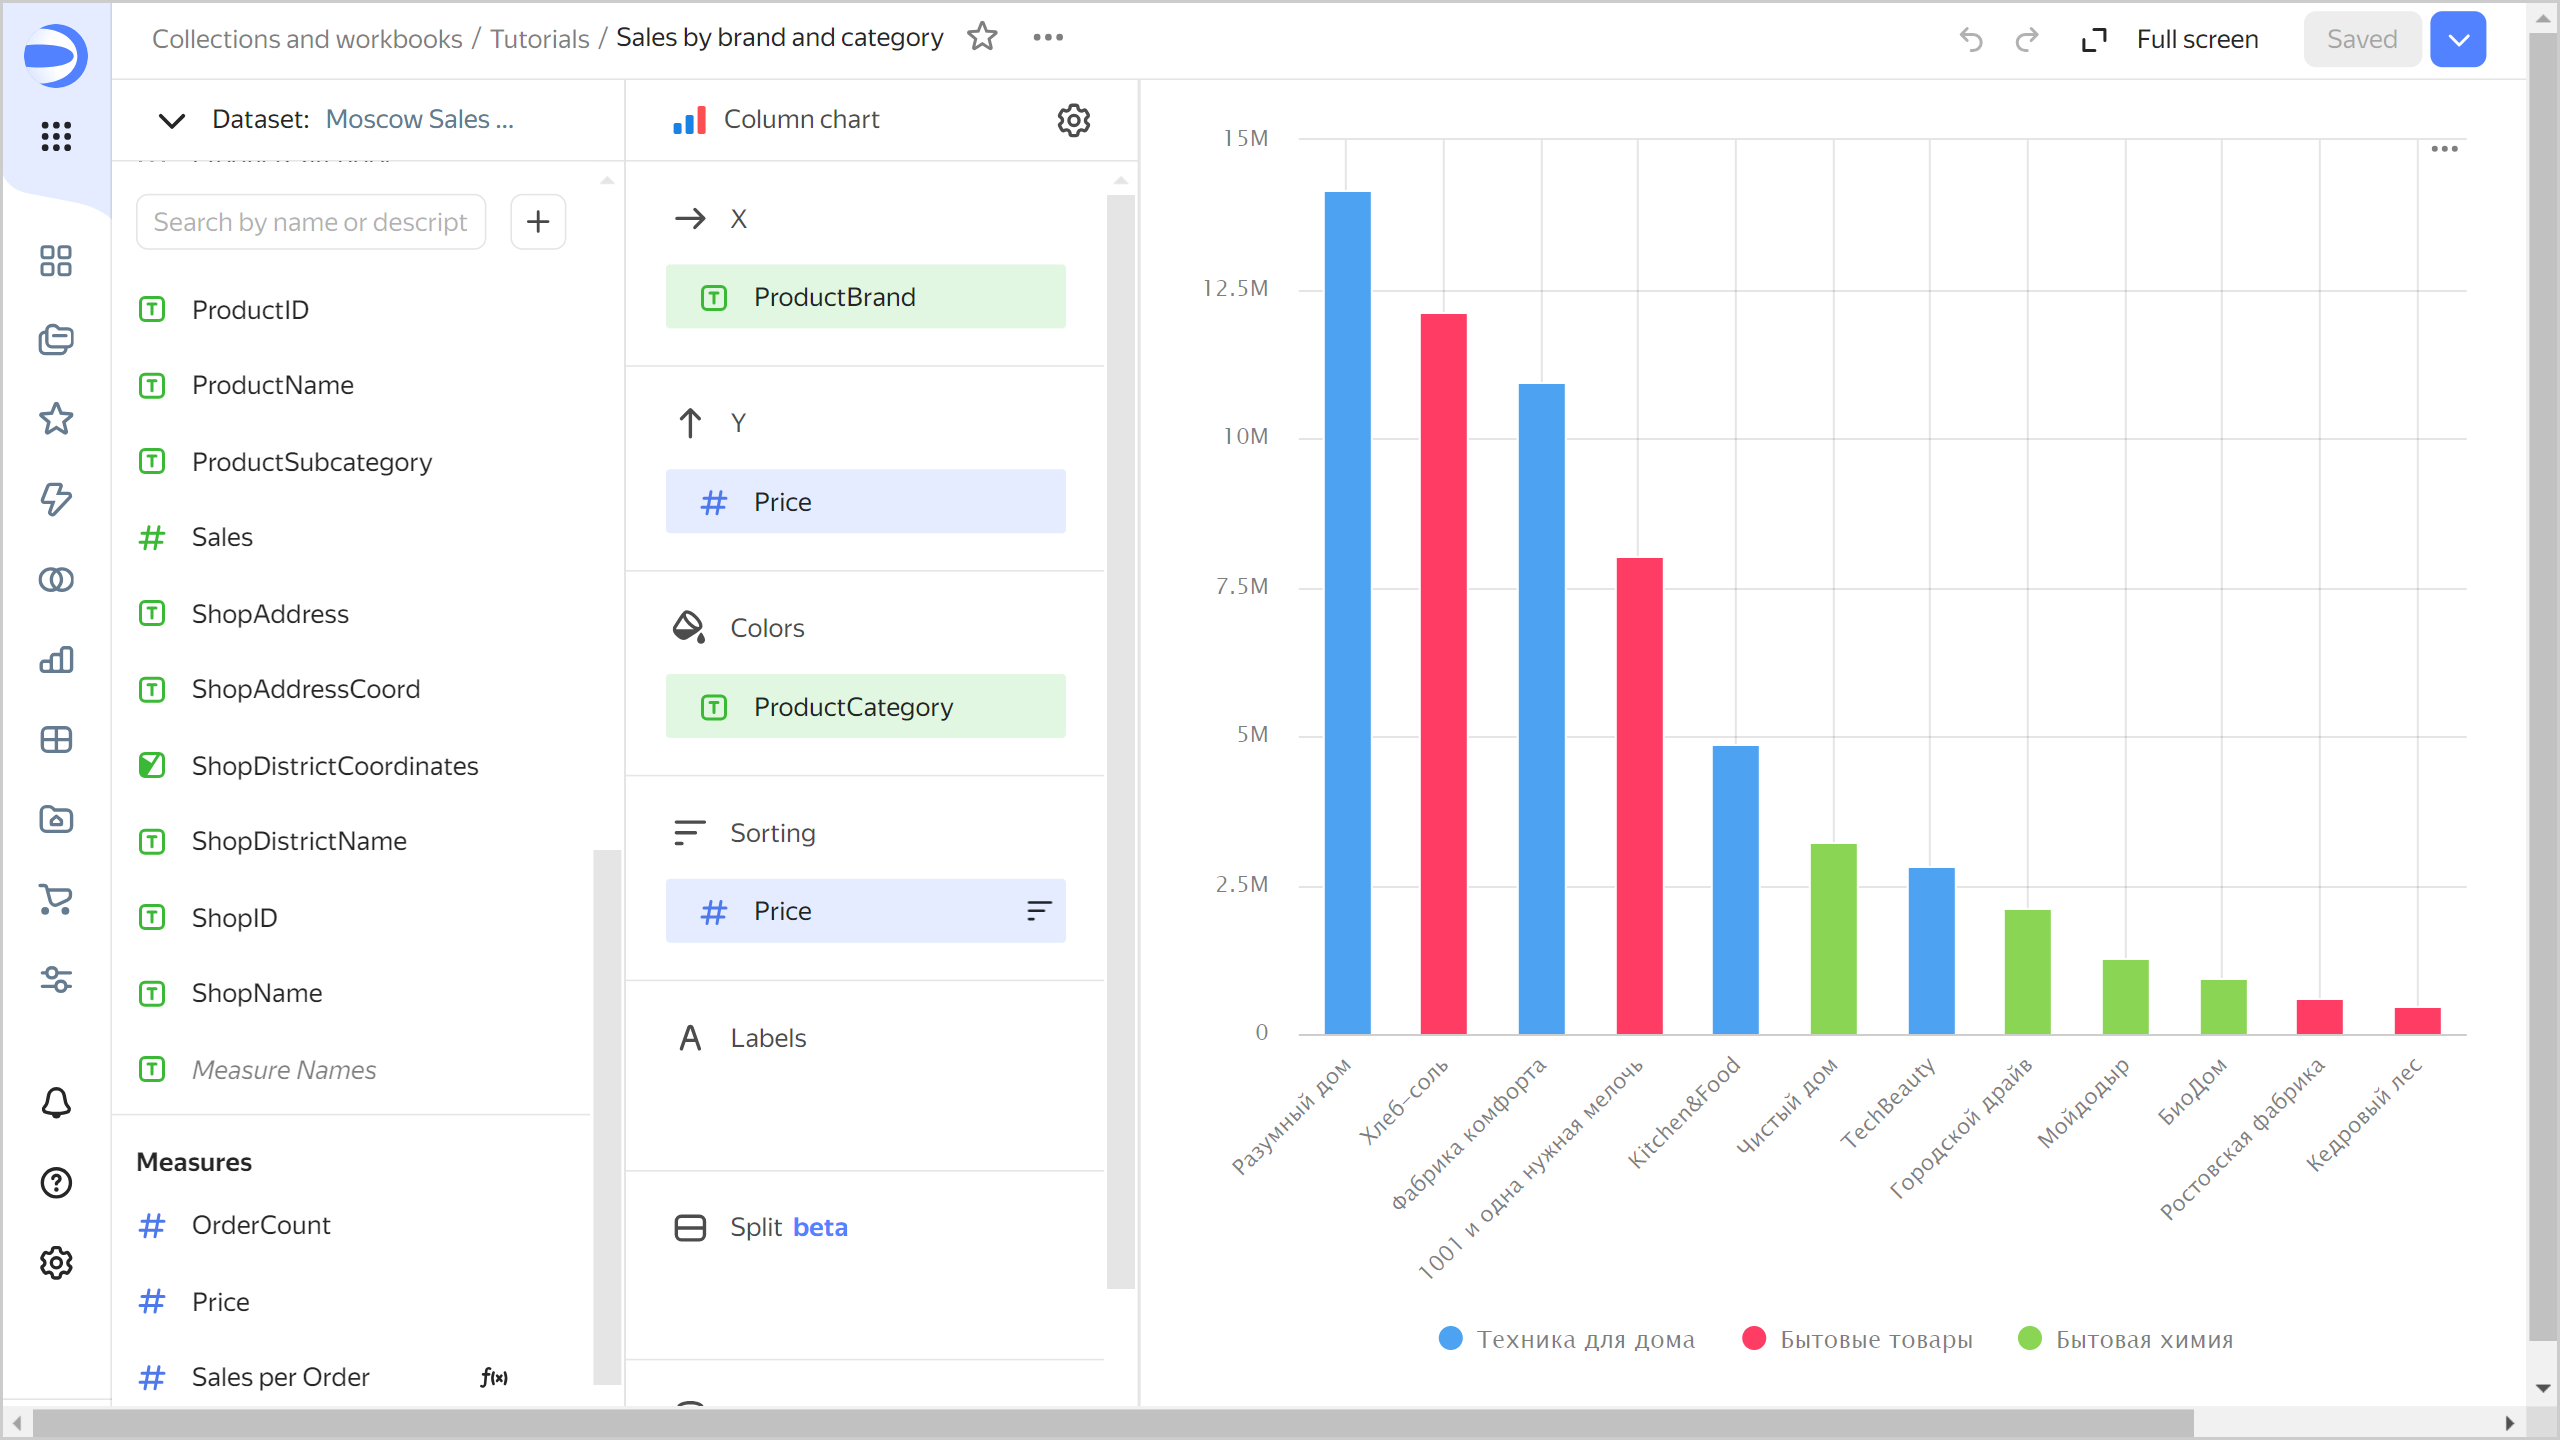
Create a column chart
To visualize sales by brand and product category, create a column chart.
-
Copy the chart you created in the previous step:
-
In the top-right corner, click → Save as copy.
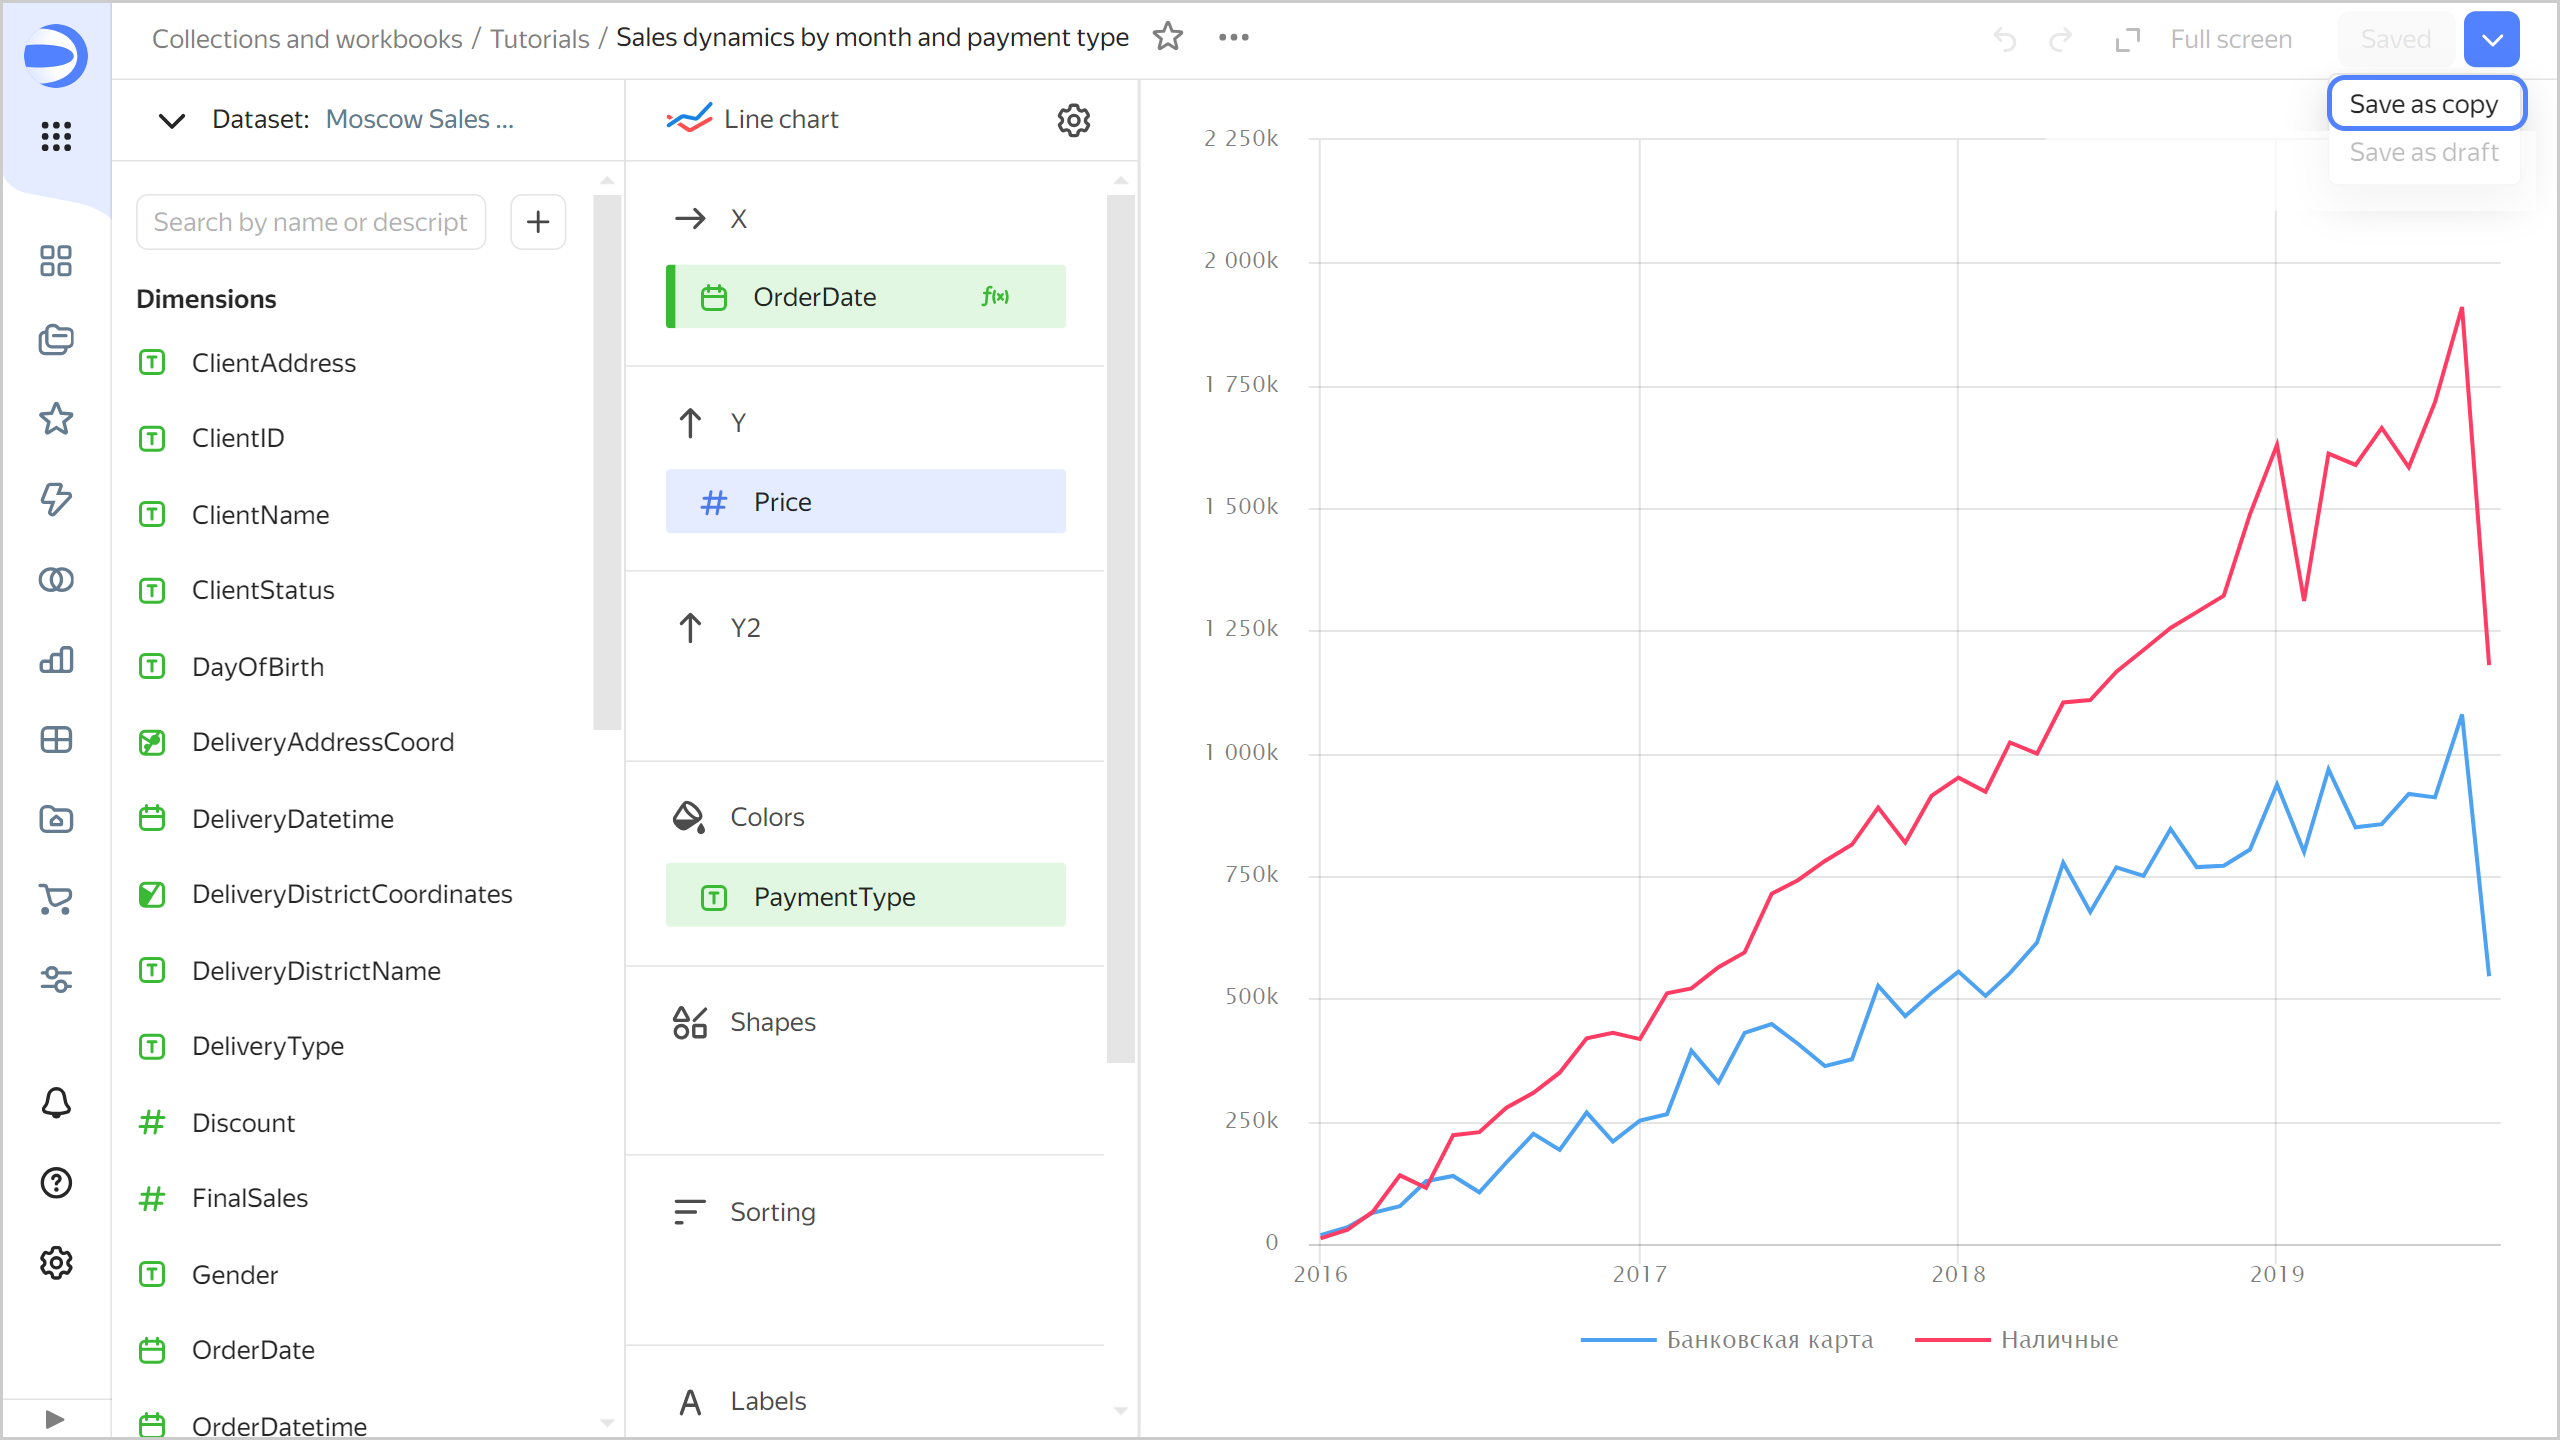
-
In the window that opens, enter
Sales by brand and categoryfor the new chart name and click Save.
-
-
Select Bar chart as the visualization type.
-
The
OrderDate,Price, andPaymentTypefields will automatically appear in the X, Y, and Colors sections, respectively. -
Replace the months with brands on the X-axis. To do this, drag the
ProductBrandfield from Dimensions to the X section and hold it over theOrderDatefield until the latter turns red. -
Under Colors, replace payment types with product categories. To do this, drag the
ProductCategoryfield from Dimensions to the Colors section and hold it over thePaymentTypefield until the latter turns red. -
Sort the chart in descending order of the sales measure. To do this, drag the
Pricefield from Measures to the Sorting section. -
Save your chart: click Save in the top-right corner.
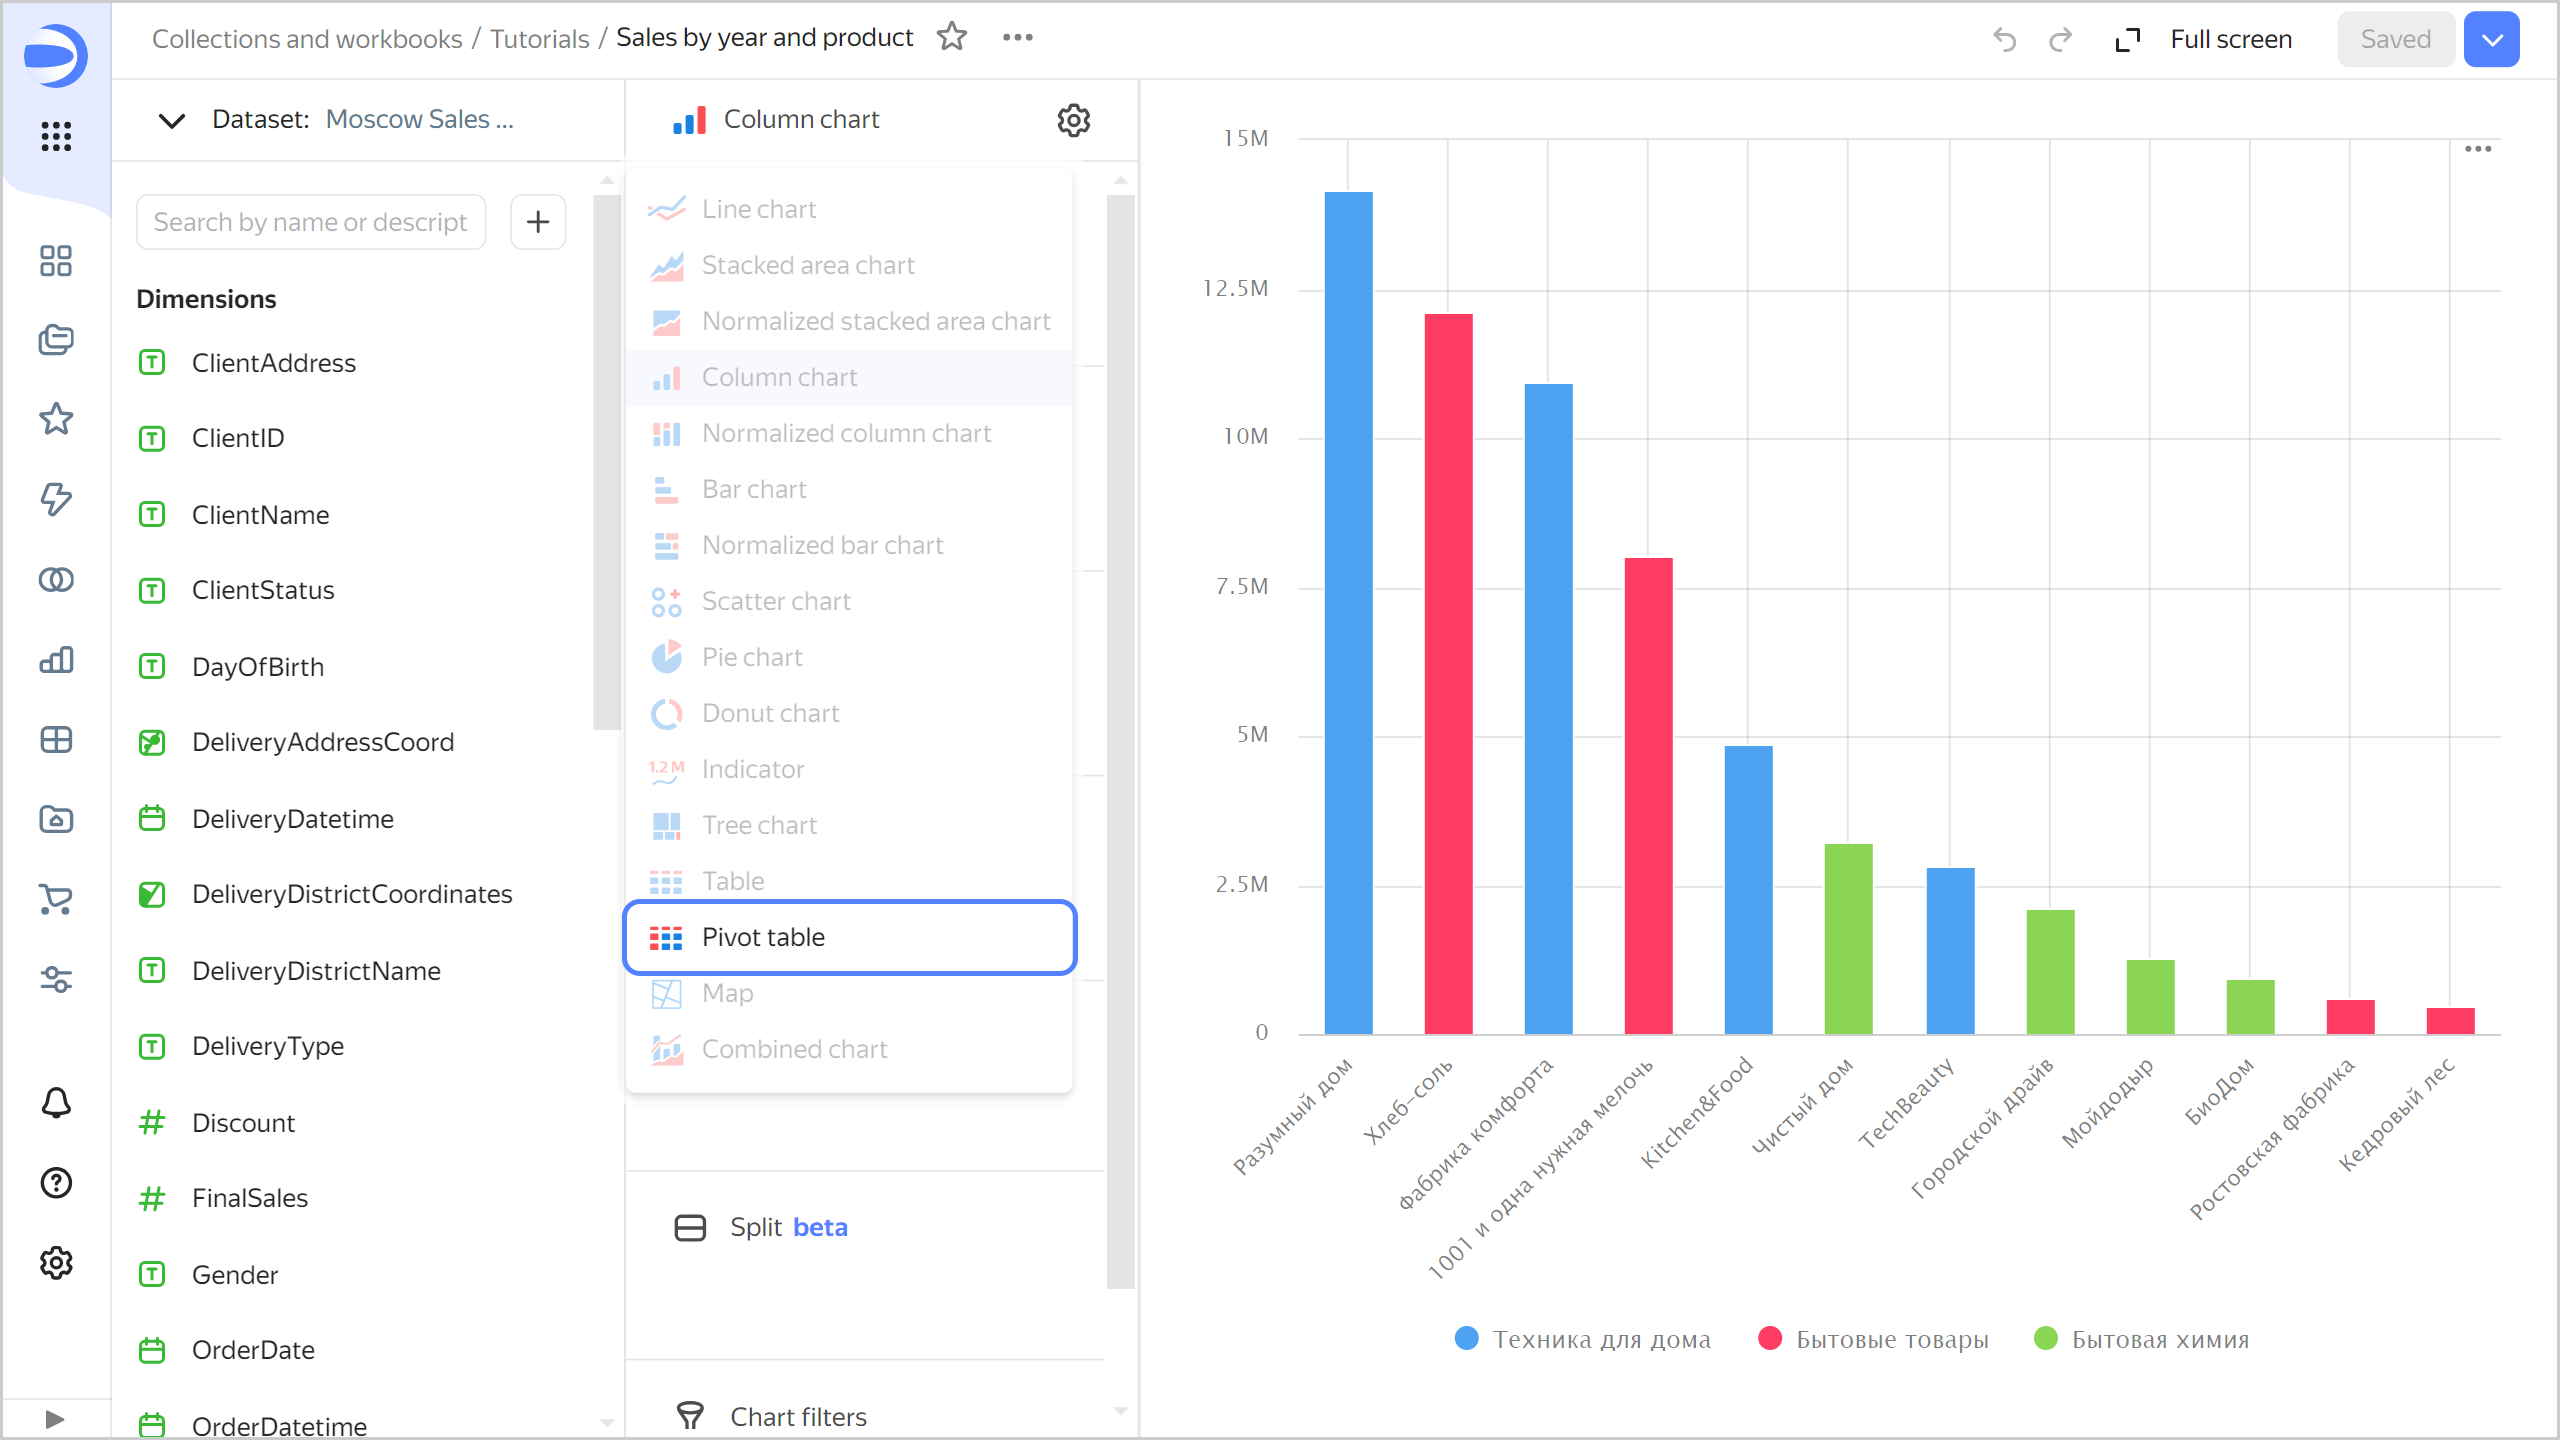
Create a pivot table chart
To visualize sales by product and time, create a pivot table chart:
-
Copy the chart you created in the previous step:
- In the top-right corner, click → Save as copy.
- In the window that opens, enter
Sales by year and productfor the new chart name and click Save.
-
Select the Pivot table visualization type.
-
The
ProductBrandandPricefields will automatically appear in the Columns and Measures sections, respectively. -
Remove
ProductBrandfrom the table. To do this, click (the icon appears when you hover over the field) next to the field in the Columns section. -
Add the order date to the table. To do this, drag the
OrderDatefield from Dimensions to the Columns section. -
Change the display format in the
OrderDatefield to years:- Click the calendar icon next to the
OrderDatefield in the Columns section. - In the Grouping field, select Date portion ⟶ Year and click Apply.
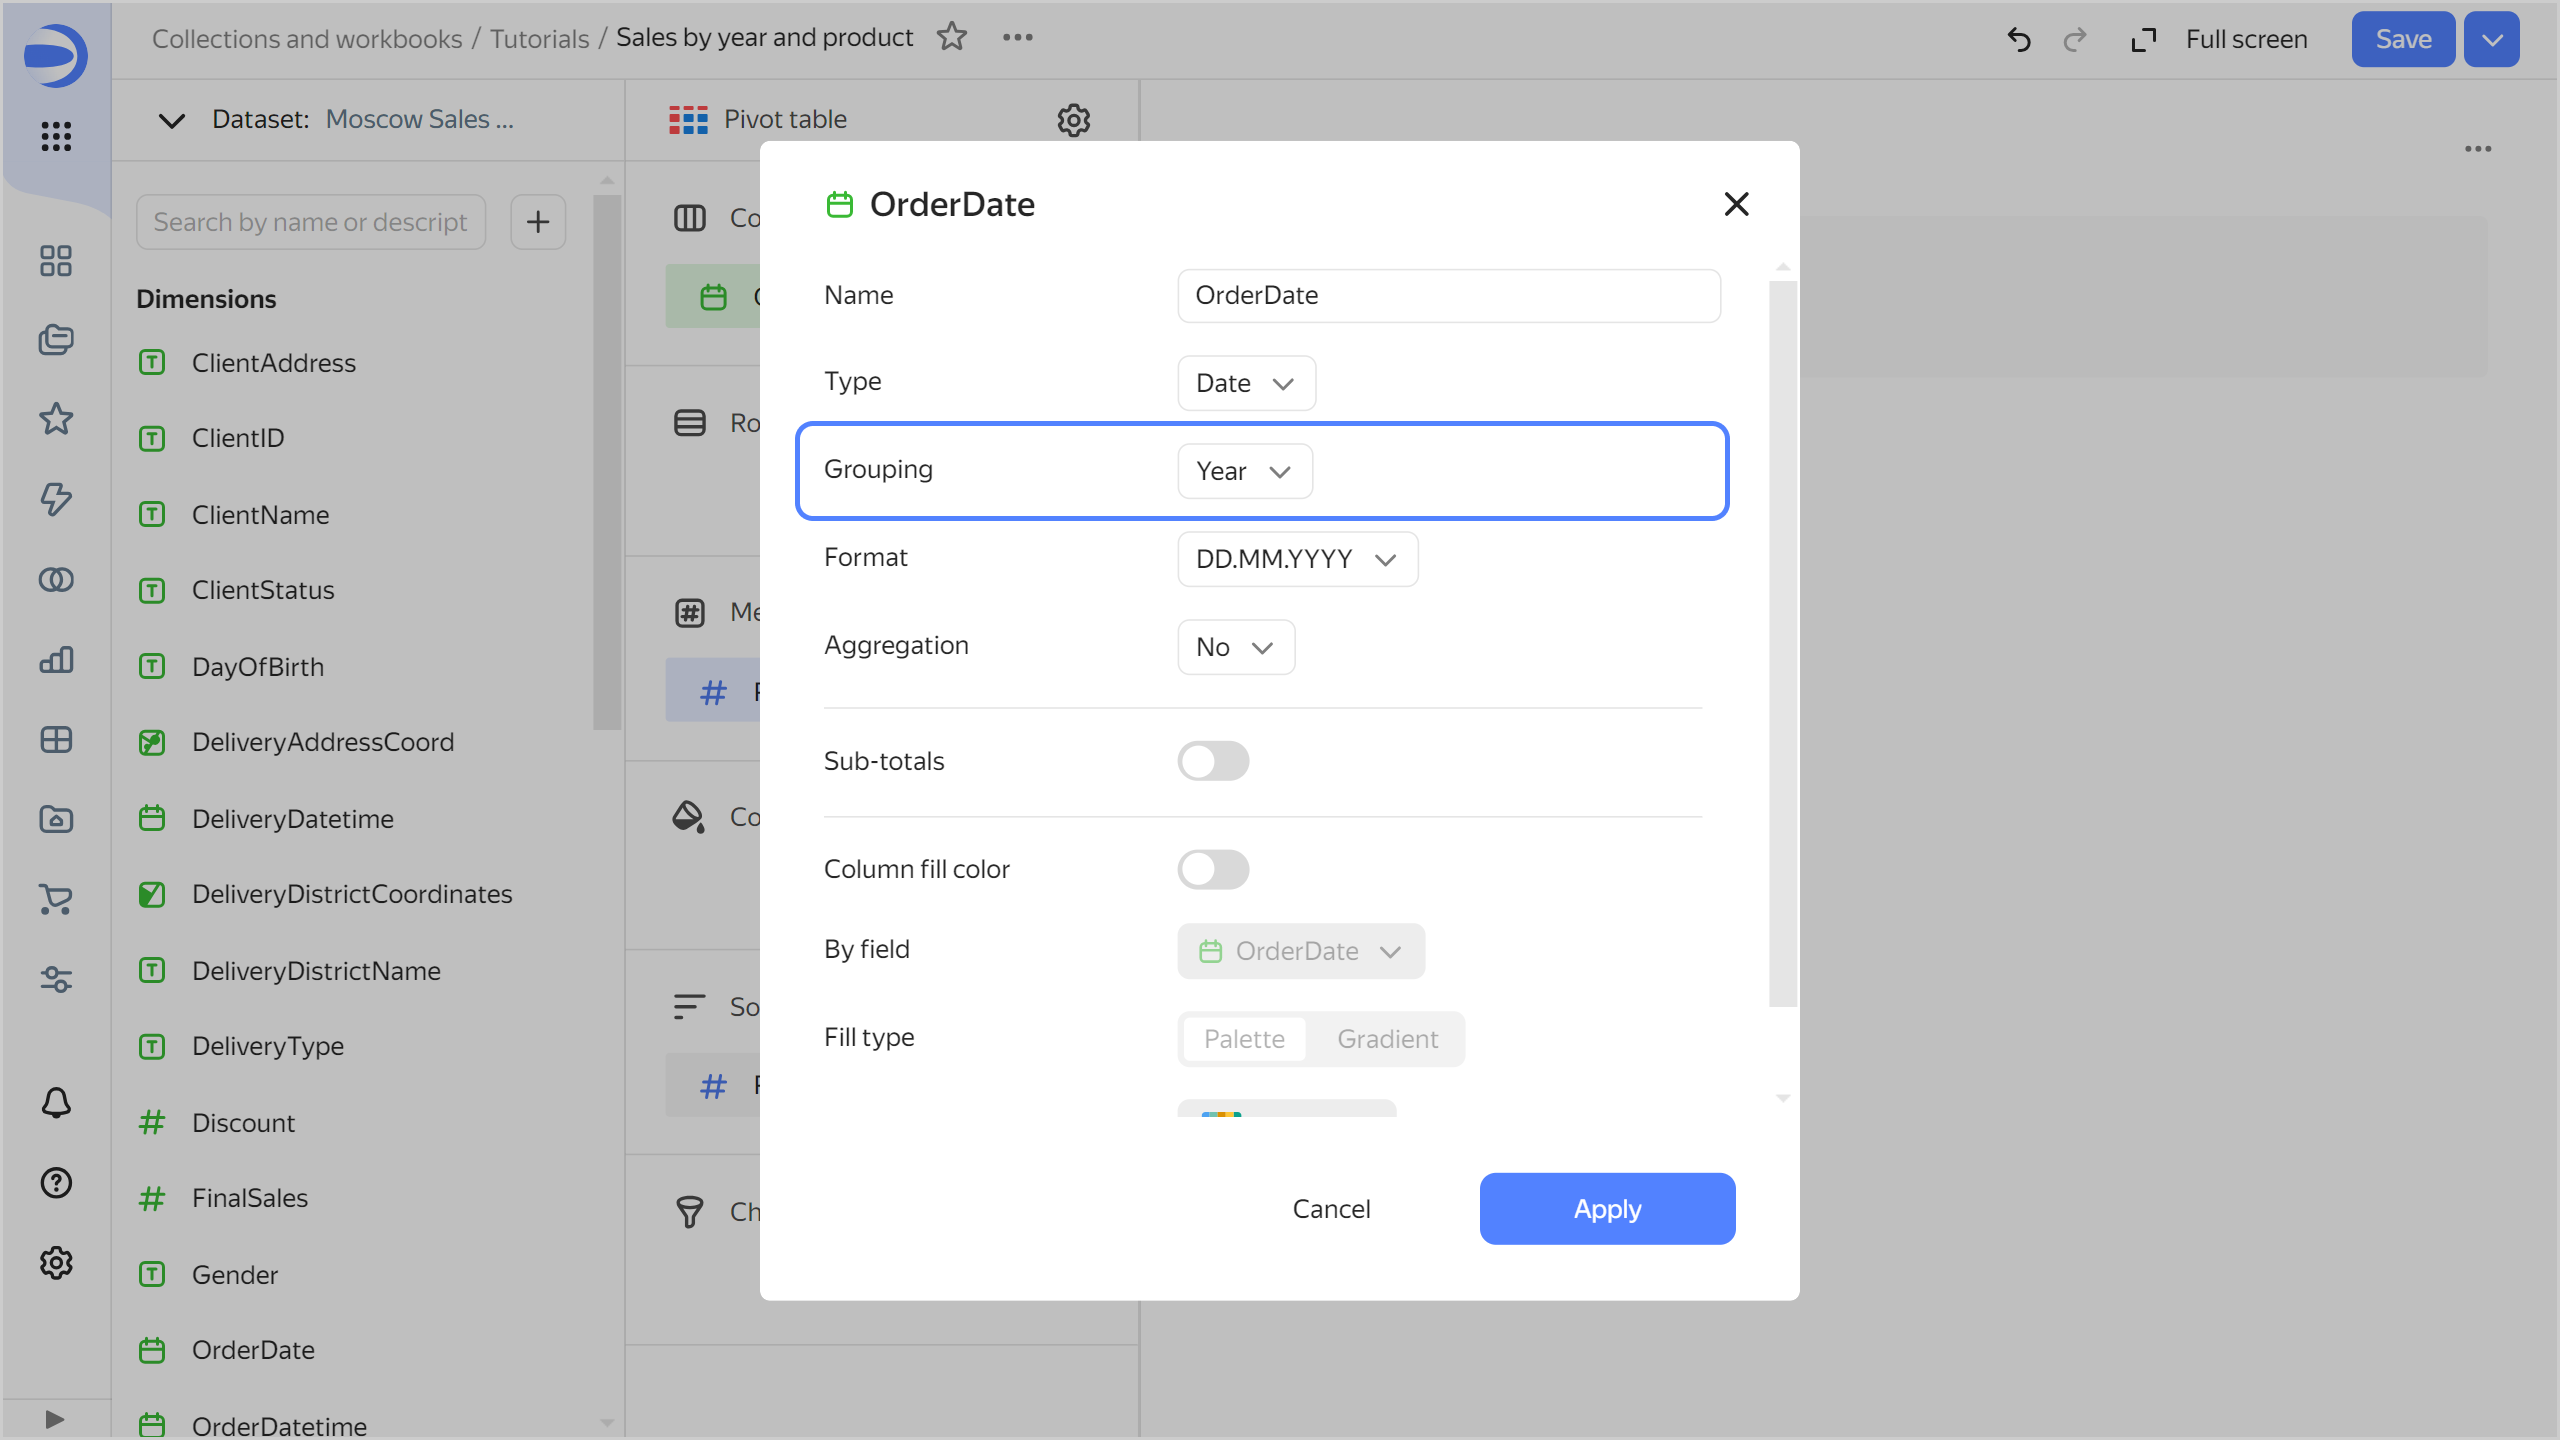
- Click the calendar icon next to the
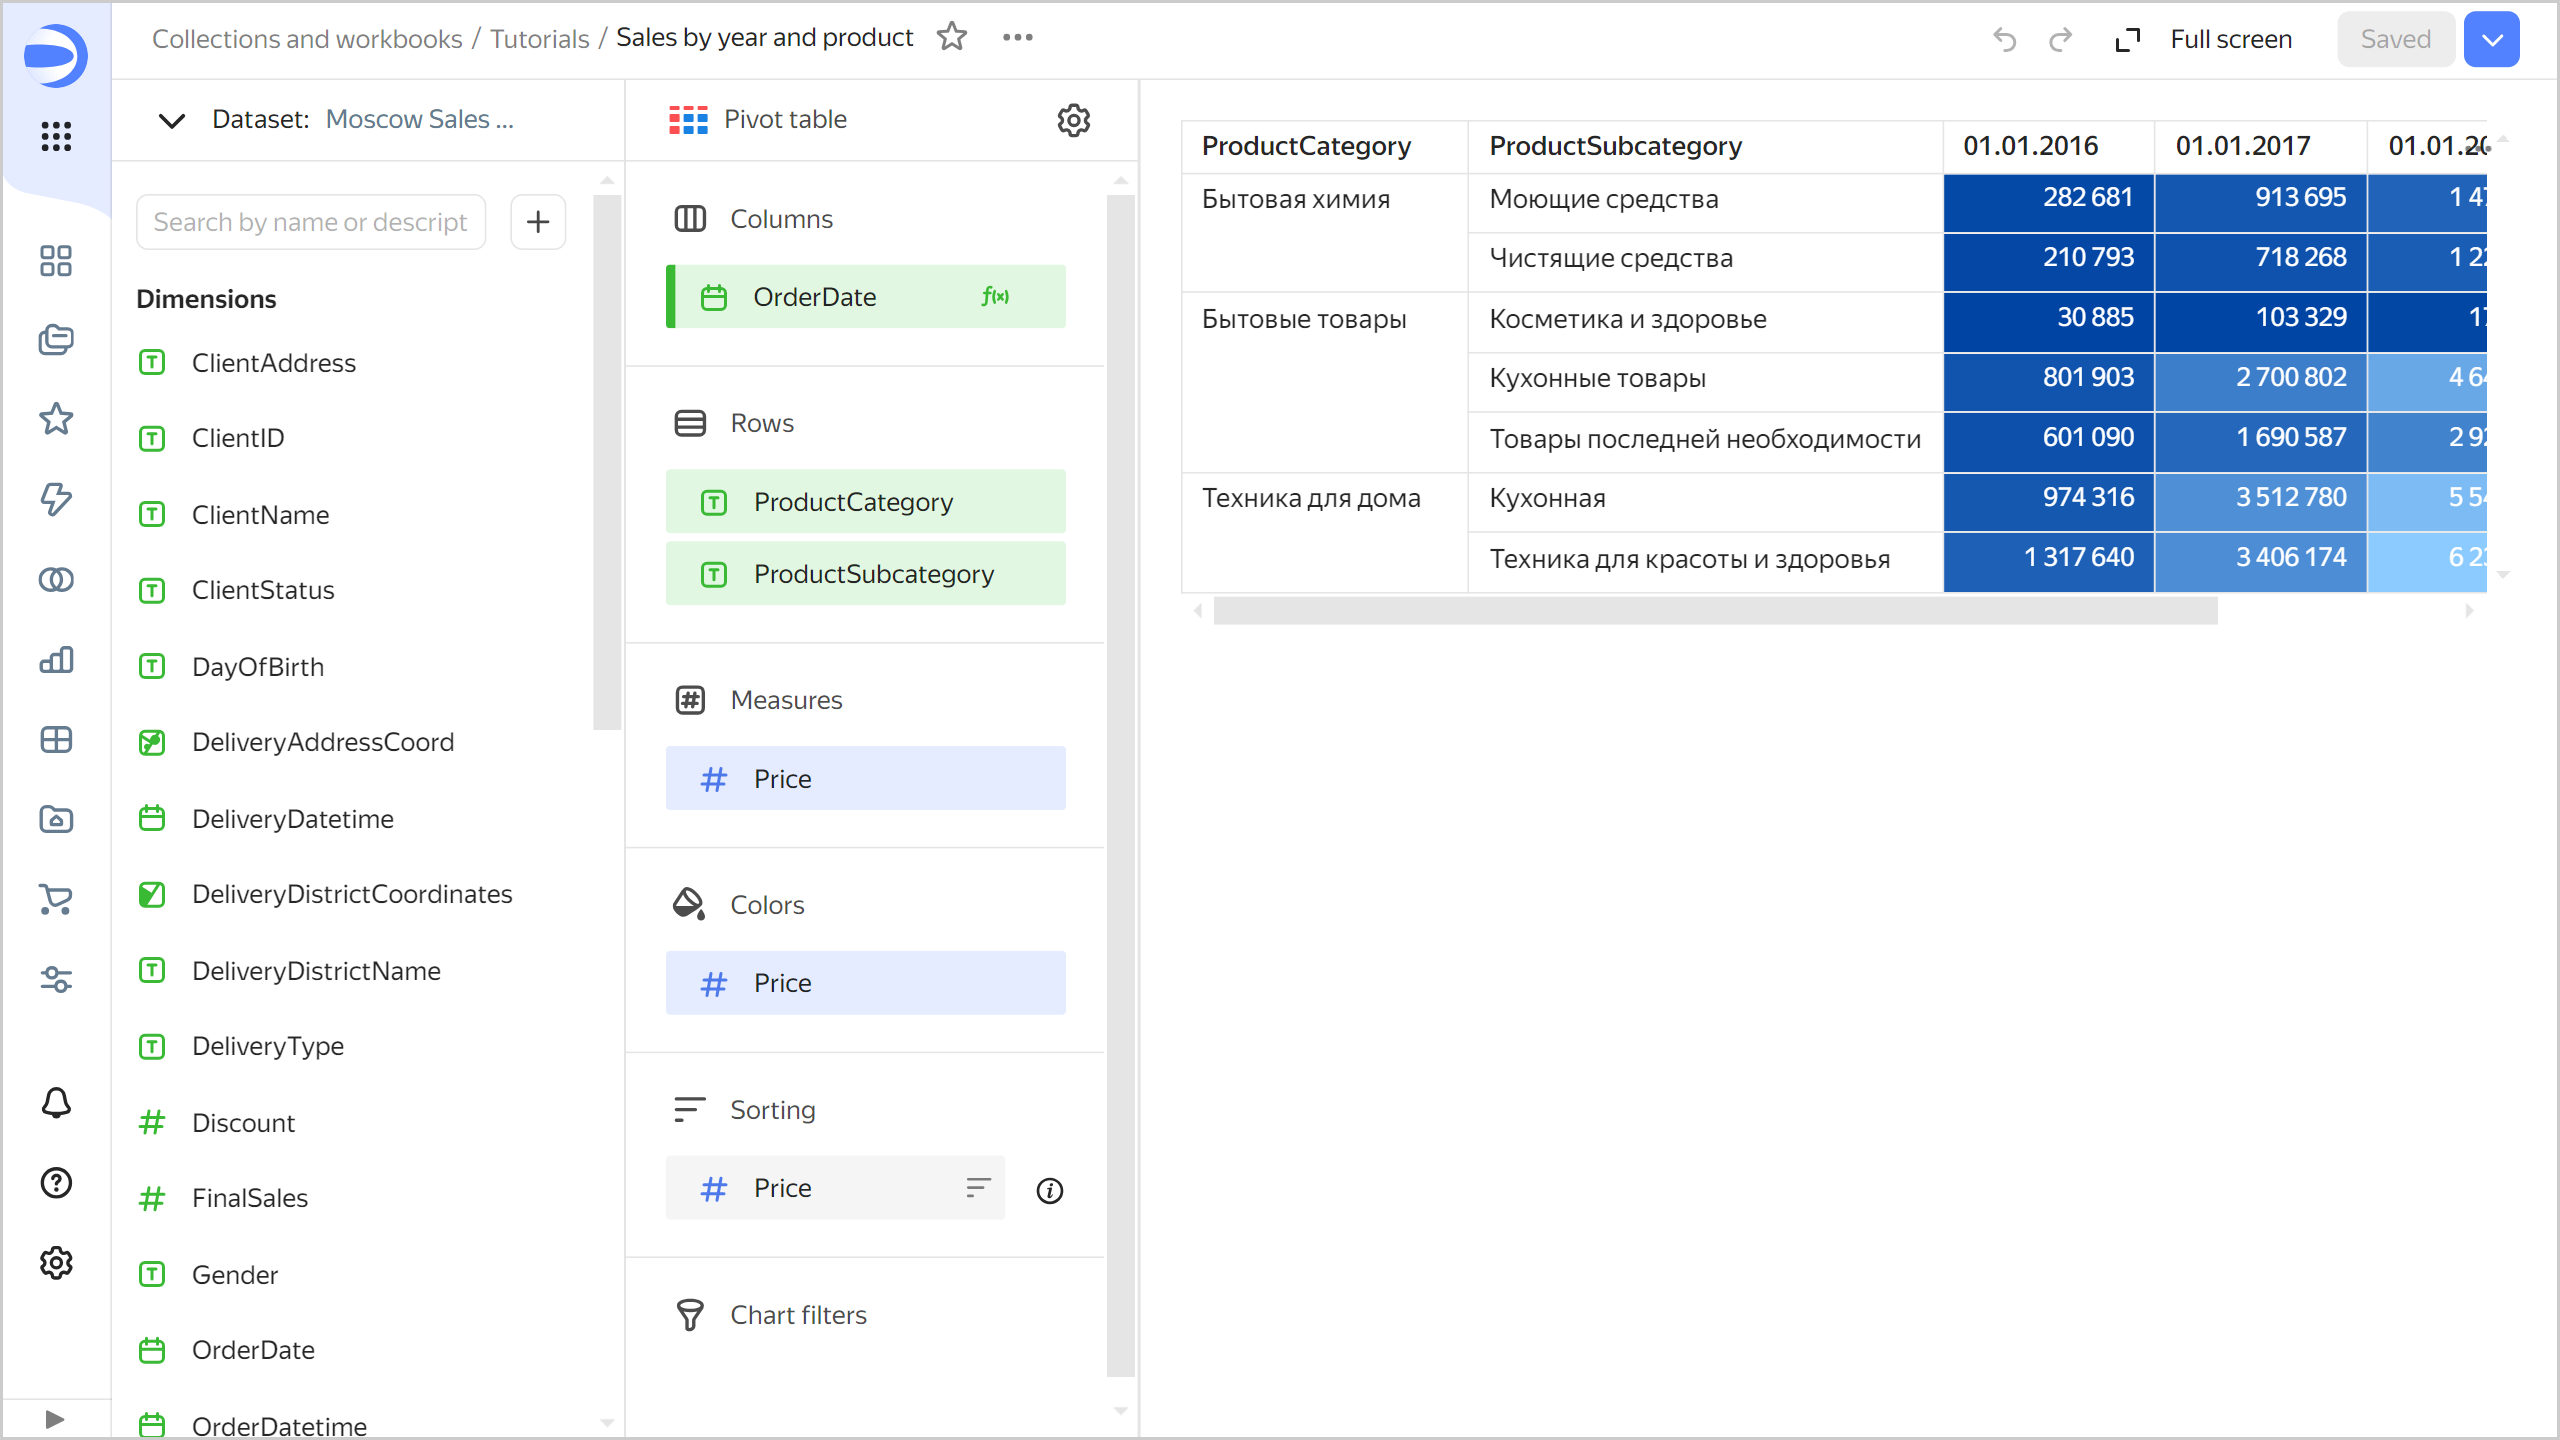
-
Add the product category and subcategory to the table. To do this, drag the
ProductCategoryandProductSubcategoryfields from Dimensions to the Rows section. -
Change the color of the sales measure in the table. To do this, drag the
Pricefield from Measures to the Colors section. -
In the top-right corner, click Save.
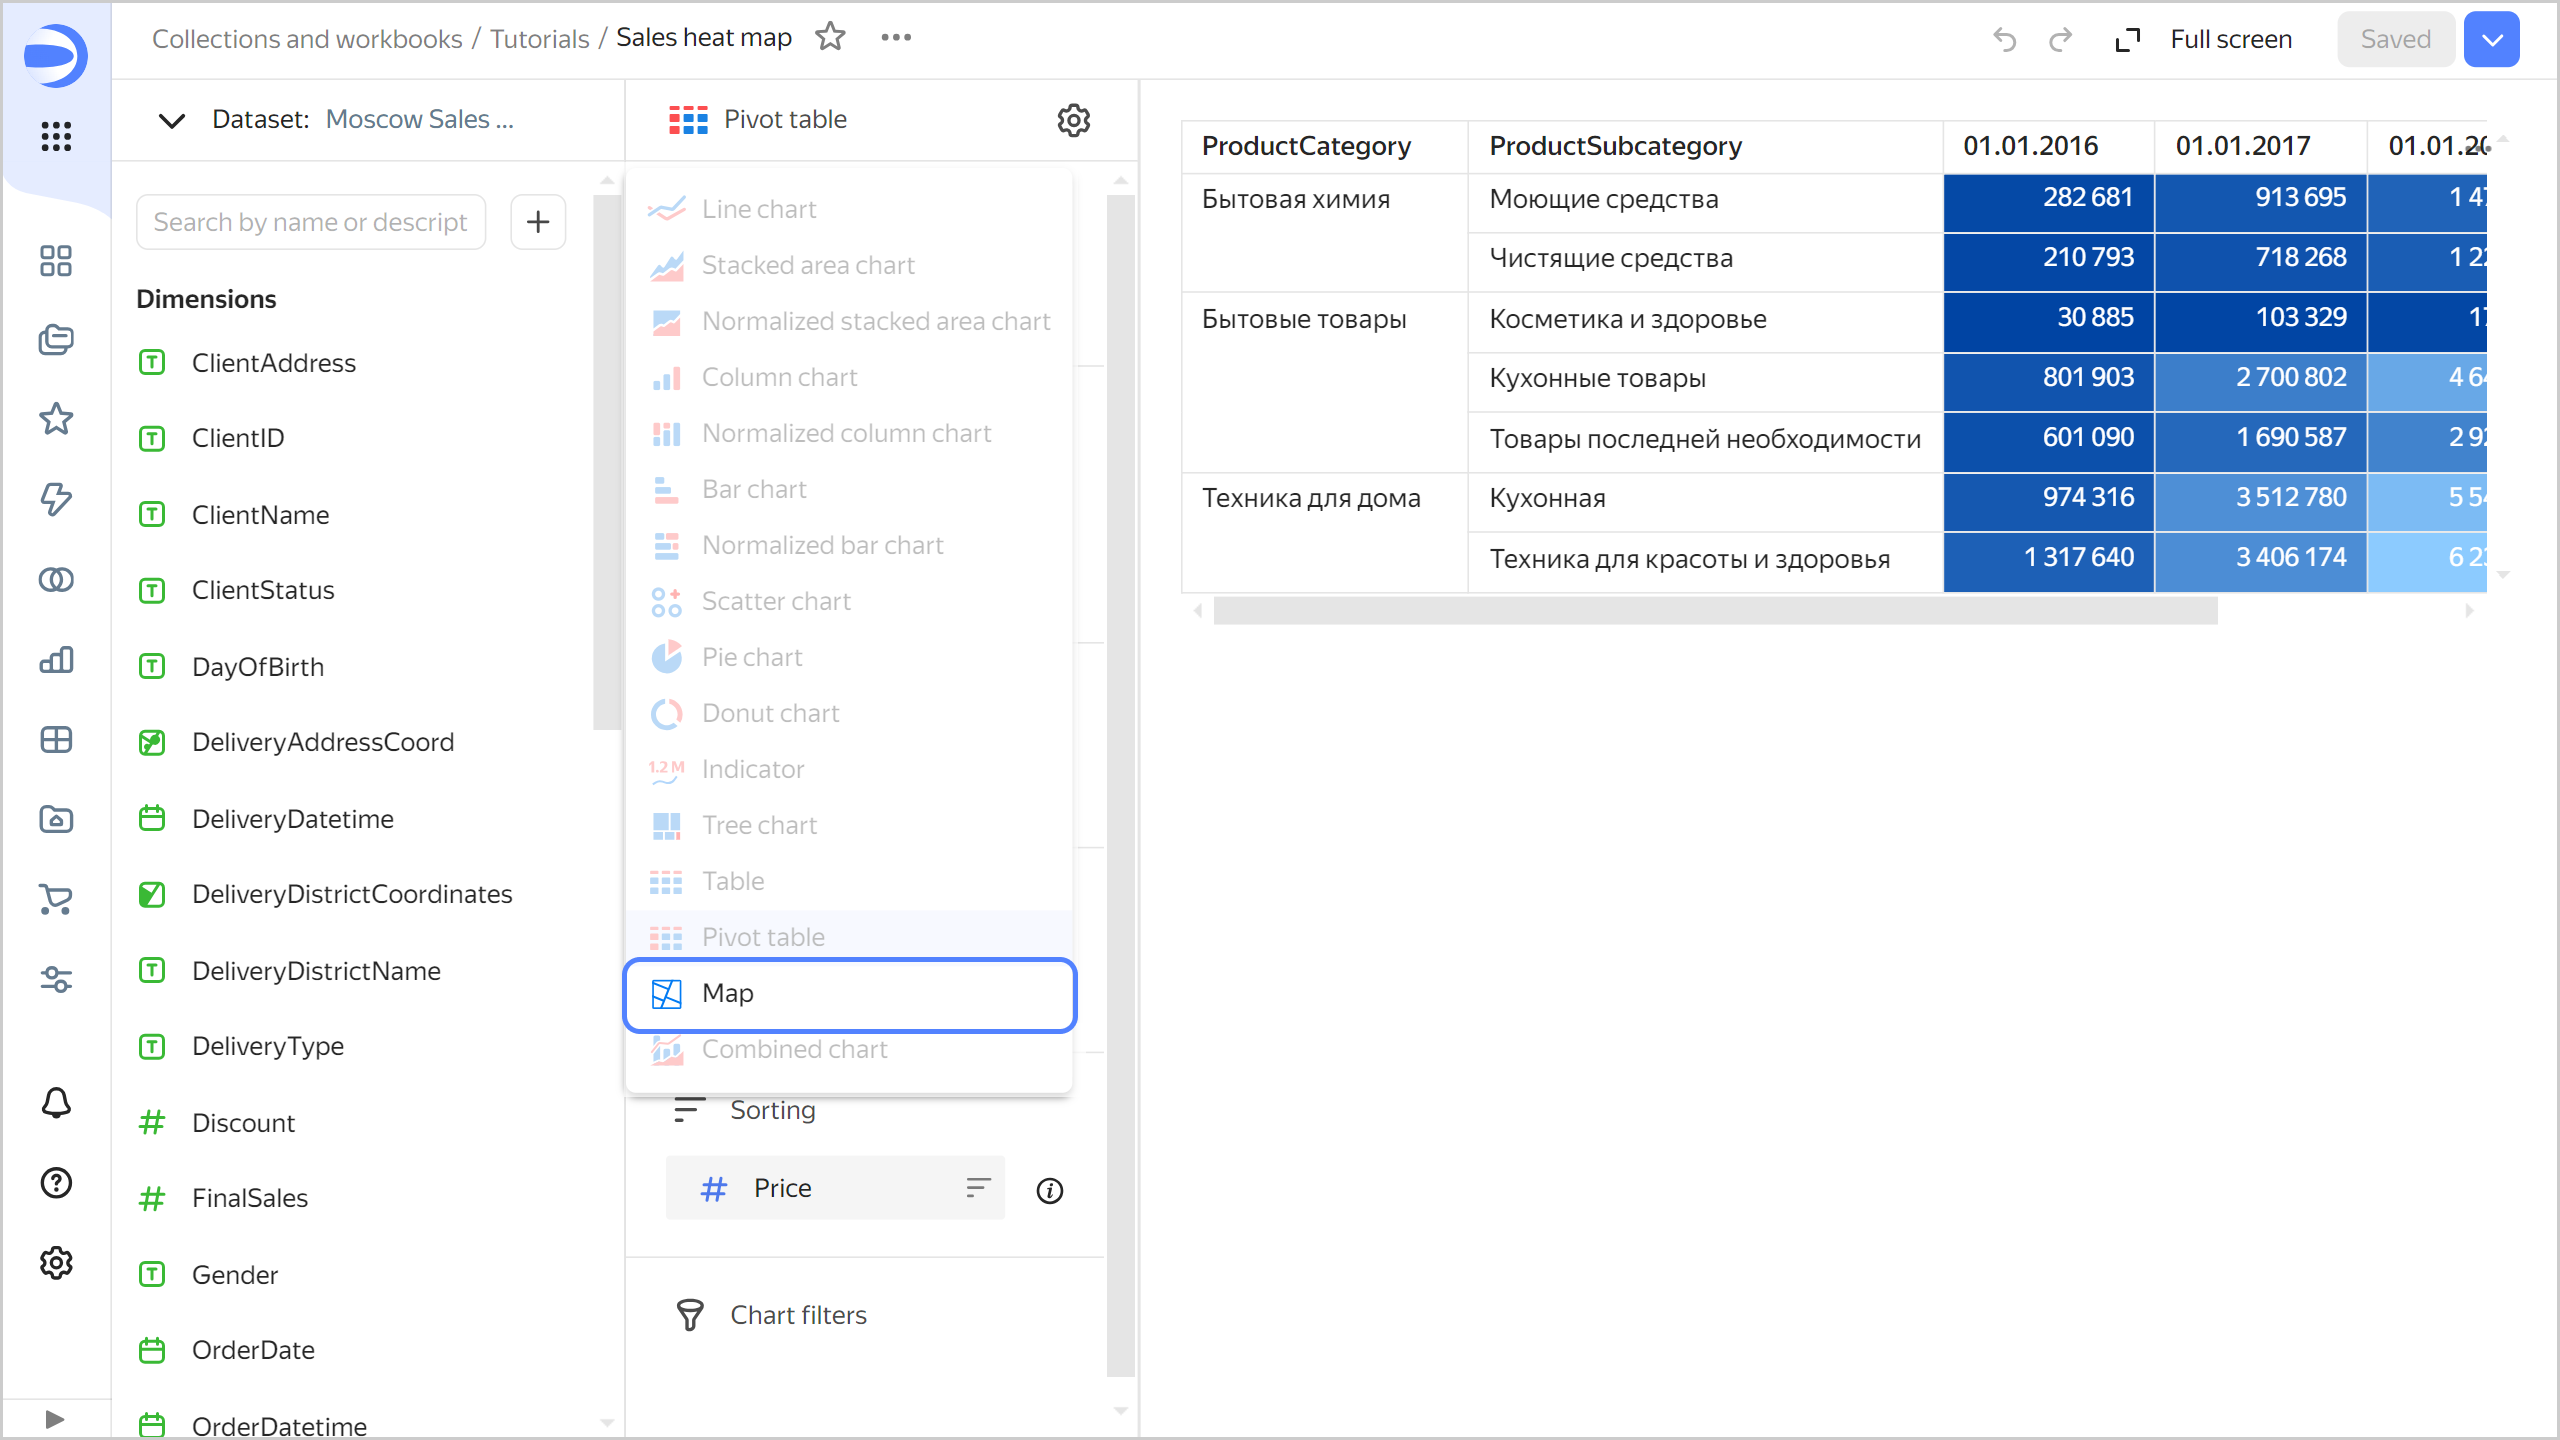
Create a heat map chart
To visualize the density of orders on the map of Moscow, create a heat map chart.
-
Copy the chart you created in the previous step:
- In the top-right corner, click → Save as copy.
- In the window that opens, enter
Sales heat mapfor the new chart name and click Save.
-
Select the Map visualization type.
-
Select the Heat map (Geopoints) layer type.
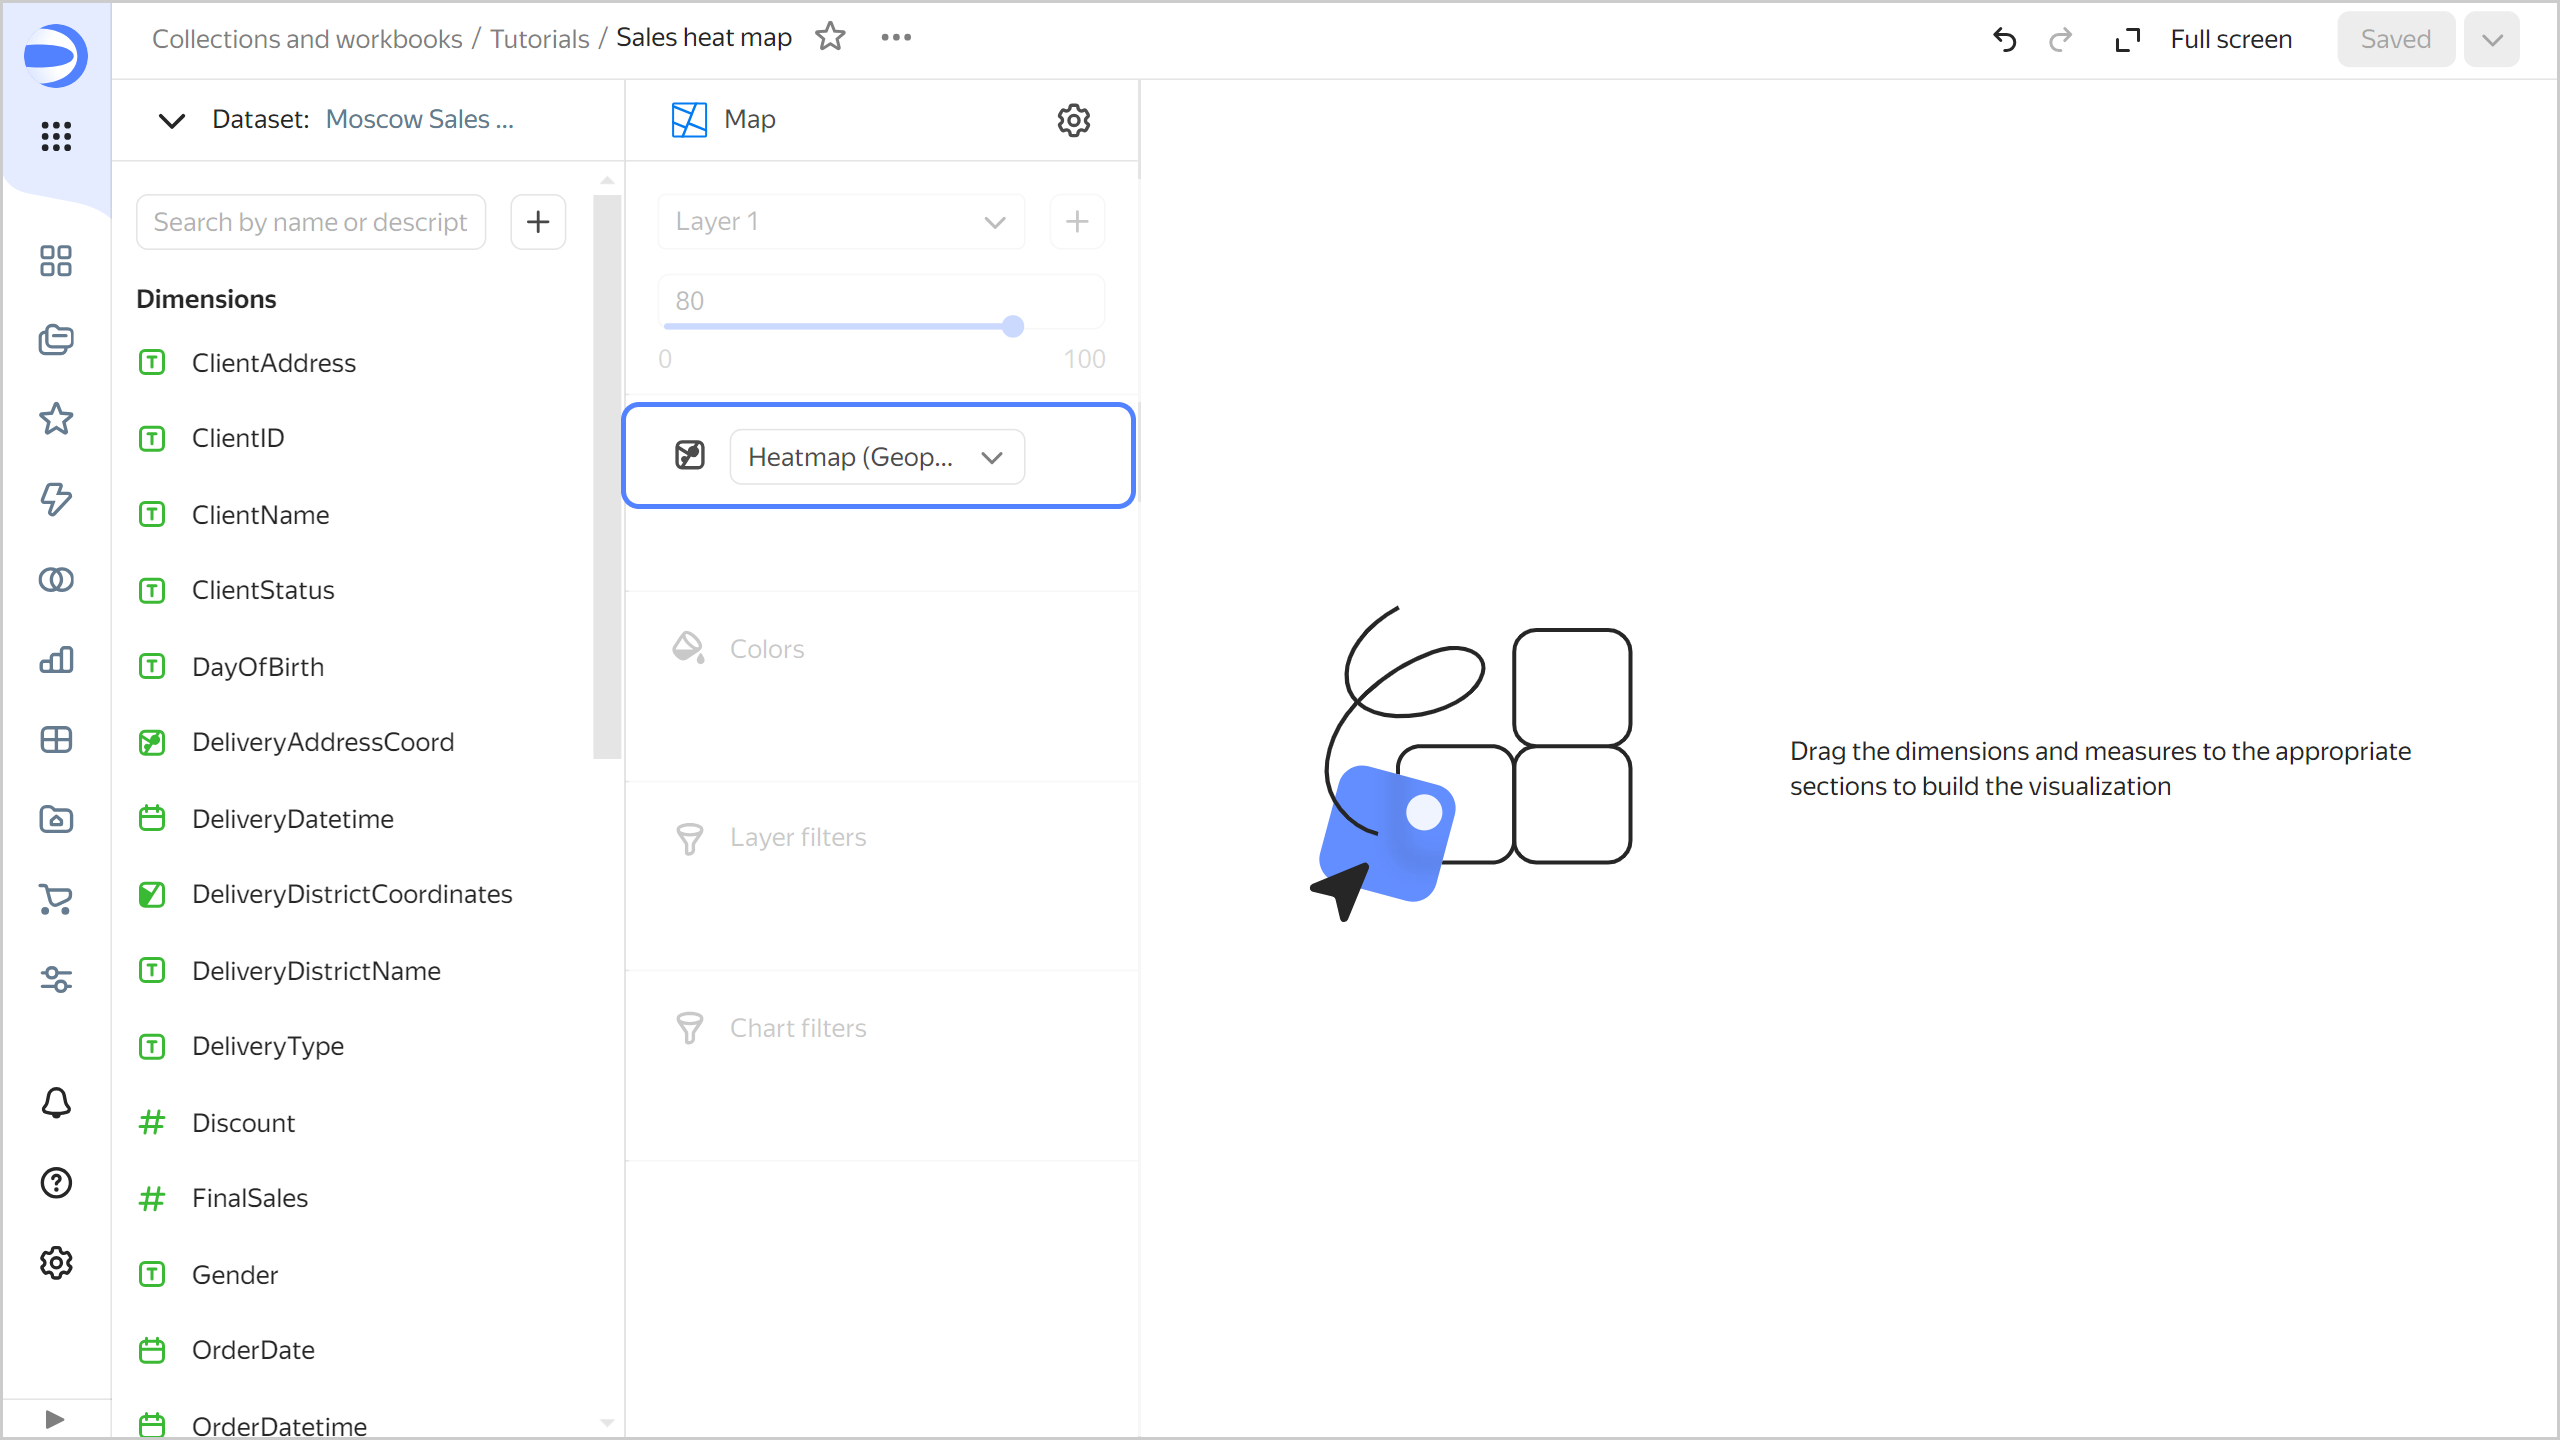
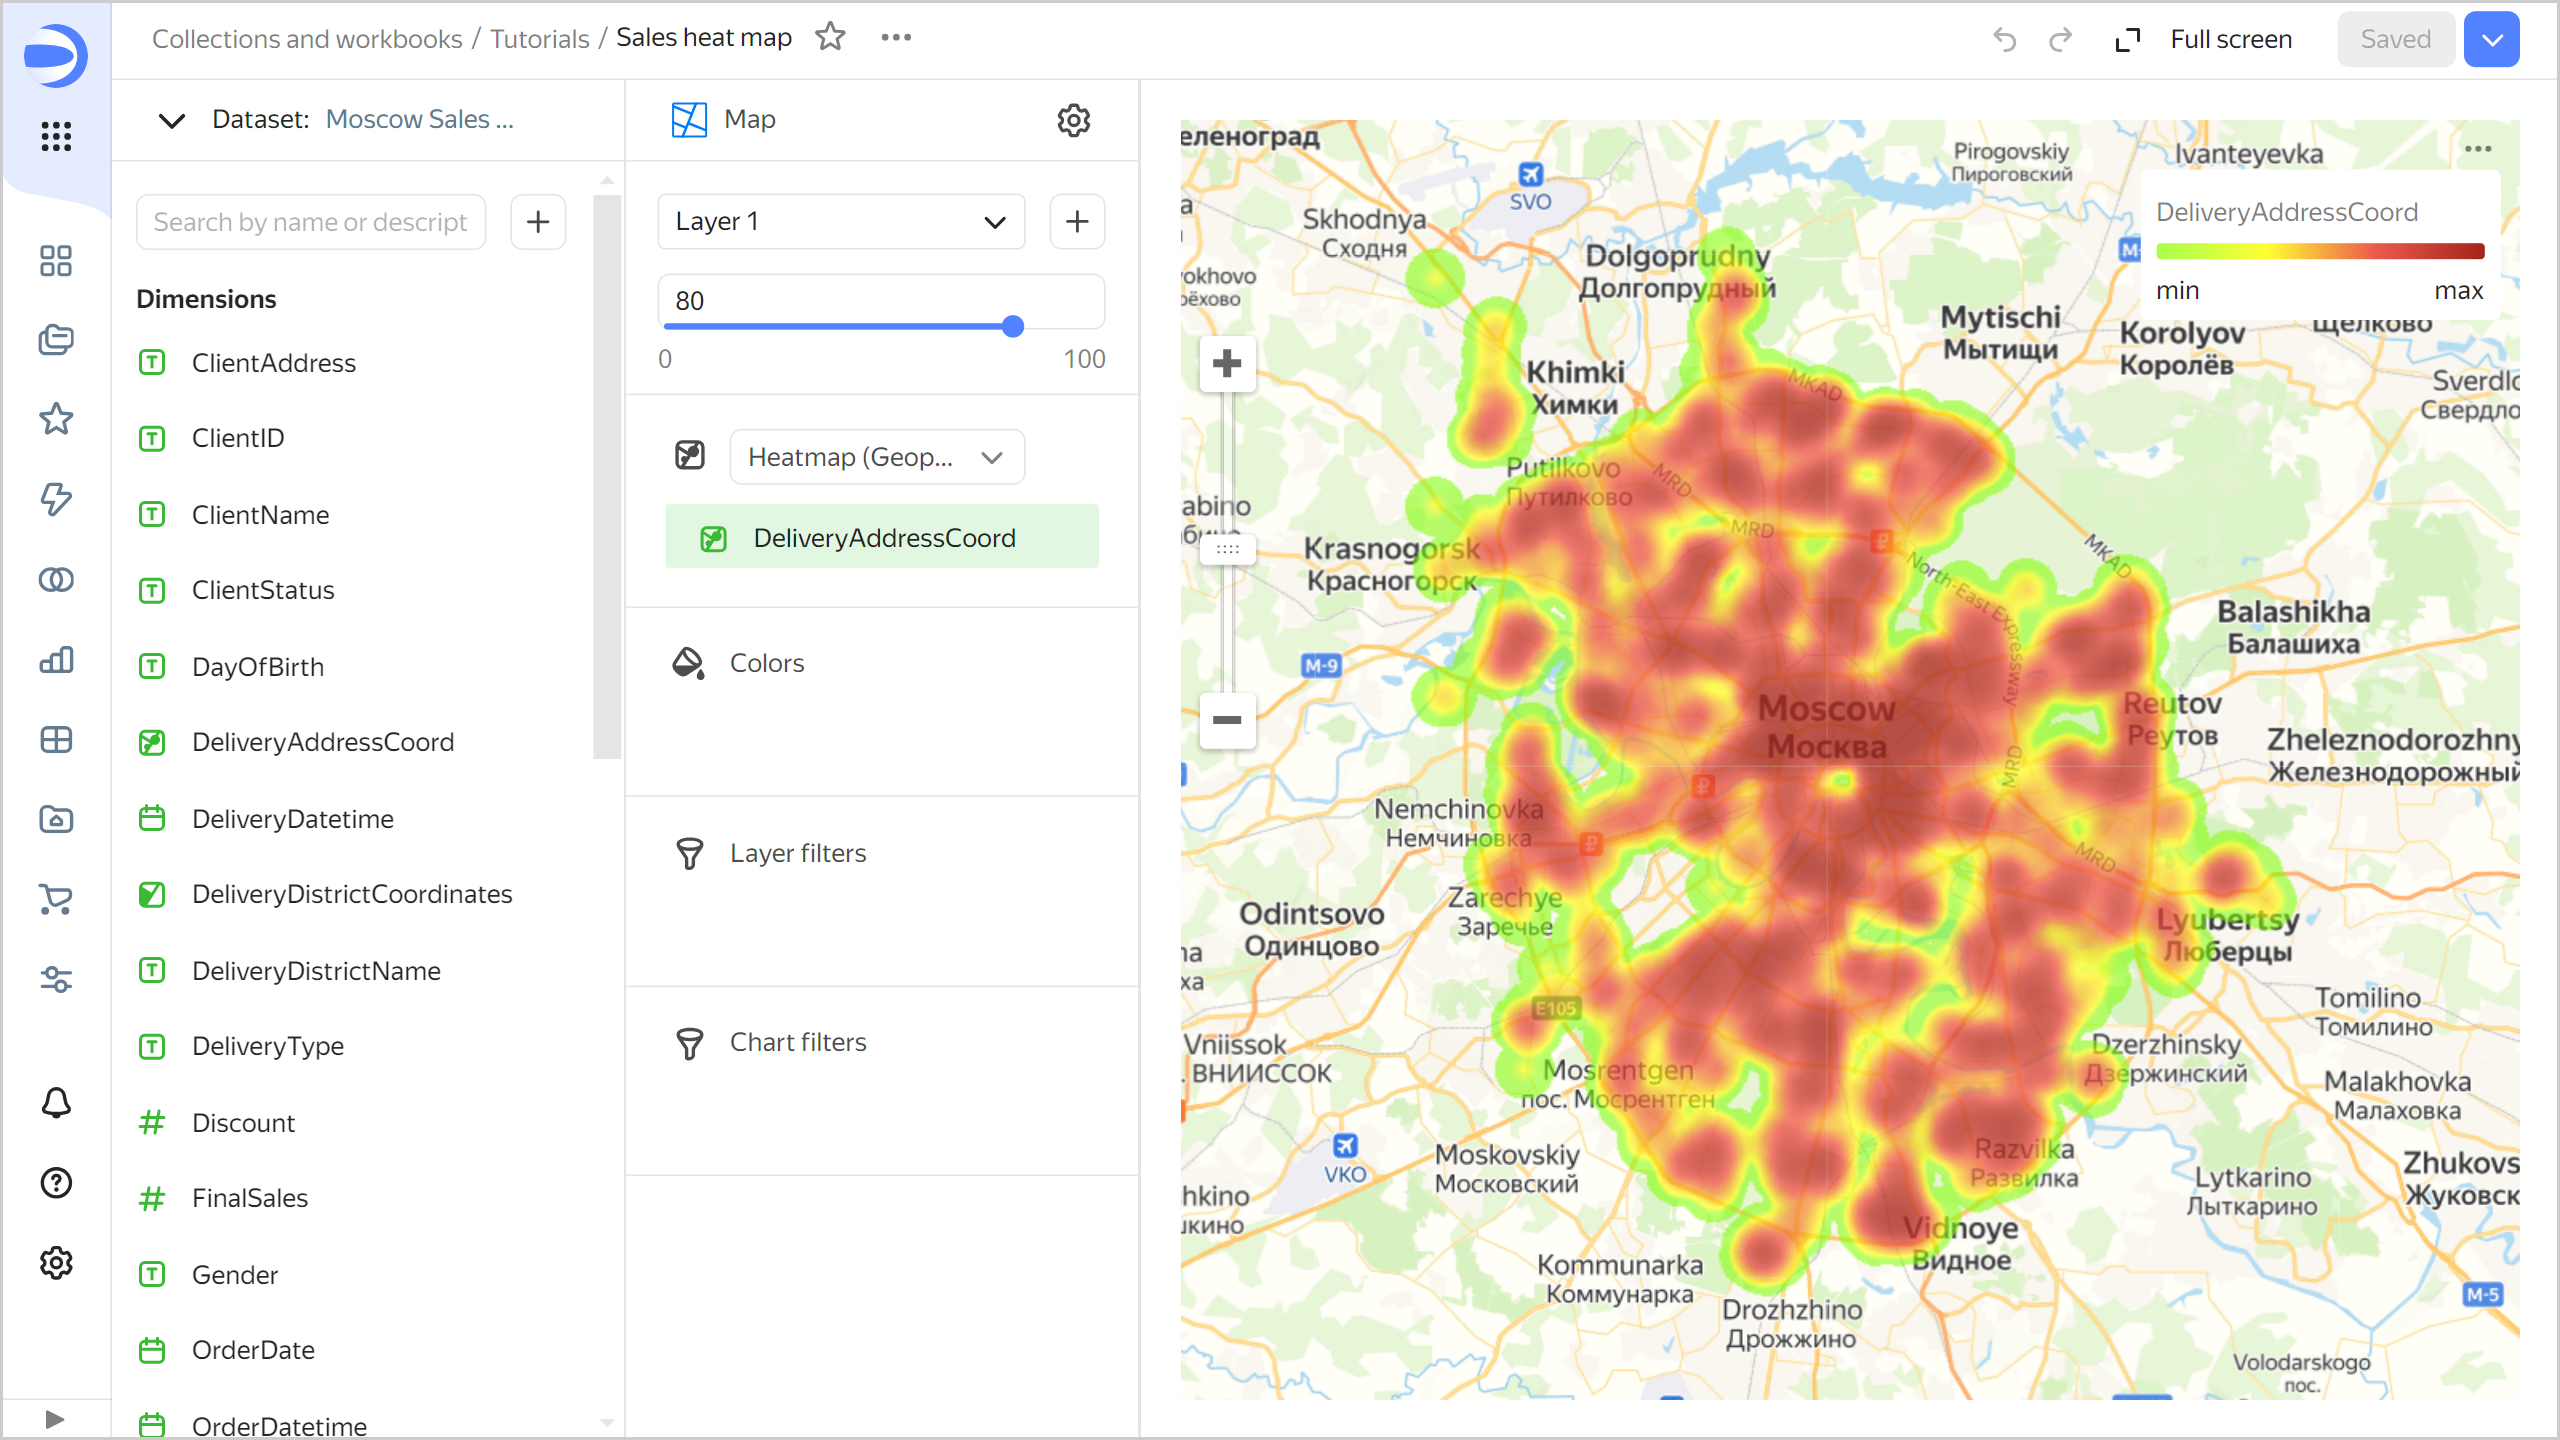
-
Add the delivery point coordinates to the map. To do this, drag the
DeliveryAddressCoordfield from Dimensions to the Heatmap (Geopoints) section. -
In the top-right corner, click Save.
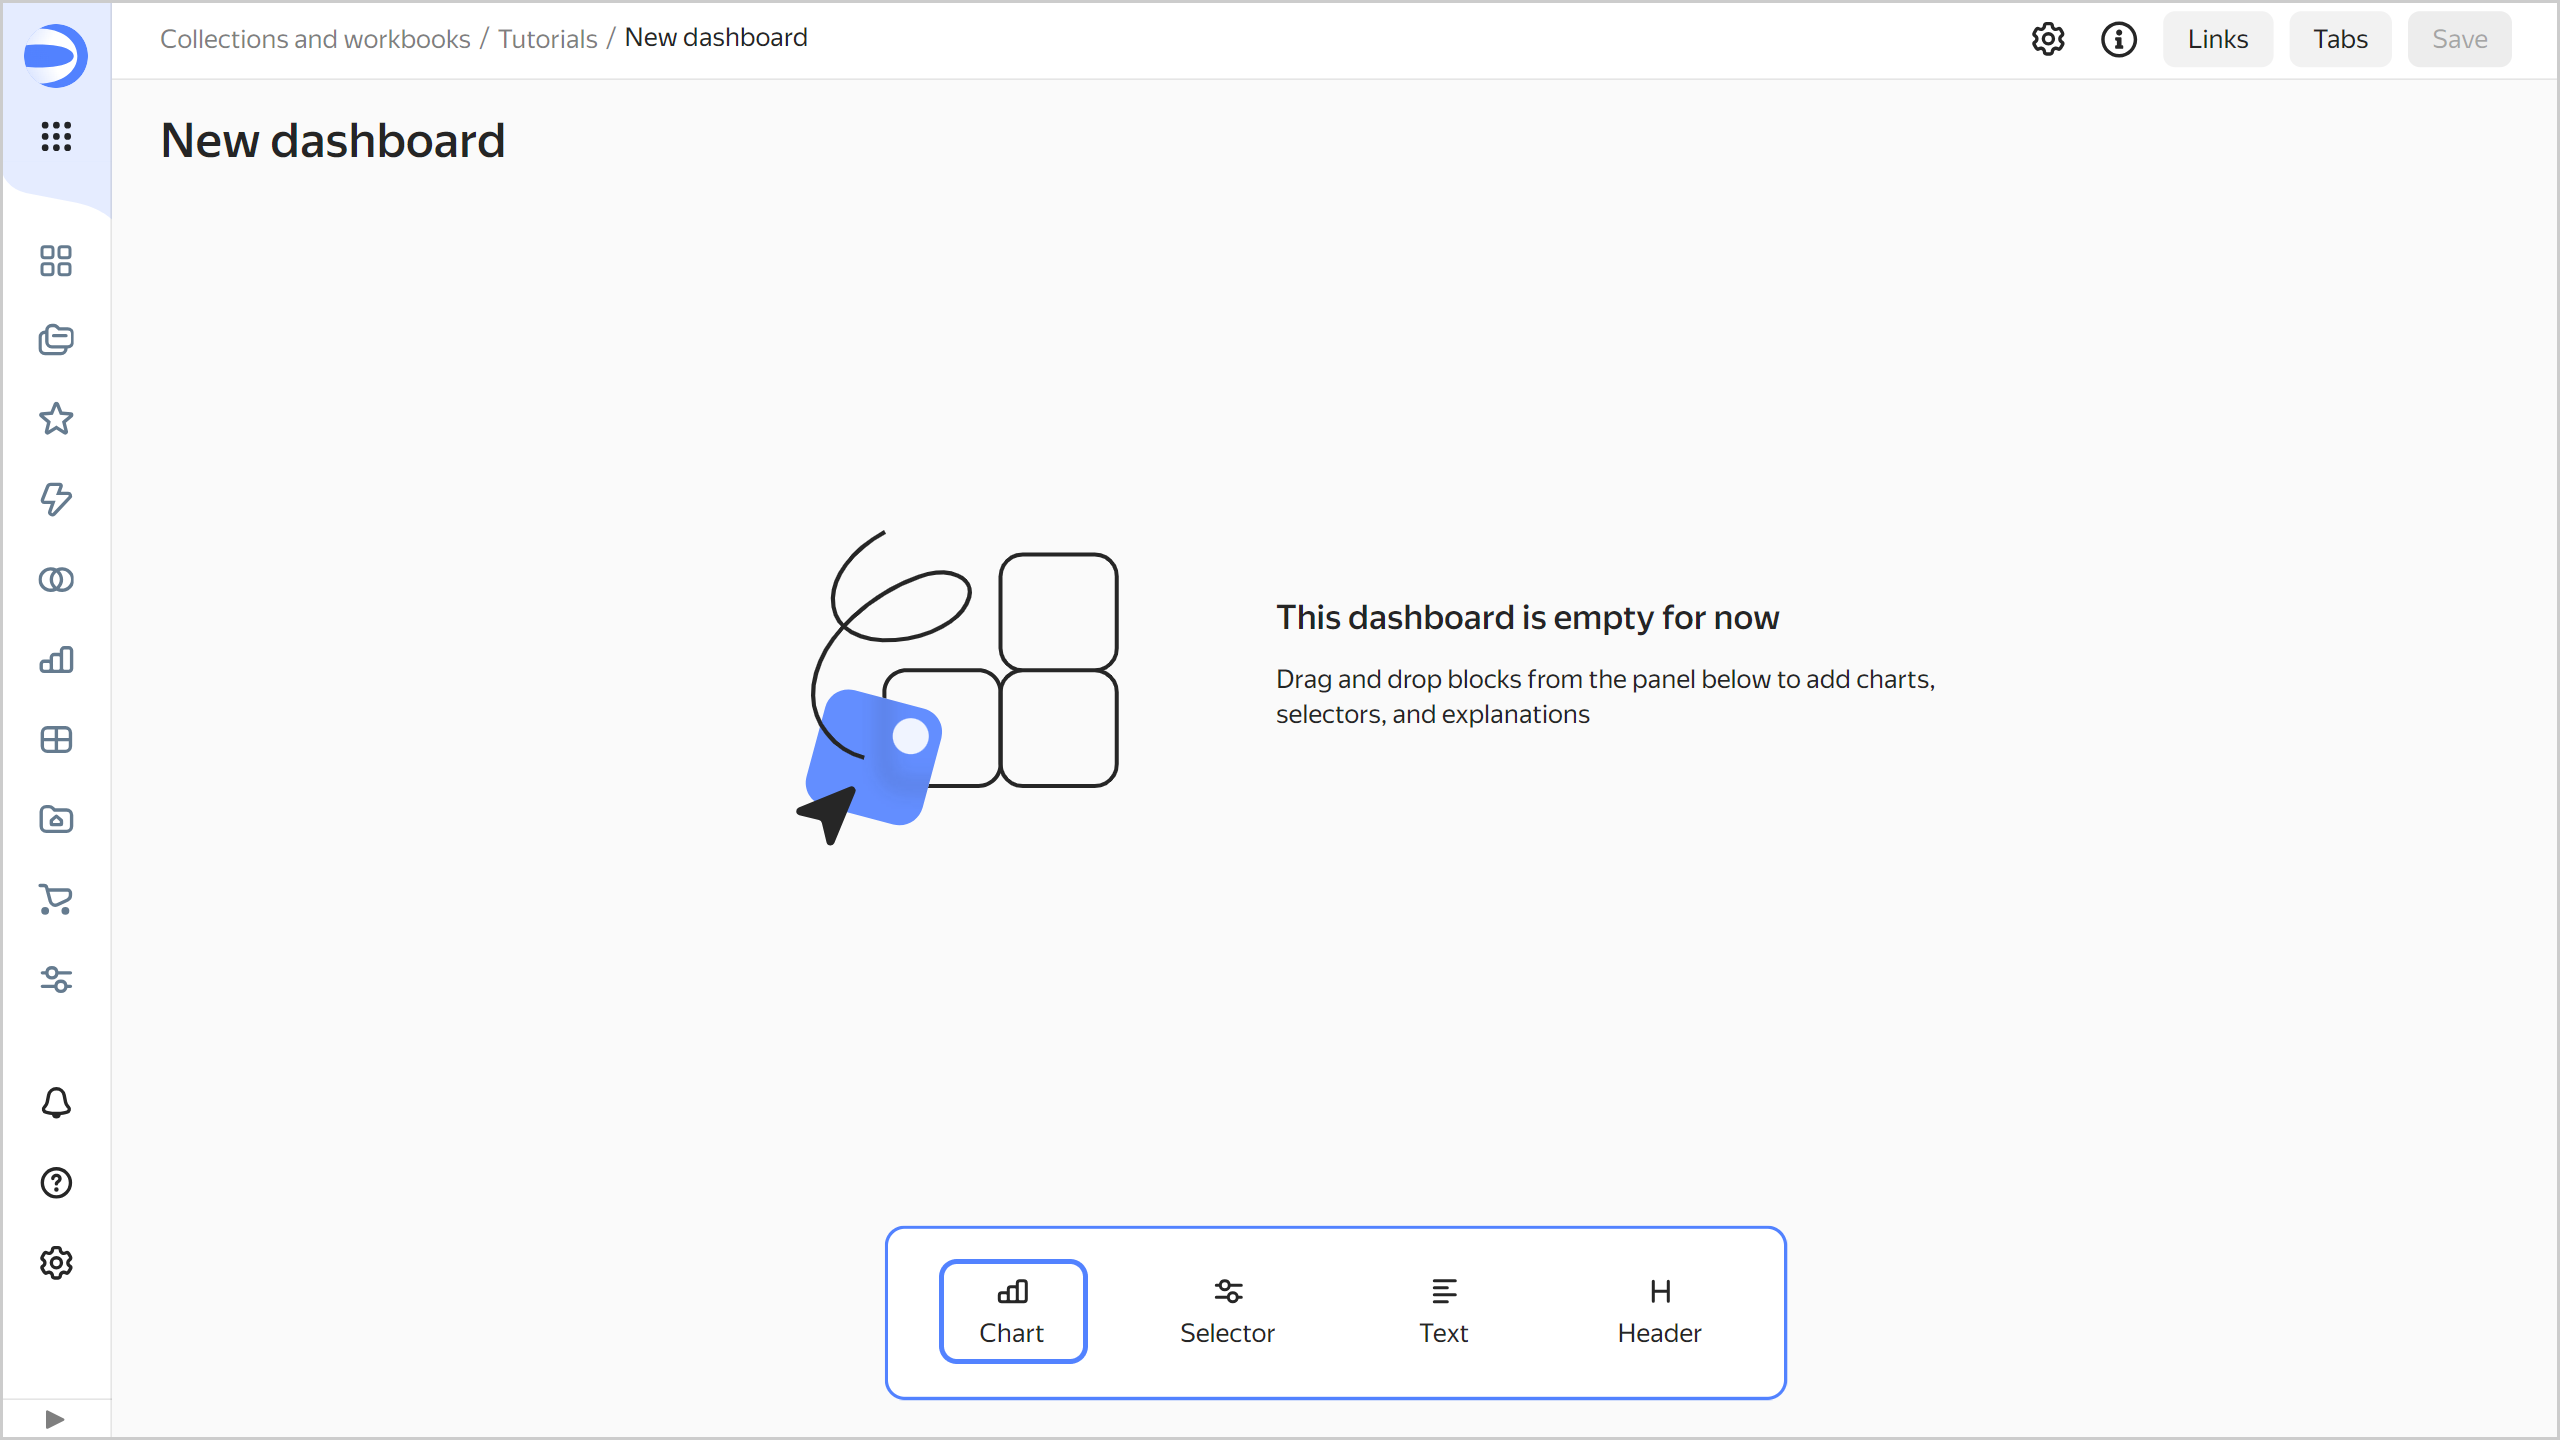
Create a dashboard and add charts to it
Create a dashboard to add charts and other widgets to:
-
In the left-hand panel, select Collections and workbooks and go to the
Tutorialsworkbook. -
In the top-right corner, click Create → Dashboard.
-
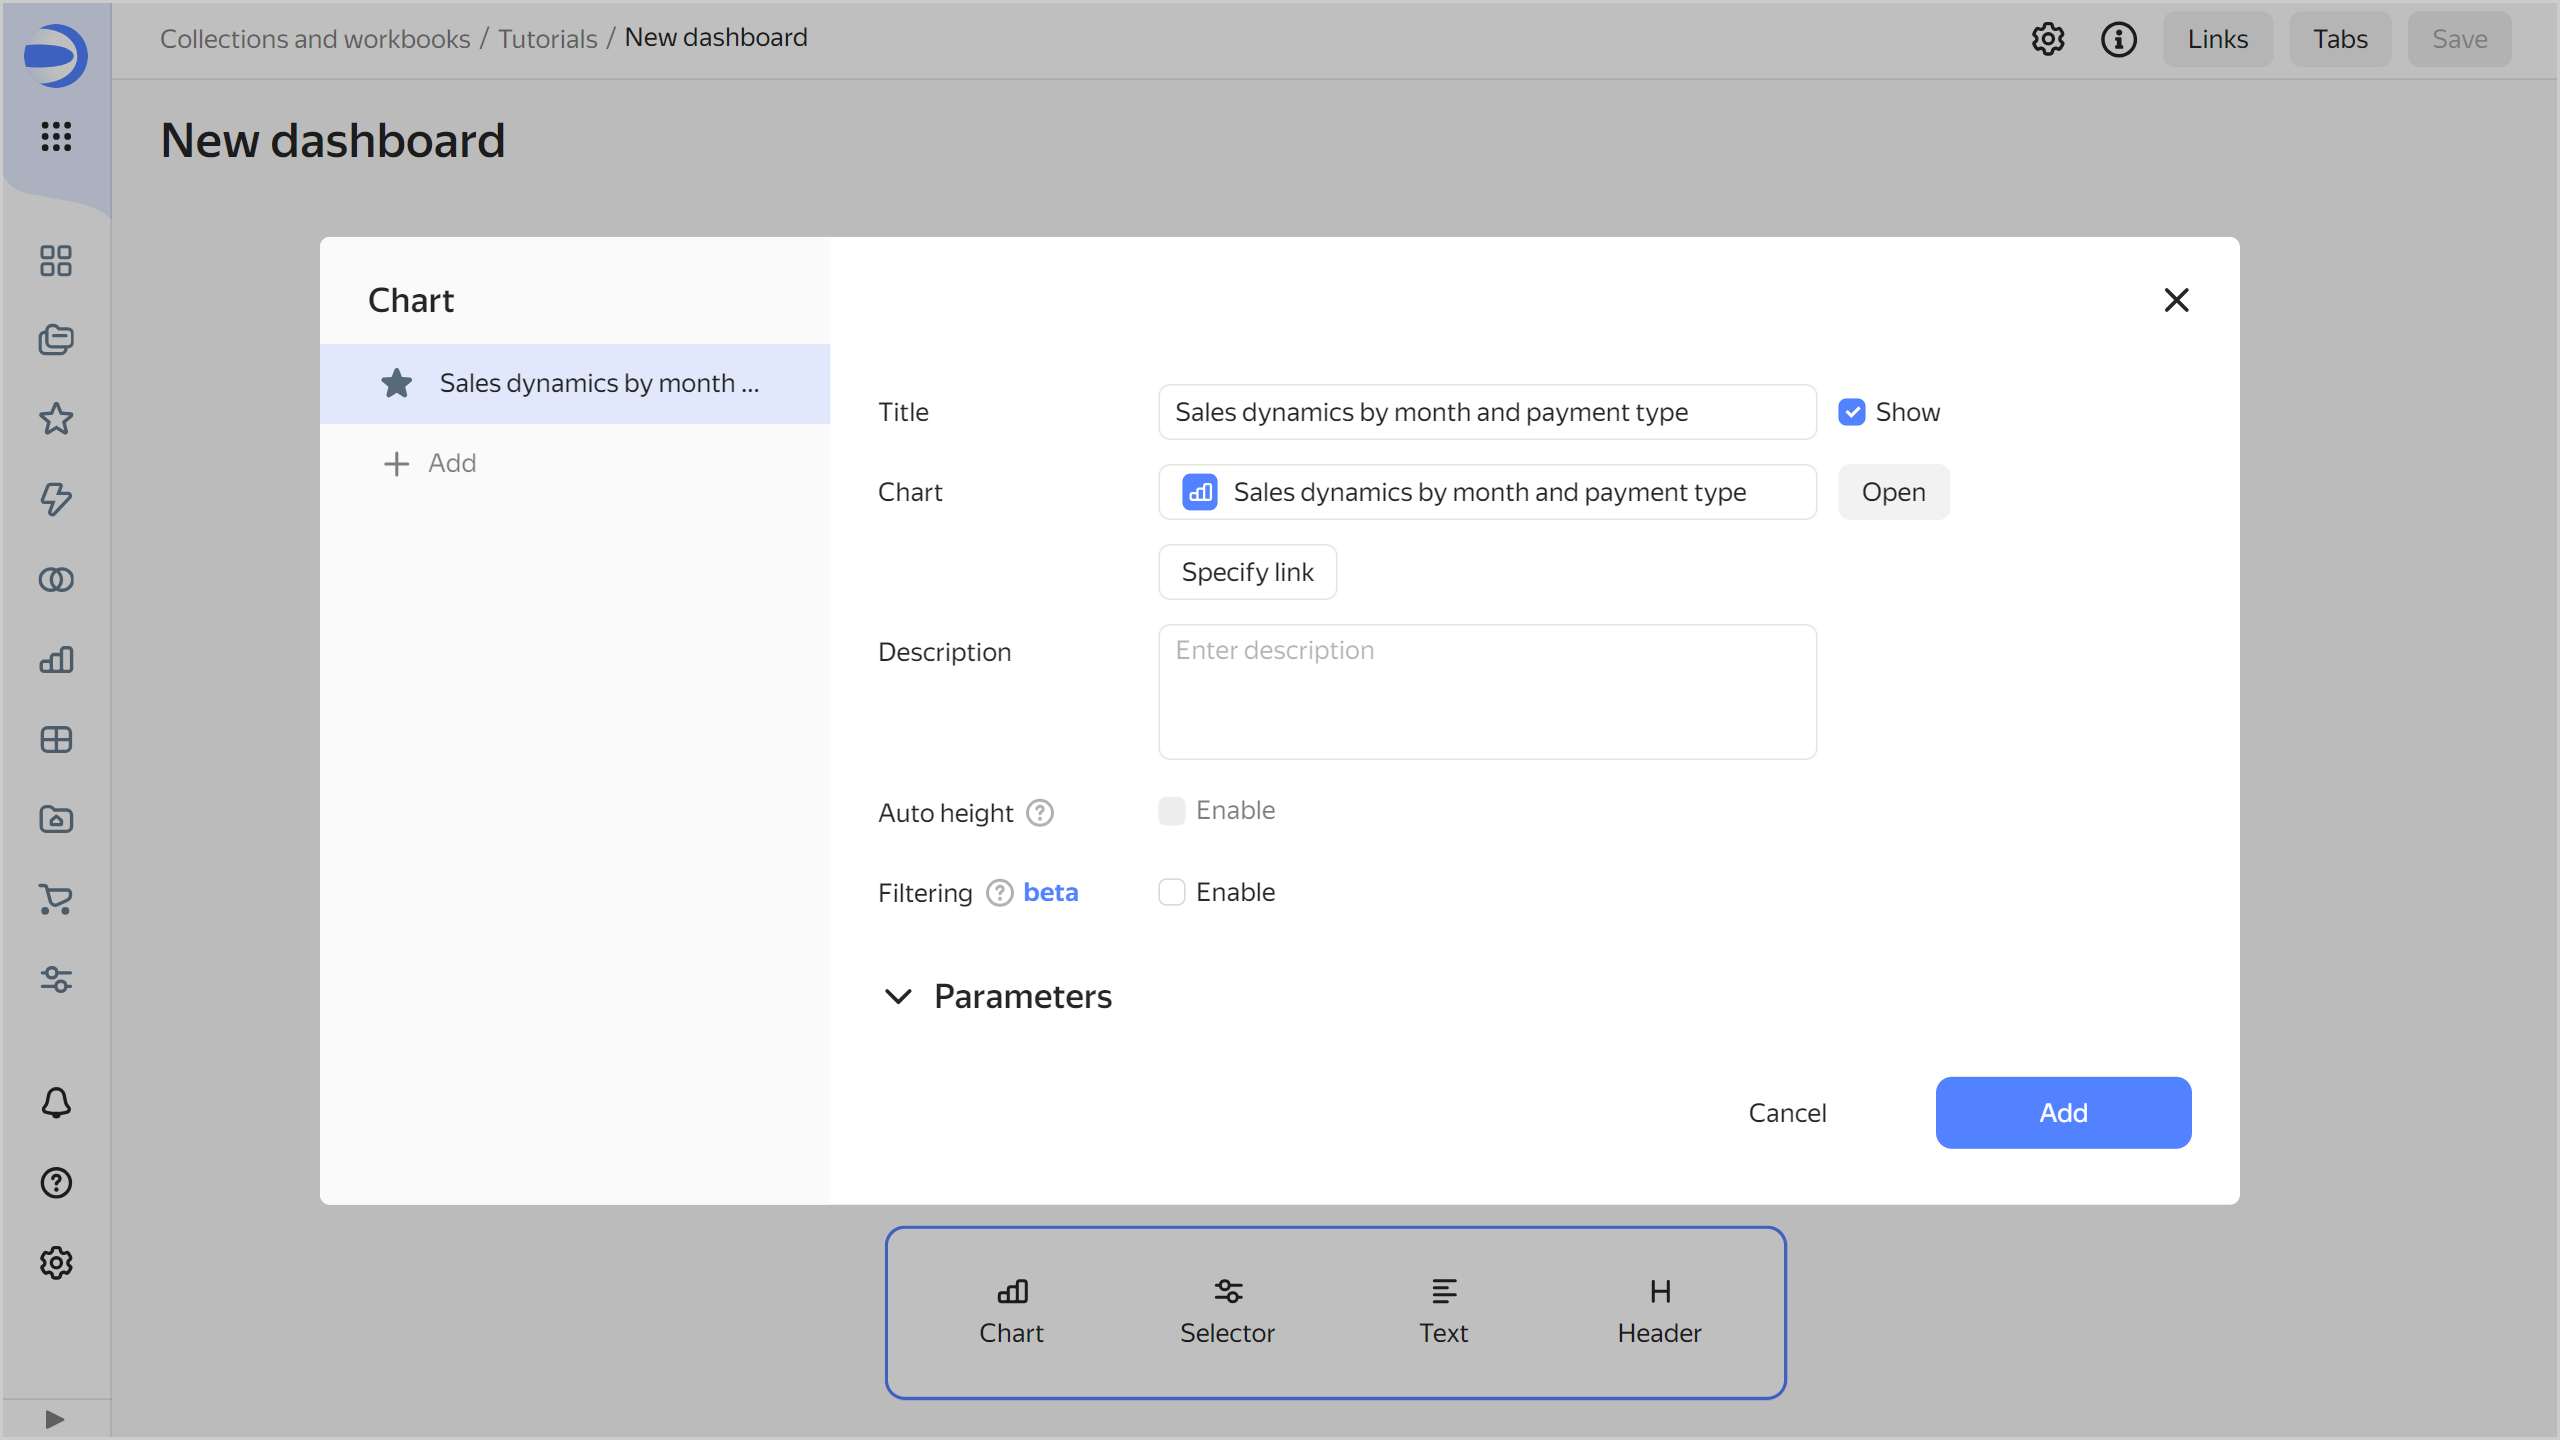
In the panel at the bottom of the page, drag Chart where you need.
-
In the window that opens, click Select.
-
Select the
Sales dynamics by month and payment typechart. -
Click Add.
-
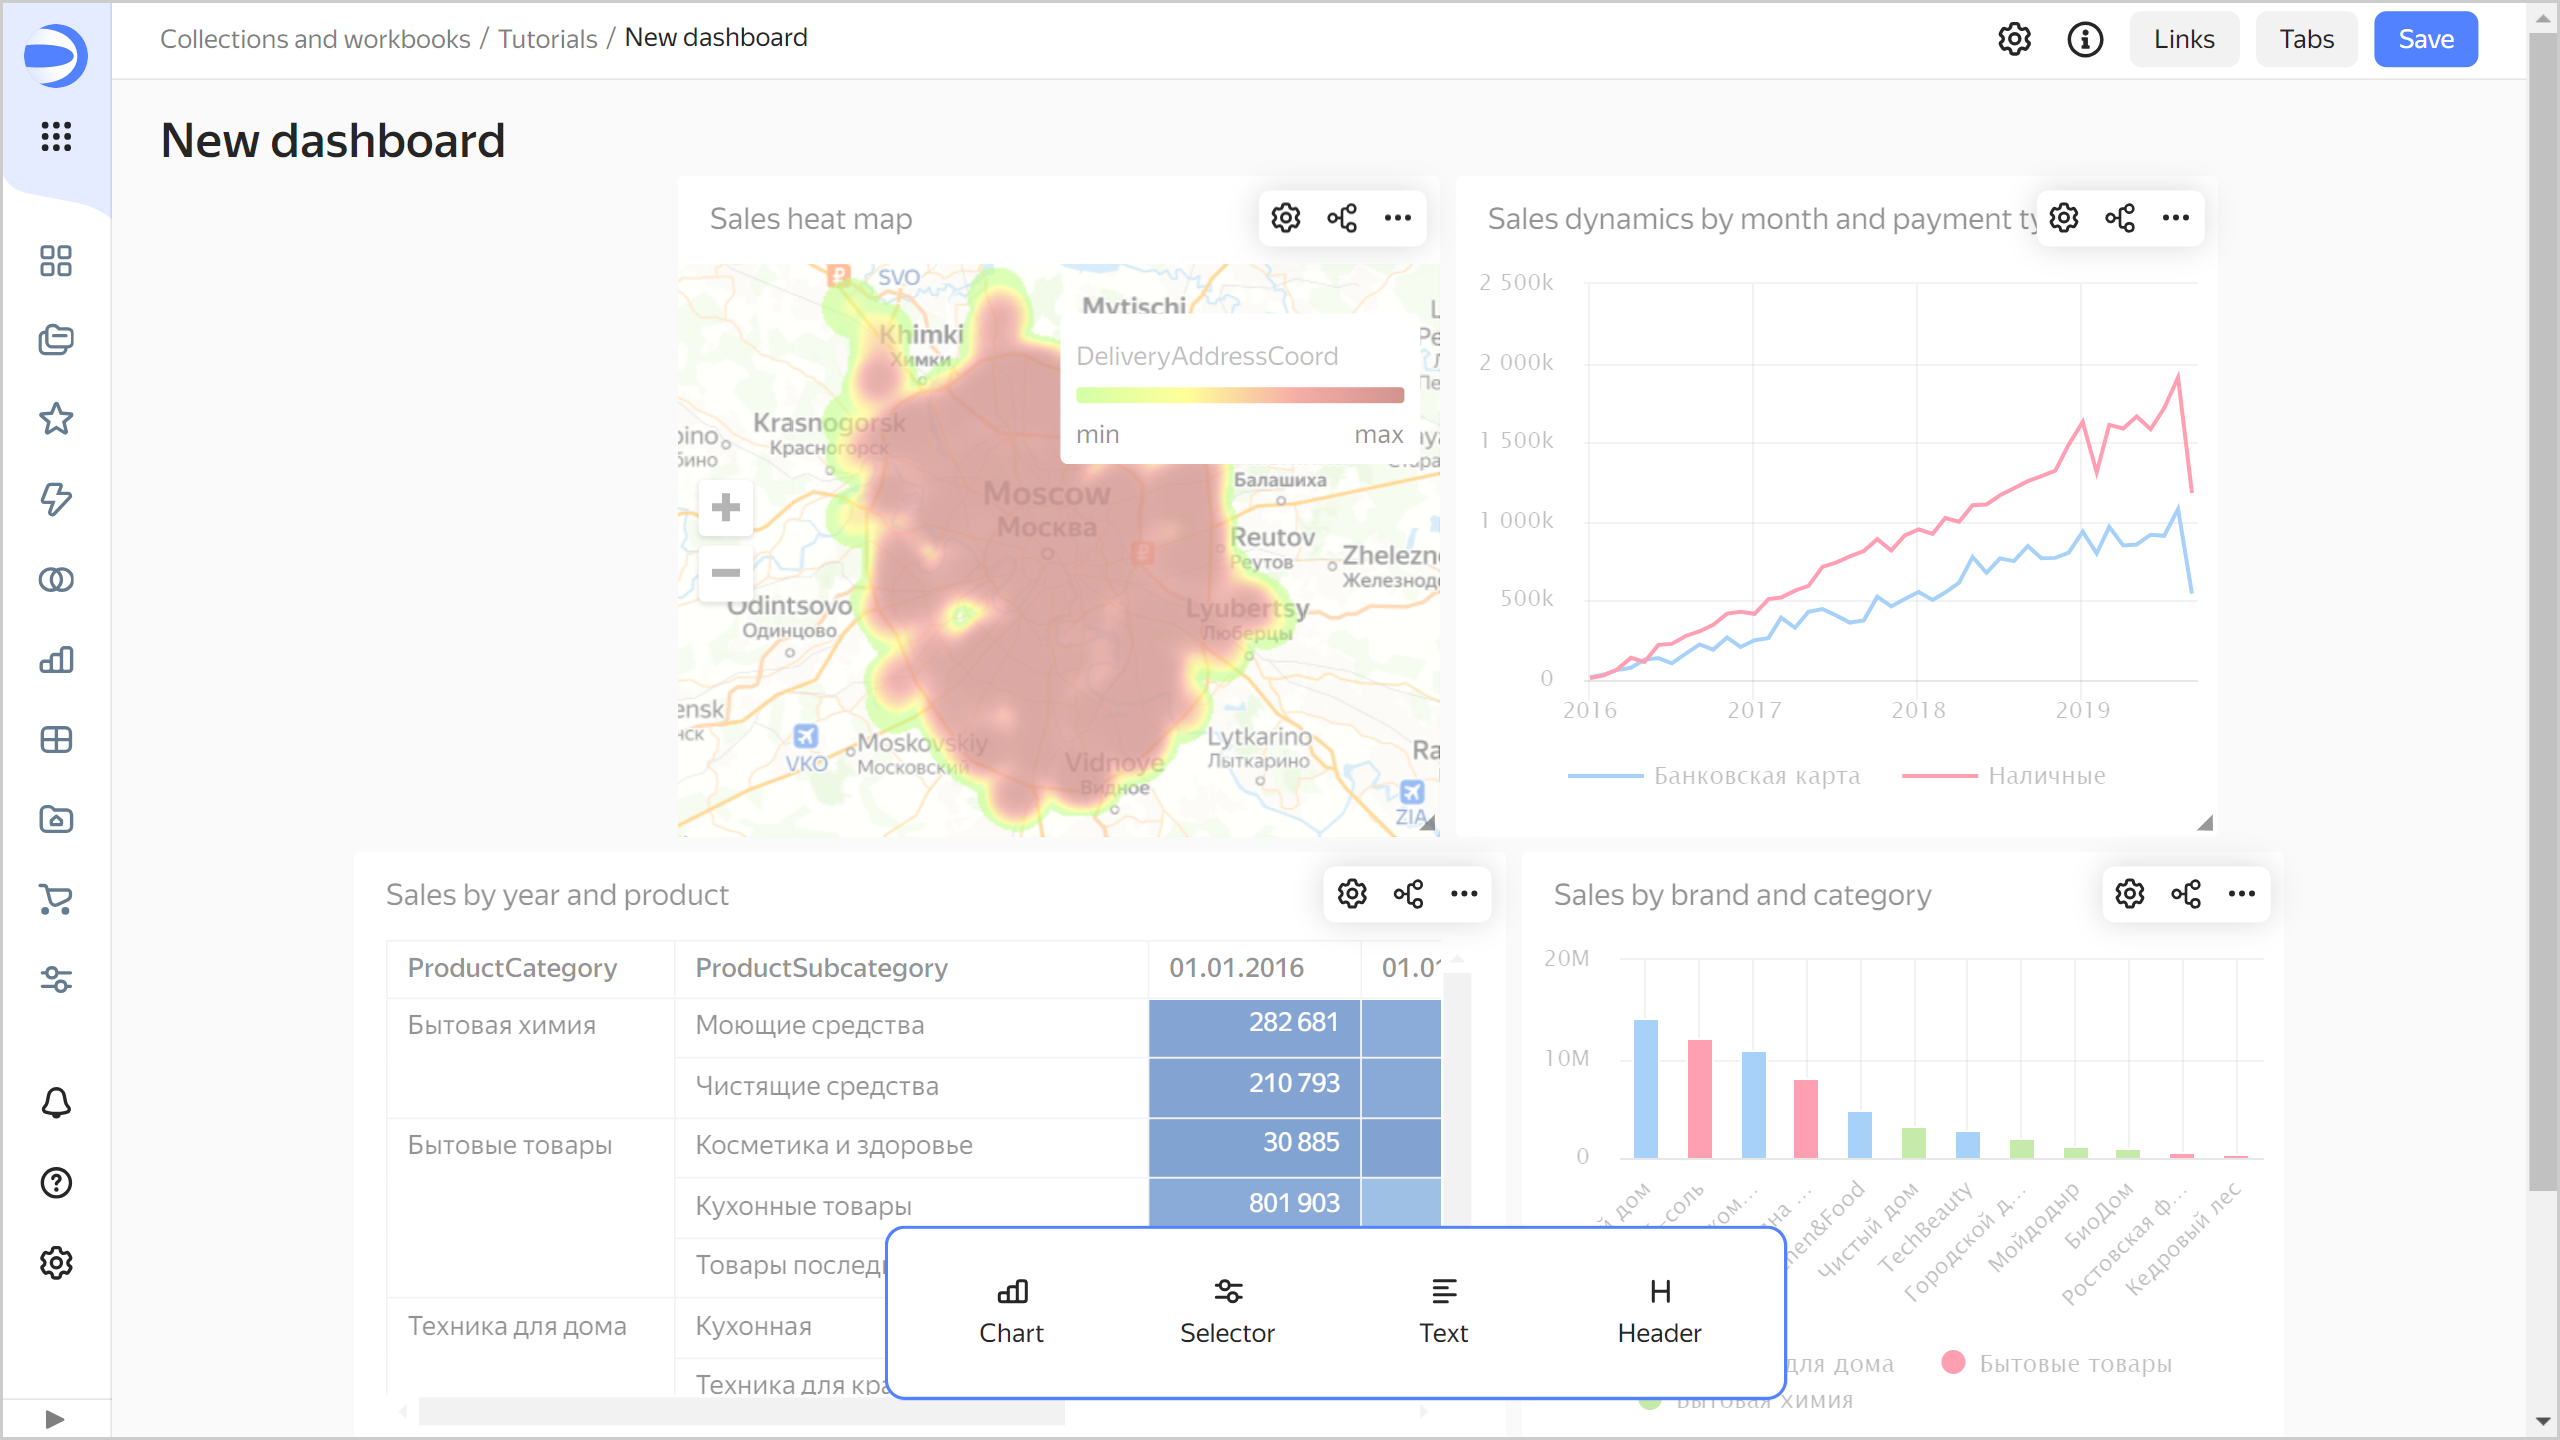
Repeat steps 3-6 to add these charts:
Sales by brand and categorySales by year and productSales heat map
-
Adjust the size of the charts with your mouse and place them on the dashboard as you prefer.
Add selectors to the dashboard
Add selectors to filter your charts by date, Moscow district, product, and customer status:
-
In the panel at the bottom of the page, drag Selector where you need.

-
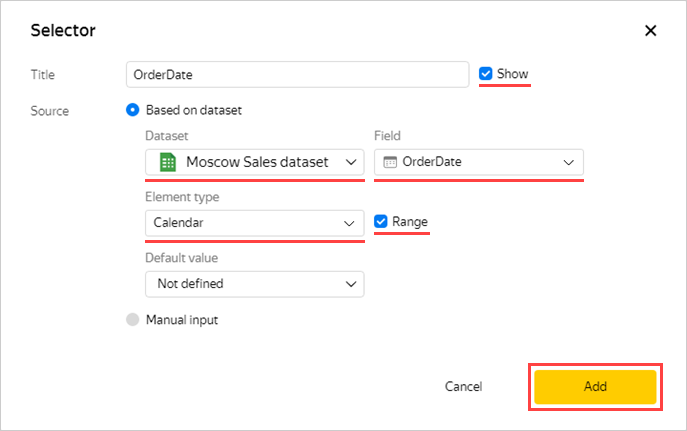
Add the calendar selector for the order date:
- Select
Moscow Sales dataset. - Select the
OrderDatefield. - Enable Range.
- Click Save.
- Select
-
Add a product category selector:
- Make sure you selected
Moscow Sales dataset. - Select the
ProductCategoryfield. - Enable Multiple choice.
- Click Save.
- Make sure you selected
-
Similarly, add selectors for the following fields:
ProductBrandDeliveryDistrictNameDeliveryTypePaymentType
-
Position the selectors on the dashboard however you prefer.
-
Save the dashboard:
- In the top-right corner of the dashboard, click Save.
- Enter
Moscow Shops dashboardfor the dashboard name and click Create.
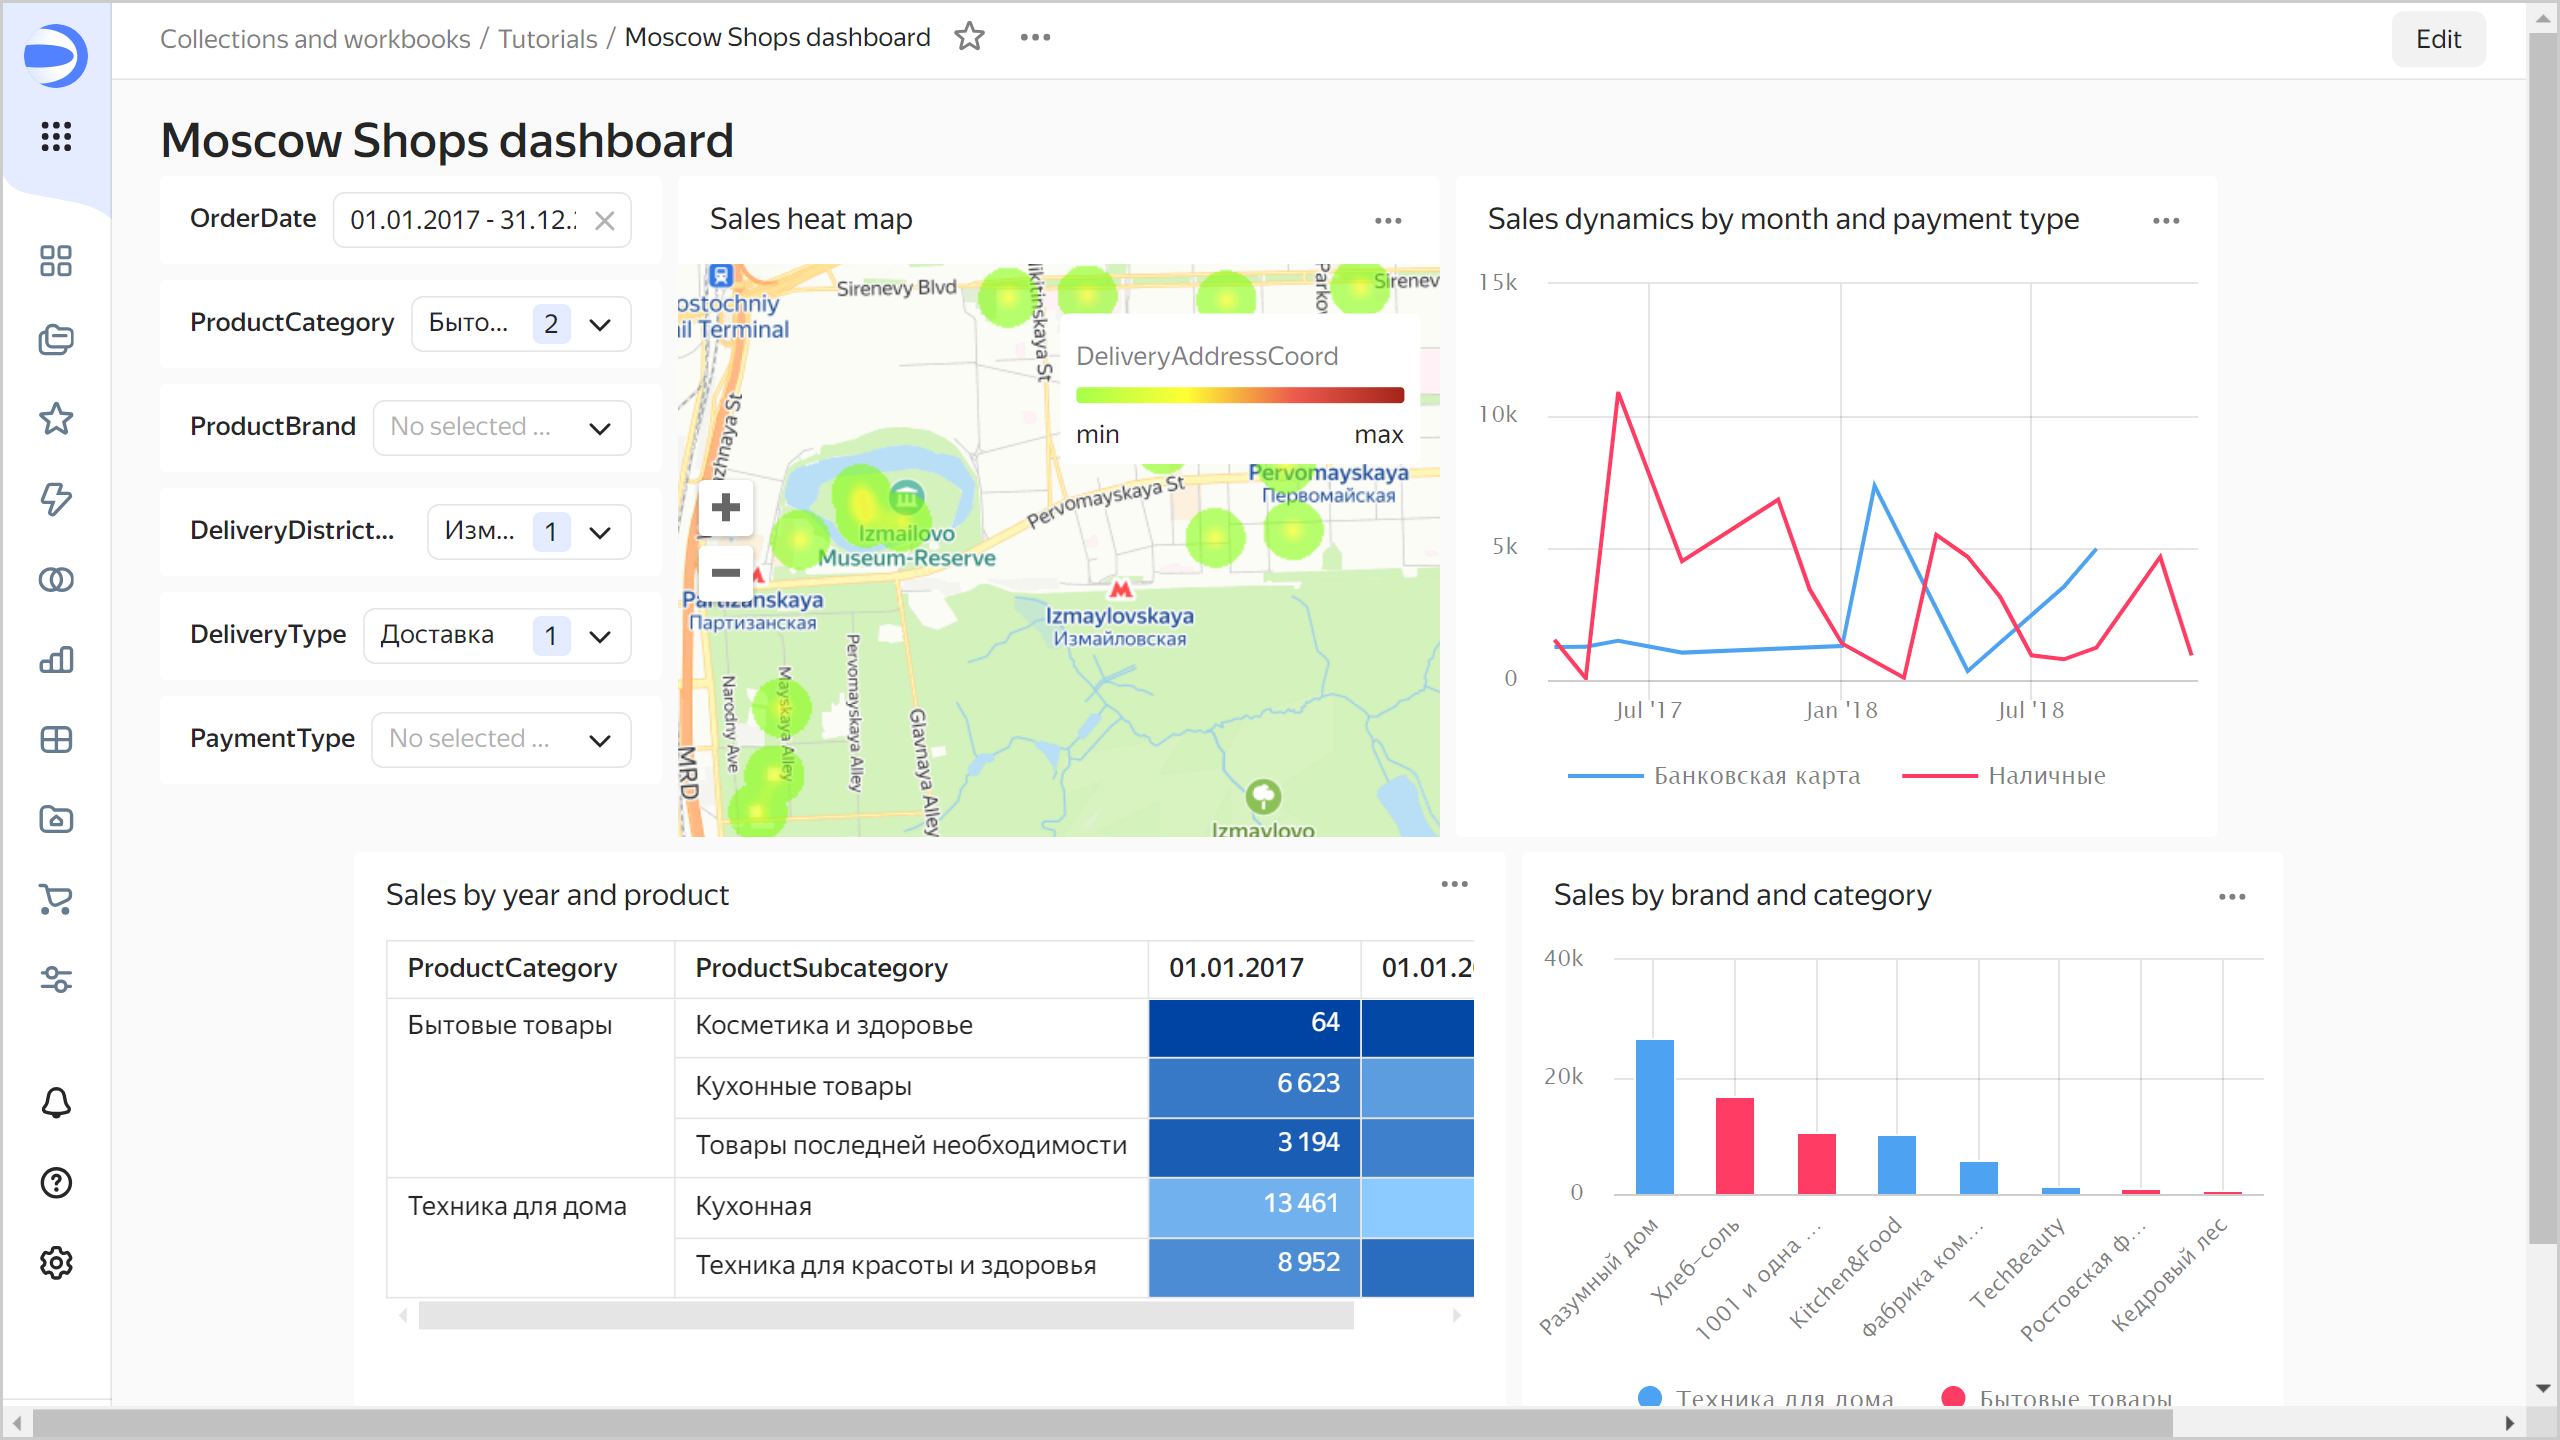
Your dashboard is ready for use.
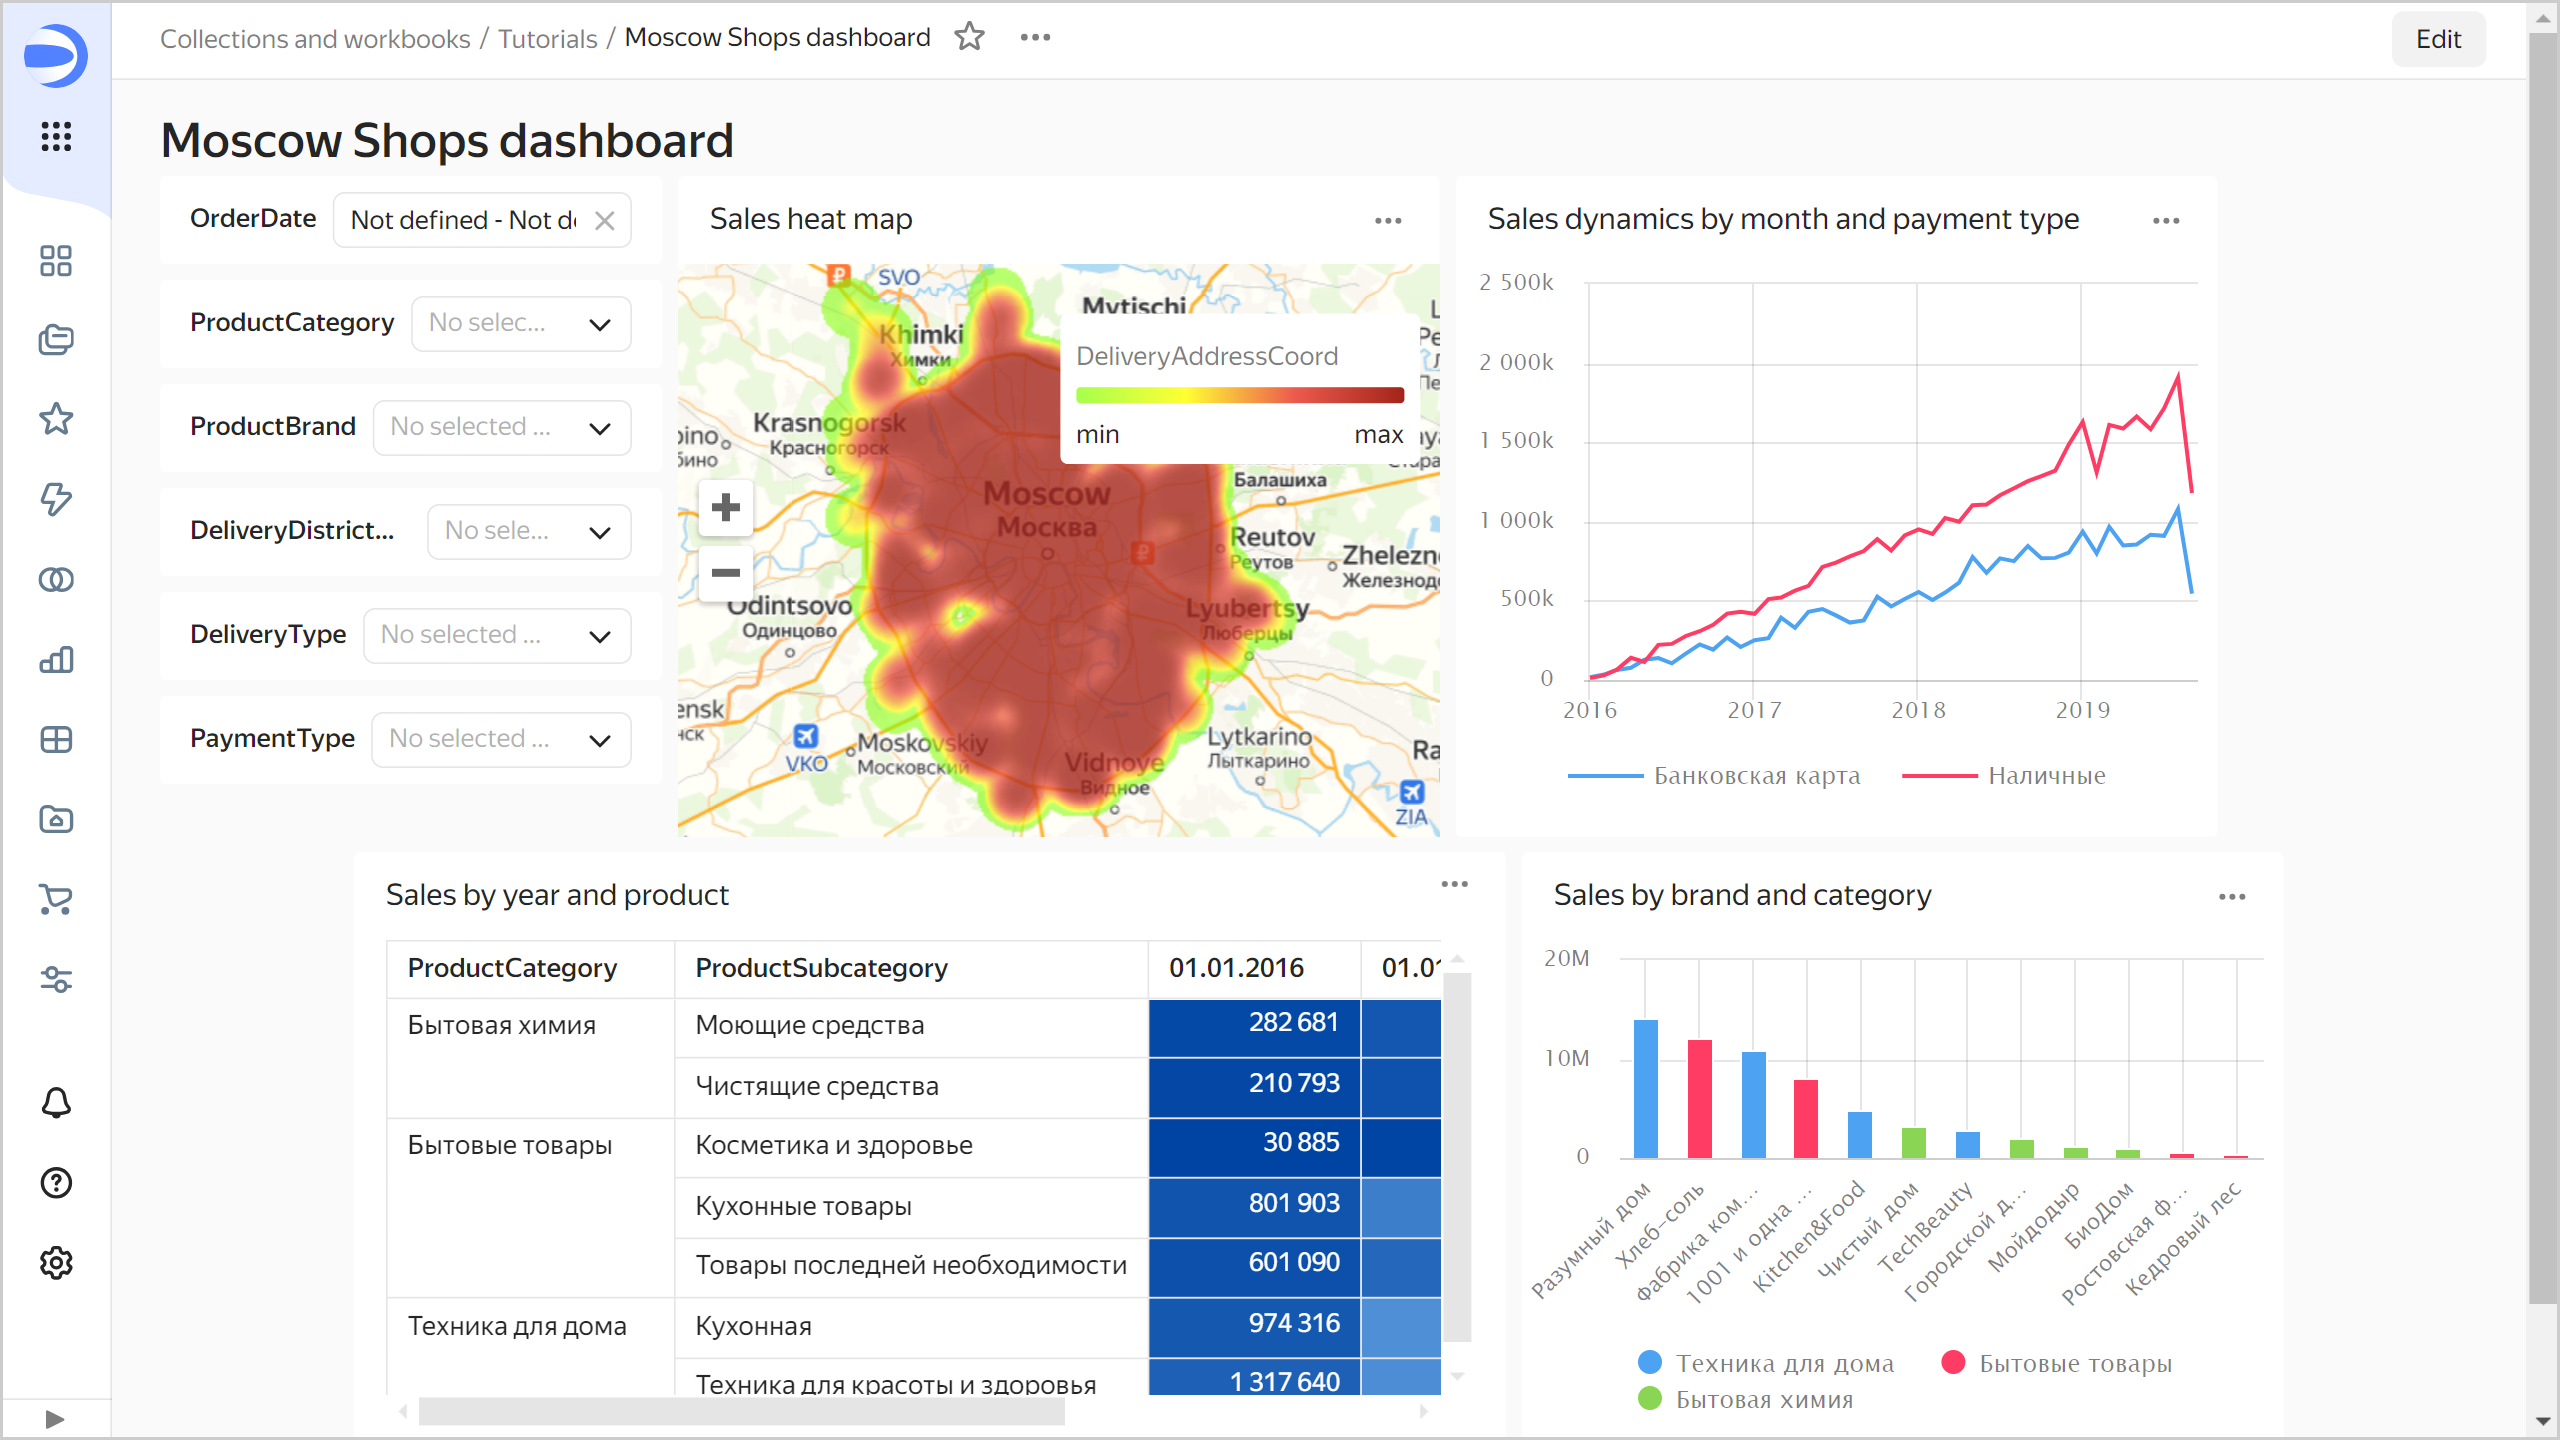
You can now use various filter combinations to see how your sales evolved for different products and cross sections. For example, you can analyze the dynamics of sales with delivery for the Household goods and Home appliances categories within the Izmaylovo delivery area over 01.01.2017 - 31.12.2018 and estimate the sales density on the heat map. To do this, set the selectors as follows:
OrderDate:01.01.2017 - 31.12.2018ProductCategory:Household goodsandHome appliancesDeliveryDistrictName:IzmaylovoDeliveryType:Delivery
ClickHouse® is a registered trademark of ClickHouse, Inc.