Setting up a demo Java app and collecting telemetry
Getting started
Sign up for Yandex Cloud and create a billing account:
- Navigate to the management console and log in to Yandex Cloud or create a new account.
- On the Yandex Cloud Billing page, make sure you have a billing account linked and it has the
ACTIVEorTRIAL_ACTIVEstatus. If you do not have a billing account, create one and link a cloud to it.
If you have an active billing account, you can create or select a folder for your infrastructure on the cloud page.
Learn more about clouds and folders here.
Setting up a demo app and telemetry delivery
In this example, you will install Spring PetClinic and set up sending telemetry data to Monium via Fluent Bit.
-
Install Git and Java suitable for your OS. Here is an example:
sudo apt update sudo apt install -y git openjdk-17-jdk -
Install Fluent Bit 4.0 or higher.
-
Set these environment variables:
export MONIUM_PROJECT=<project_ID> export MONIUM_API_KEY=<API_key> -
Create a configuration file, e.g.,
fluent-bit.yaml. Use the Fluent Bit settings section configuration. Example for gRPC:pipeline: inputs: - name: opentelemetry listen: 127.0.0.1 port: 4318 outputs: - name: opentelemetry match: "*" host: ingest.monium.yandex.cloud port: 443 tls: on compress: zstd grpc: on header: - Authorization Api-Key ${MONIUM_API_KEY} - x-monium-project ${MONIUM_PROJECT} -
Run Fluent Bit:
fluent-bit -c fluent-bit.yamlFluent Bit will start receiving telemetry over OTLP at
127.0.0.1:4318(HTTP). -
Download and build Spring PetClinic:
git clone https://github.com/spring-projects/spring-petclinic cd spring-petclinic ./mvnw -DskipTests package -
Download the OpenTelemetry Java agent:
curl -L -o opentelemetry-javaagent.jar \ https://github.com/open-telemetry/opentelemetry-java-instrumentation/releases/latest/download/opentelemetry-javaagent.jar -
Run the application with the Java agent. The telemetry will go to Fluent Bit port 4318. Do not specify
OTEL_EXPORTER_OTLP_METRICS_TEMPORALITY_PREFERENCE="delta": when transferred via Fluent Bit, delta metrics cannot be processed correctly.OTEL_SERVICE_NAME=spring-petclinic \ OTEL_EXPORTER_OTLP_METRICS_TEMPORALITY_PREFERENCE="cumulative" \ java -javaagent:./opentelemetry-javaagent.jar -jar target/*.jar -
Open Spring PetClinic at
http://localhost:8080and simulate user actions.
Viewing telemetry in Monium
-
On the Monium home page, select a data type section on the left:
MetricsLogsTraces-
At the top, set the data search time period on the timeline.
-
In the search bar, enter a query to search for telemetry data:
-
project = <project_ID>: Select the project specified inx-monium-projectof the application's telemetry transmission configuration.This may be a cloud (
cloud__<cloud_ID>) or folder (folder__<folder_ID>) project, or another project. -
cluster = <cluster_name>: Select the name of the installation that runs your application. If no cluster is specified,cluster = defaultis used. -
service = <service_name>: Name of your application or service. You can use theOTEL_SERVICE_NAMEenvironment variable to provide it.If you do not see the required labels in the suggestions, you can enter them manually. However, the system most likely has not received data with these labels. For more on troubleshooting possible issues, see Data delivery troubleshooting.
-
-
Click Execute query or Execute.
The page will show data that matches the query.
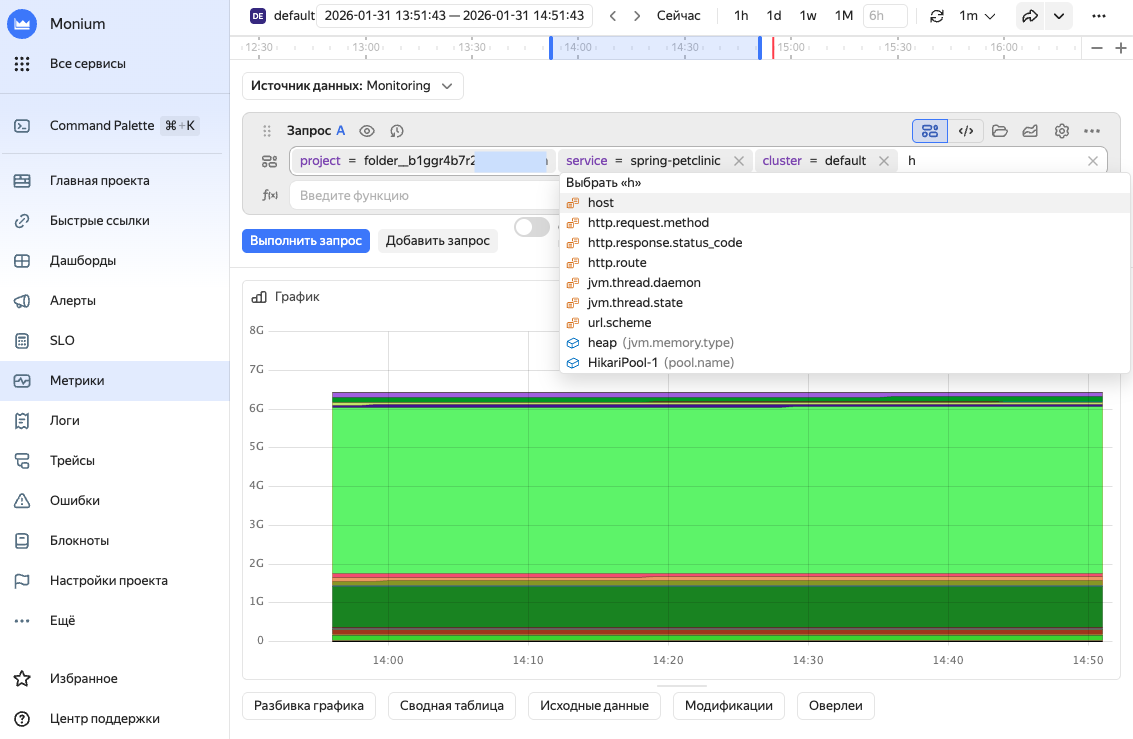
More on metrics.
-
At the top, set the data search time period on the timeline.
-
In the search bar, enter a query to search for telemetry data:
-
project = <project_ID>: Select the project specified inx-monium-projectof the application's telemetry transmission configuration.This may be a cloud (
cloud__<cloud_ID>) or folder (folder__<folder_ID>) project, or another project. -
cluster = <cluster_name>: Select the name of the installation that runs your application. If no cluster is specified,cluster = defaultis used. -
service = <service_name>: Name of your application or service. You can use theOTEL_SERVICE_NAMEenvironment variable to provide it.If you do not see the required labels in the suggestions, you can enter them manually. However, the system most likely has not received data with these labels. For more on troubleshooting possible issues, see Data delivery troubleshooting.
-
-
Click Execute query or Execute.
The page will show data that matches the query.
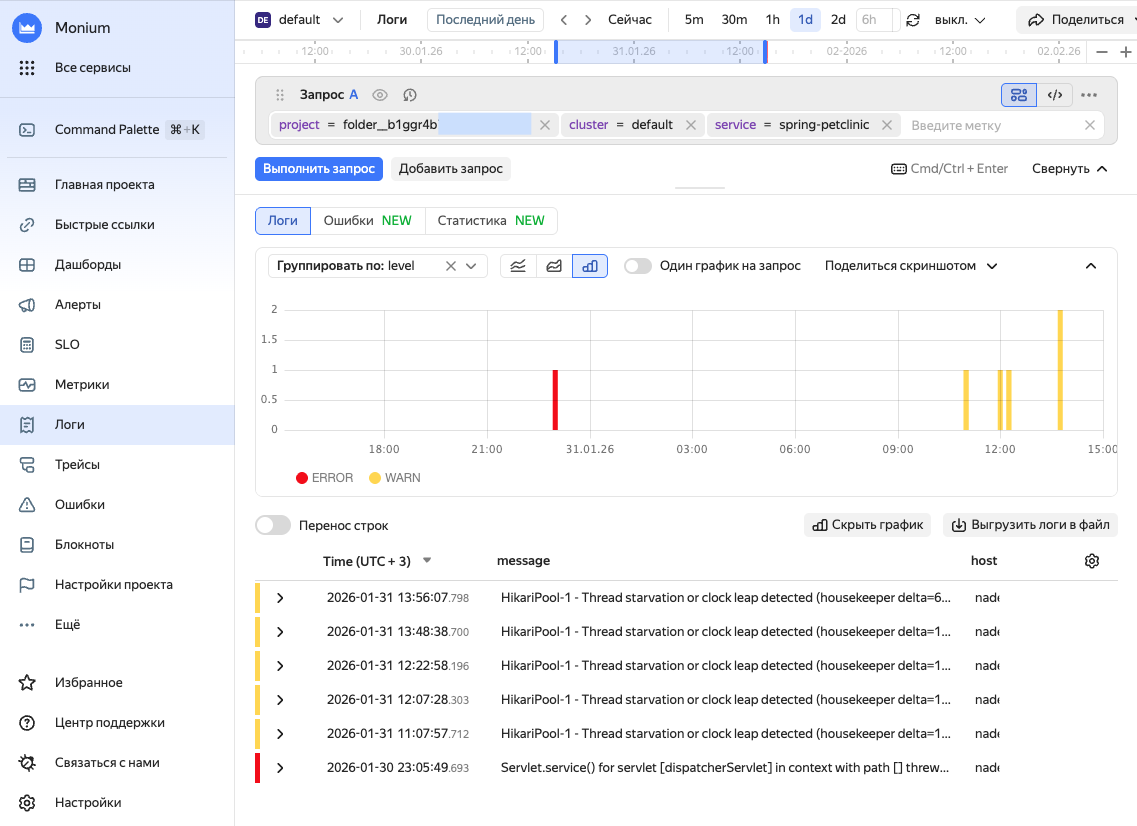
More on logs.
-
At the top, set the data search time period on the timeline.
-
In the search bar, enter a query to search for telemetry data:
-
project = <project_ID>: Select the project specified inx-monium-projectof the application's telemetry transmission configuration.This may be a cloud (
cloud__<cloud_ID>) or folder (folder__<folder_ID>) project, or another project. -
cluster = <cluster_name>: Select the name of the installation that runs your application. If no cluster is specified,cluster = defaultis used. -
service = <service_name>: Name of your application or service. You can use theOTEL_SERVICE_NAMEenvironment variable to provide it.If you do not see the required labels in the suggestions, you can enter them manually. However, the system most likely has not received data with these labels. For more on troubleshooting possible issues, see Data delivery troubleshooting.
-
-
Click Execute query or Execute.
The page will show data that matches the query.
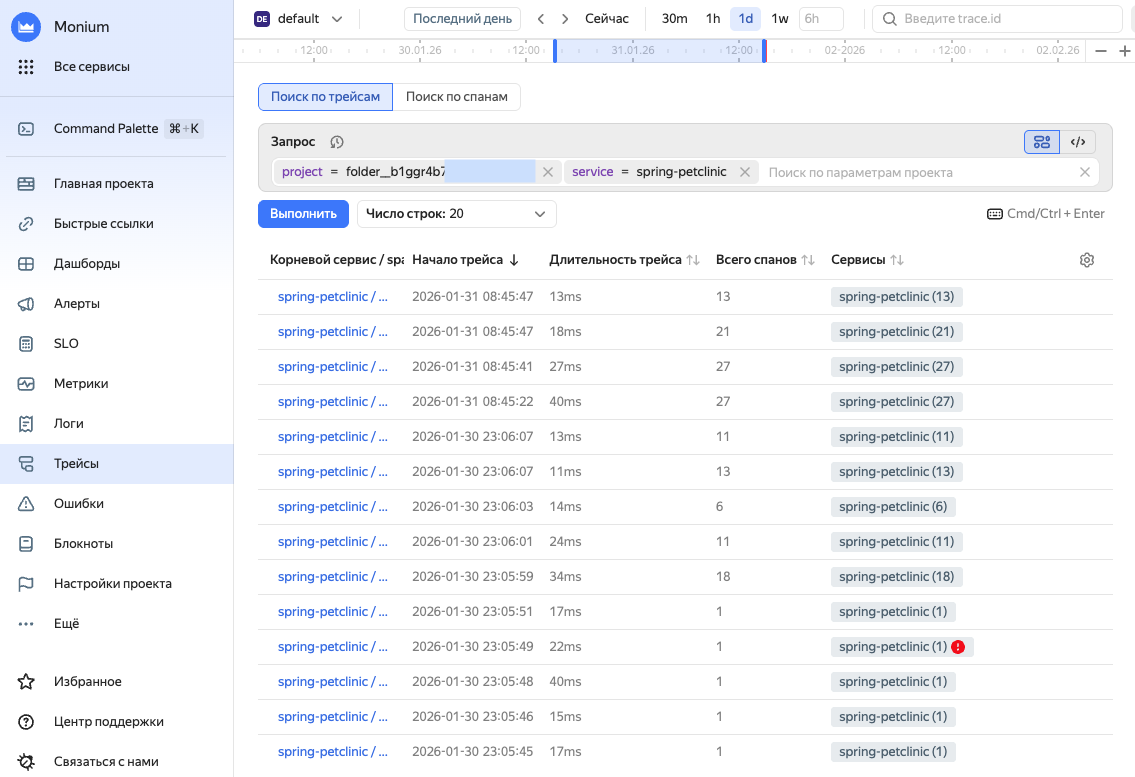
More on traces.
-
-
To view information about the data shard, select Shards on the left and then, the shard with your service name.