AppMetrica: Direct connection
You can visualize and explore AppMetrica data in Yandex DataLens using the following methods:
- Direct access.
DataLens connects directly to AppMetrica. This method is the easiest and fastest but supports a limited set of functions. - Real-time export of data from AppMetrica to Managed Service for ClickHouse®.
Raw data is available and you can use pre-aggregation and post-processing at the database level. To implement this option, set up data export and create a connection from DataLens to the ClickHouse® database.
In this tutorial, we use direct access. An application added to AppMetrica will be used as the data source. You can view a list of applications available to you under Applications.
If you do not have any apps available, then before implementing this tutorial, add an app or use the standard AppMetrica Dashboard.
To visualize and explore data, set up DataLens and follow the steps below:
Getting started
To get started with DataLens:
- Log in to your Yandex account. If you do not have an account, create one.
- Open the DataLens home page.
- Click Start in cloud.
- Confirm that you have read the Terms of use and click Log in.
-
Log in to your Yandex account.
-
Open the DataLens home page.
-
Click Start in cloud.
-
Select one of these options:
-
If you already have an organization, select it from the drop-down menu in the Organizations tab and click DataLens.
Note
To activate a DataLens instance, the user must have the
adminorownerrole. For more information about roles, see Access management in Yandex Identity Hub. -
If you have a cloud but no organization, click Add new DataLens. In the window that opens, enter a name and description for your organization and click Create organization and DataLens. For more information about working with organizations, see Getting started with organizations.
-
If you encounter a technical issue with the service, contact Yandex Cloud support. To ask for advice, discuss a solution to your issue, or explore current best practices, join the DataLens chat in Telegram.
Create a connection and a standard dashboard
Warning
This step is available to users who have an app in AppMetrica. If you do not have any apps, open the standard AppMetrica dashboard and go to the next step.
-
Go to DataLens.
-
In the left-hand panel, select Connections and click Create connection.
-
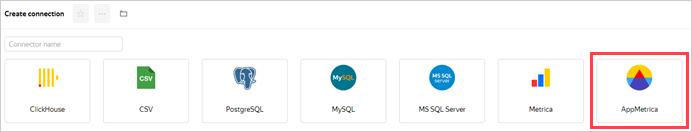
Select AppMetrica as the connection type.
-
Enter
My AppMetricafor the connection name and click Get token.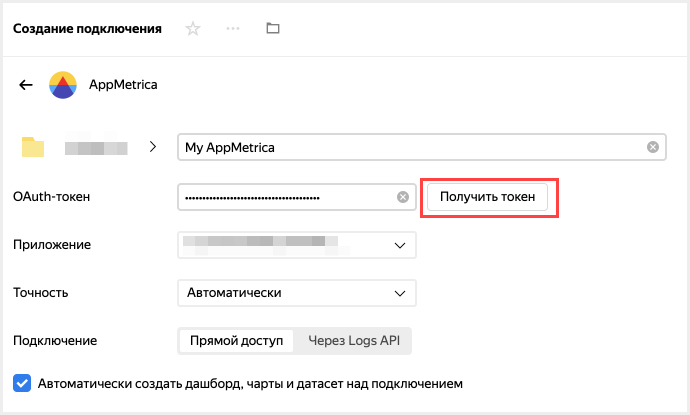
If this is your first connection to an AppMetrica app, grant the required permissions to the service.
-
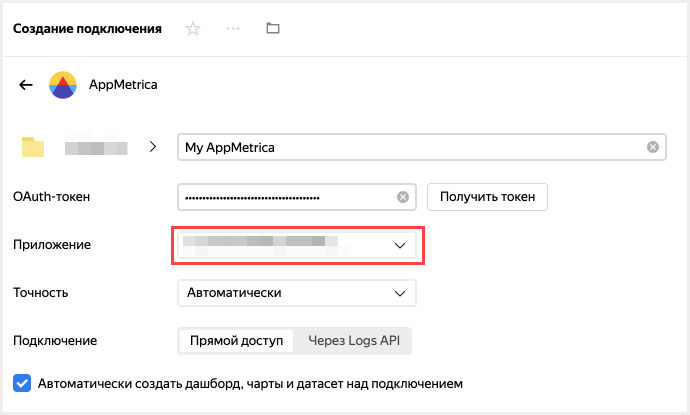
Select the app from the drop-down list.
-
Set up your connection:
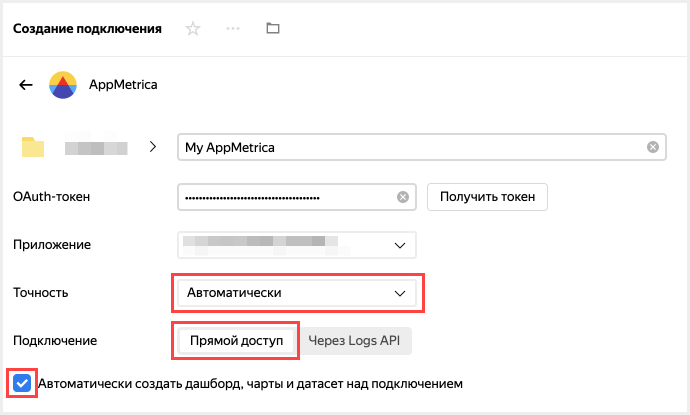
- Set the data accuracy (sampling rate). You can change the accuracy after you create the connection.
- Select the Direct access connection type.
- Enable Automatically create a dashboard on this connection.
-
In the top-right corner, click Create.
Once the connection is created, a folder containing a dashboard and a set of datasets and charts will open.
Note
- By default, AppMetrica data is exported for the last 60 days. If you add a filter by date to the chart, the AppMetrica filter will be reset. We recommend adding a filter by date as an offset relative to the current date.
- On the AppMetrica side, there is a quota of three concurrent requests per API key.
Edit the standard dashboard
Warning
If you do not have an app in AppMetrica and you skipped the previous step, use the AppMetrica dashboard.
You can edit the standard dashboard however you want. For example, you can delete a chart, resize it, or change the visualization type.
-
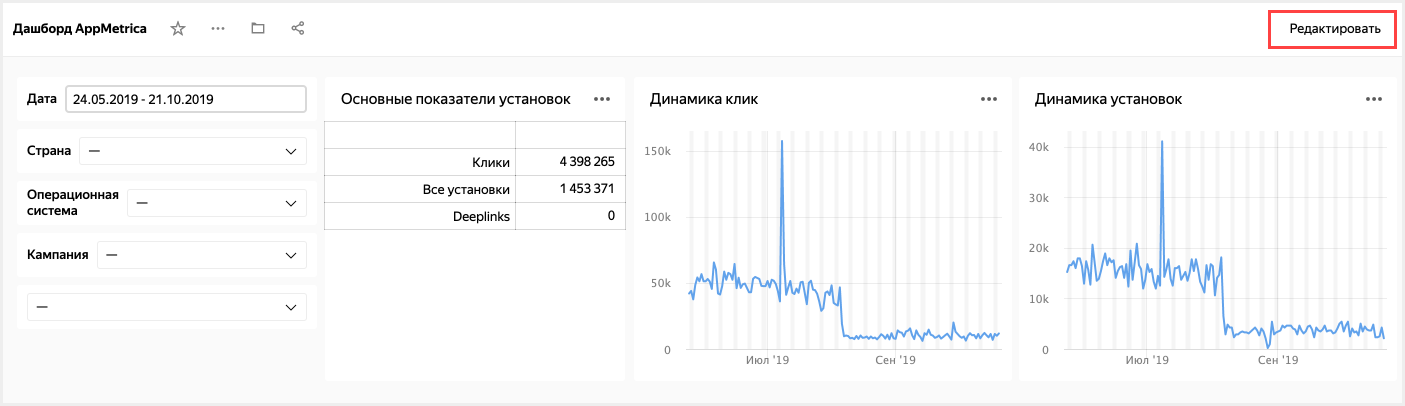
Open the dashboard.
-
Click Edit in the top-right corner.
-
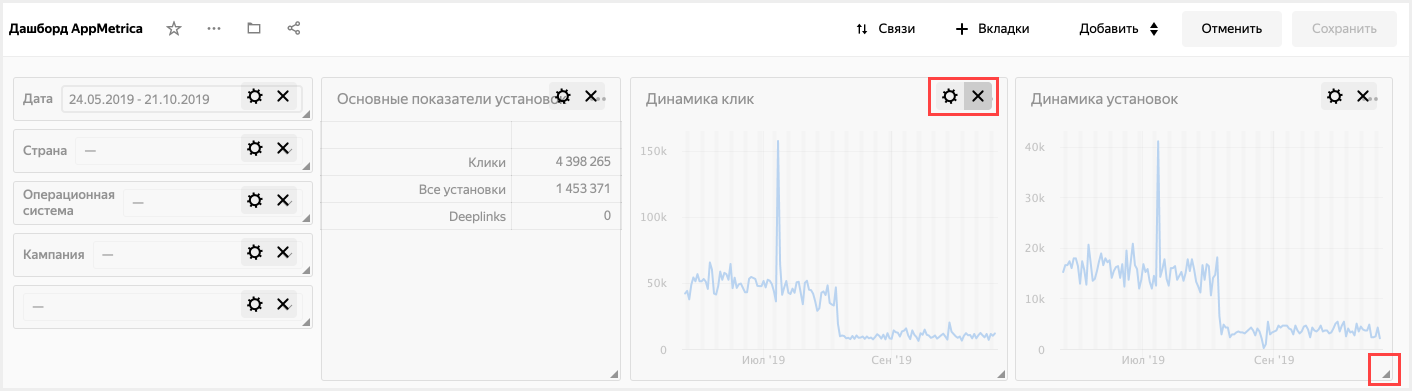
To delete the Click dynamics widget, click in the top-right corner.
-
To resize the Installation dynamics widget, drag it by the bottom-right corner.
-
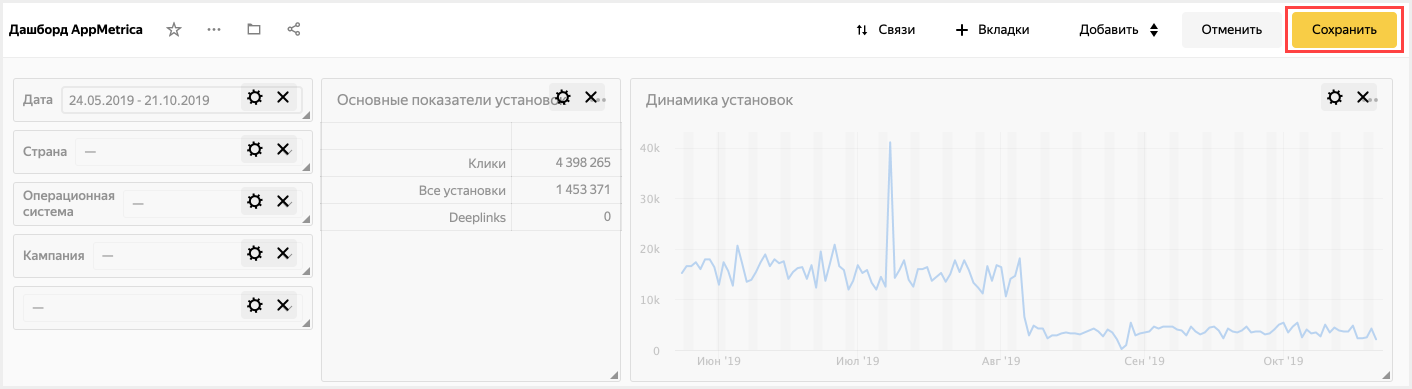
Click Save in the top-right corner to save the dashboard.
You can edit any chart on the dashboard. For example, change the visualization type for the Ad networks chart from Attracting users.
To share a dashboard or chart, use one of the following methods:
- Add a user to your organization or cloud and grant them access to a dashboard or chart.
- Export data to a Managed Service for ClickHouse® cluster and use a connection to the ClickHouse® database as a source. To learn more about the Managed Service for ClickHouse® pricing plans, see Pricing.
ClickHouse® is a registered trademark of ClickHouse, Inc.