Scatter chart
A scatter chart shows the relationship between two values (dimensions or measures). Their values are represented as points. A scatter chart always has two axes: the values of one dimension or measure are plotted along the X-axis and those of the other along the Y-axis. A data point that links these two values is displayed at the intersection of the X and Y coordinates. These data points can be distributed along the X-axis evenly or unevenly, depending on specific data.
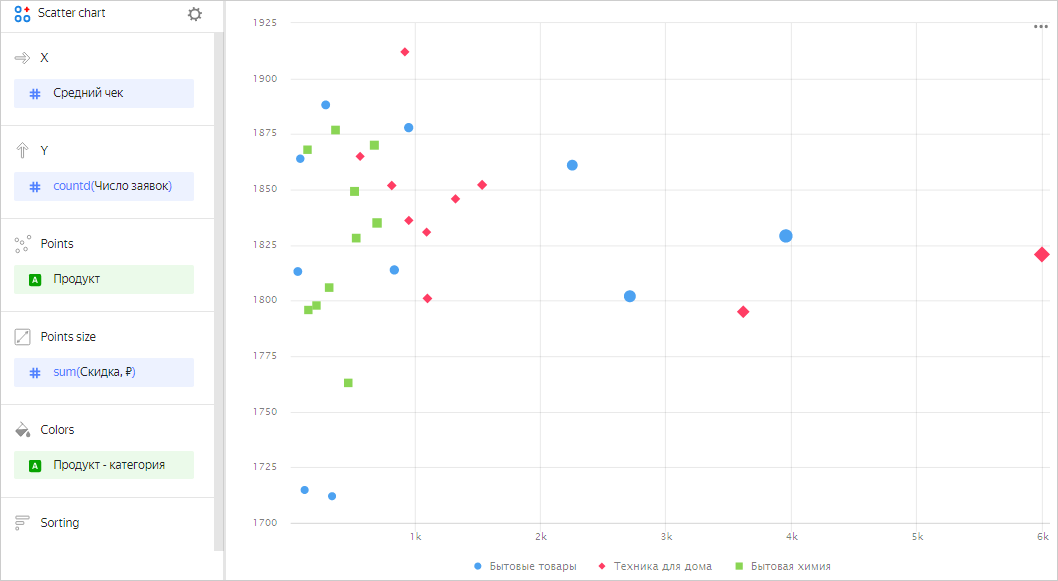
Use this type of chart if you need to find the dependency between dimensions and measures or show a range of values. For example, the relationship between the average order value and the number of orders for a product.
You can also represent dependencies on a scatter chart using point sizes. The size of a point depends on the measure value: the higher the value, the larger the point size. For example, the size of a point may depend on the discount on a product.
A slice of two rows from the source table
| Product | Category | Average order value | Number of orders | Discount |
|---|---|---|---|---|
| Floor cleaner liquid | Household cleaners | 153.0 | 1 | 0 |
| Multicooker with 40 modes | Home appliances | 3442.0 | 1 | 0 |
| Liquid detergent for colored clothes | Household cleaners | 525.0 | 1 | 0 |
| Carpet detergent | Household cleaners | 463.0 | 1 | 0 |
| Lemon dishwashing liquid | Household cleaners | 362.0 | 1 | 0 |
The dataset is built on Sample ClickHouse connection tables.
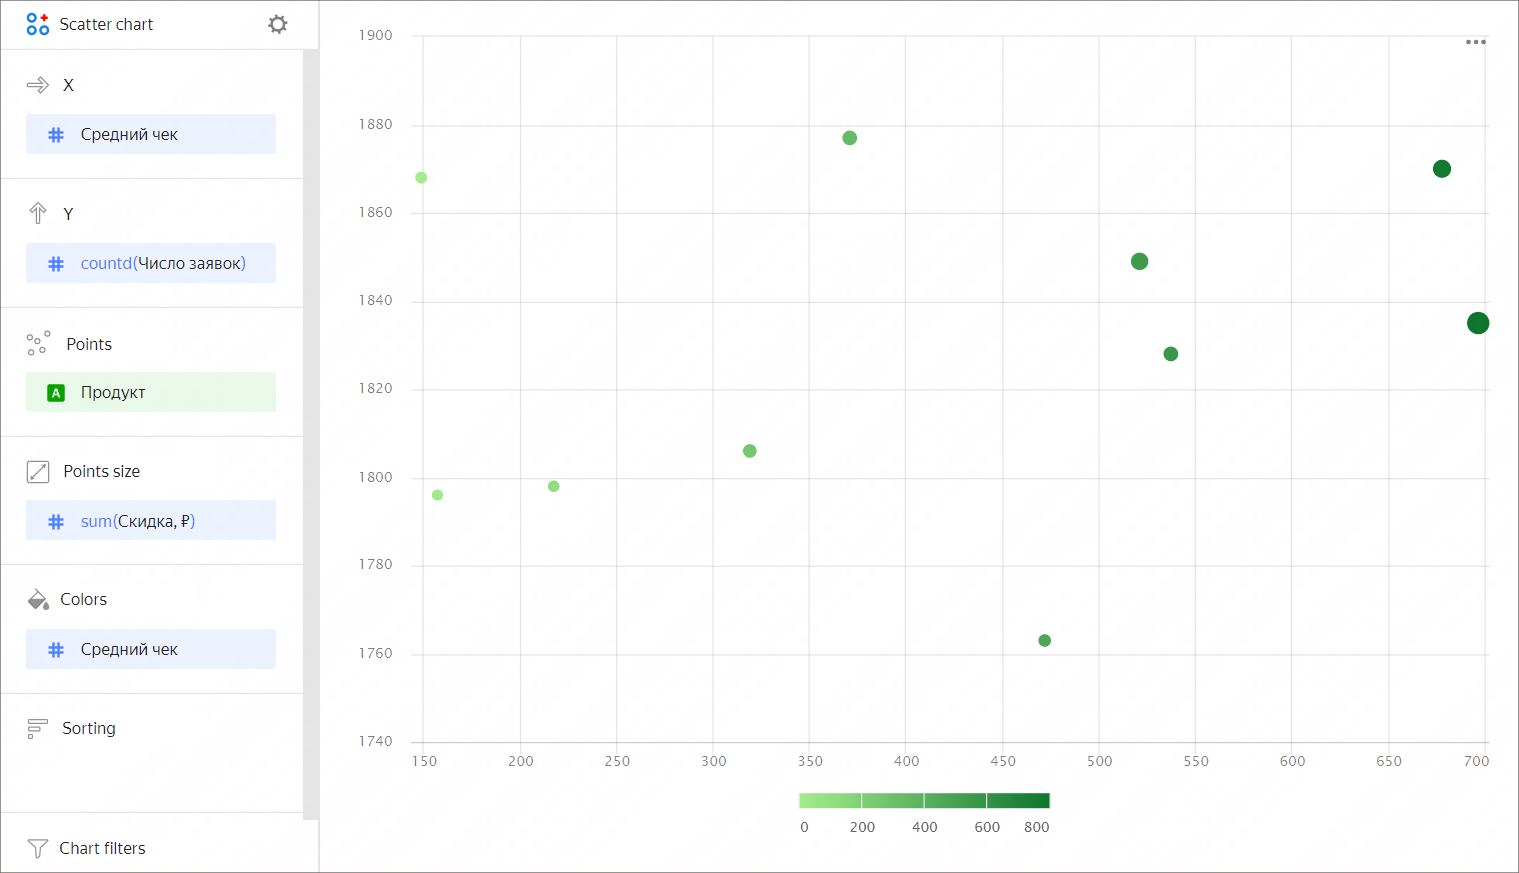
You can use a gradient in a chart by adding a measure to the Color section. For example, the higher the average order value for a product, the darker the point shade.
Wizard sections
| Section section |
Description |
|---|---|
| X | Dimension or measure. Sets the X-axis value. For String type fields, you can configure using basic Markdown syntax: click the icon before the field name and enable Markdown. |
| Y | Dimension or measure. Sets the Y-axis value. For String type fields, you can configure using basic Markdown syntax: click the icon before the field name and enable Markdown. |
| Points | Dimension. Specifies the number of points on the chart. |
| Point size | Measure. Sets point size depending on the measure value. |
| Colors | Dimension or measure. Affects the color of points. |
| Sorting | Dimension. You can only use a dimension from the X axis. Affects the sorting of the X axis. The sorting direction is marked with an icon next to the field: for ascending or for descending. To change the sorting direction, click the icon. |
| Filters | Dimension or measure. Used as a filter. |
Creating a scatter chart
To create a scatter chart:
Warning
If you use a new DataLens object model with workbooks and collections:
- Go to the DataLens home page. In the left-hand panel, select Collections and workbooks.
- Open the workbook, click Create in the top-right corner, and select the appropriate object.
Follow the guide from step 4.
- Go to the DataLens home page.
- In the left-hand panel, select Charts.
- Click Create chart → Chart.
- At the top left, click Select dataset and specify the dataset to visualize. If you do not have a dataset, create one.
- Select Scatter chart as the chart type.
- Drag a dimension from the dataset to the X section.
- Drag one or more measures from the dataset to the Y section. The values will be displayed as points at the intersection of the X and Y axes.
You can also:
-
Change the color of points:
- Drag a dimension or measure to the Colors section.
- Click and set new colors.
-
Resize points:
- Drag the measure to the Point size section.
- Click and set the minimum and maximum point sizes for the specified measure.
-
Specify an additional dimension. To do this, drag a dimension to the Points section.
Configuring display of null values
If the source data includes a row where the measure value is null, the chart will not be built for that point at default settings. For example, if the source has a row with a date (20.07.2022) but the sales amount for it is missing.
You can configure how the chart will display null values in the chart section settings:
- In the section with a measure whose values you want to show, in the top-right corner, click (the icon appears when you hover over the section).
- In Empty values (null), select
Display as 0. - Click Apply.
Now, the chart will use 0 instead of null.
If a row is missing from the source data completely, the chart section settings will not change the way the chart is presented. For example, if the source does not have a row with a certain date (20.07.2022), nothing will be shown for this date on the chart.
For more information, see Configuring the display of null values.
Recommendations
-
If the values of the categories contain a large amount of text, try to reduce it. Then the signatures on the diagram will look more accurate. You can use string functions in the calculated fields or conditional operators CASE.
- The axis scale often varies and may start with a value other than 0. Pay attention to value signatures.
- A scatter chart isn't suitable for visualization of data over time.
- When visualizing multiple measures, select colors carefully. They should be distinguishable and contrasting.