Writing metrics to Monitoring


Monitoring is a service that collects, stores, and presents metrics on dashboards. The data that goes to Monitoring contains the measured quantity values (metrics) and the labels describing them.
For example, to count app failures, you can use failure count during time interval as the metric. Host name and application version at the time of failure are labels. In the Monitoring interface, you can aggregate metrics by labels.
Query example for writing metrics from Yandex Query into Monitoring:
INSERT INTO `monitoring`.custom
SELECT
    `my_timestamp`,
    host_name,
    app_version,
    exception_count,
    "exception_monitor" AS service_type
FROM $query;
During stream processing, Yandex Query can send query results to Monitoring as metrics and their labels.
Setting up a connection
To set up sending metrics to Monitoring:
-
Navigate to Yandex Query.
-
In the left-hand panel, select Connections.
-
Click Create new.
-
In the window that opens, specify the Monitoring connection name in the Name field.
-
In the Type field, select
Monitoring. -
In the Service account field, select the service account you will use to write metrics, or create a new one and assign the
monitoring.editorrole to it.To use the service account on your behalf, you need the
iam.serviceAccounts.userrole. -
Click Create.
Data model
To write metrics to Monitoring, use the following SQL statement:
INSERT INTO
    <connection>.custom
SELECT
    <fields>
FROM
    <query>;
Where:
<connection>: Name of the Monitoring connection created in the previous section.<fields>: List of fields that include a timestamp, metrics, and their labels.<query>: Yandex Query source data query.
Note
To write custom metrics, use the INSERT INTO <connection>.custom structure. Where custom is a reserved name in Monitoring.
To write metrics, use the write Monitoring API method. Provide the following data:
- Timestamp.
- List of metrics and their types: Yandex Query supports the
DGAUGEandIGAUGEtypes. - List of labels.
Yandex Query automatically infers parameter semantics from the SQL query.
|
Field type |
Description |
Restrictions |
|
Time: |
Common timestamp for all metrics |
A query can have only one timestamp field. |
|
Integer: |
Metric values, |
The field name from the SQL statement is the metric name. A single query may contain an unlimited number of metrics. |
|
Floating point: |
|
The field name from the SQL statement is the metric name. A single query may contain an unlimited number of metrics. |
|
Text: |
Label values |
The field name in the SQL statement serves as the label name, and its text value as the label value. A single query can contain an unlimited number of labels. |
No other data types are permitted in these fields.
Metrics writing example
Query example for writing metrics from Yandex Query to Monitoring:
INSERT INTO
    `monitoring`.custom
SELECT
    `my_timestamp`,
    host AS host_name,
    app_version,
    exception_count,
    "exception_monitor" AS service_type
FROM $query;
Where:
|
Field |
Type |
Description |
|
|
Monitoring connection name |
|
|
|
Data source in SQL query. This can be a YQL subquery, including a connection to a data source. |
|
|
|
Timestamp |
Data source: |
|
|
Metric |
Data source: |
|
|
Label |
Data source: |
|
|
Label |
Data source: |
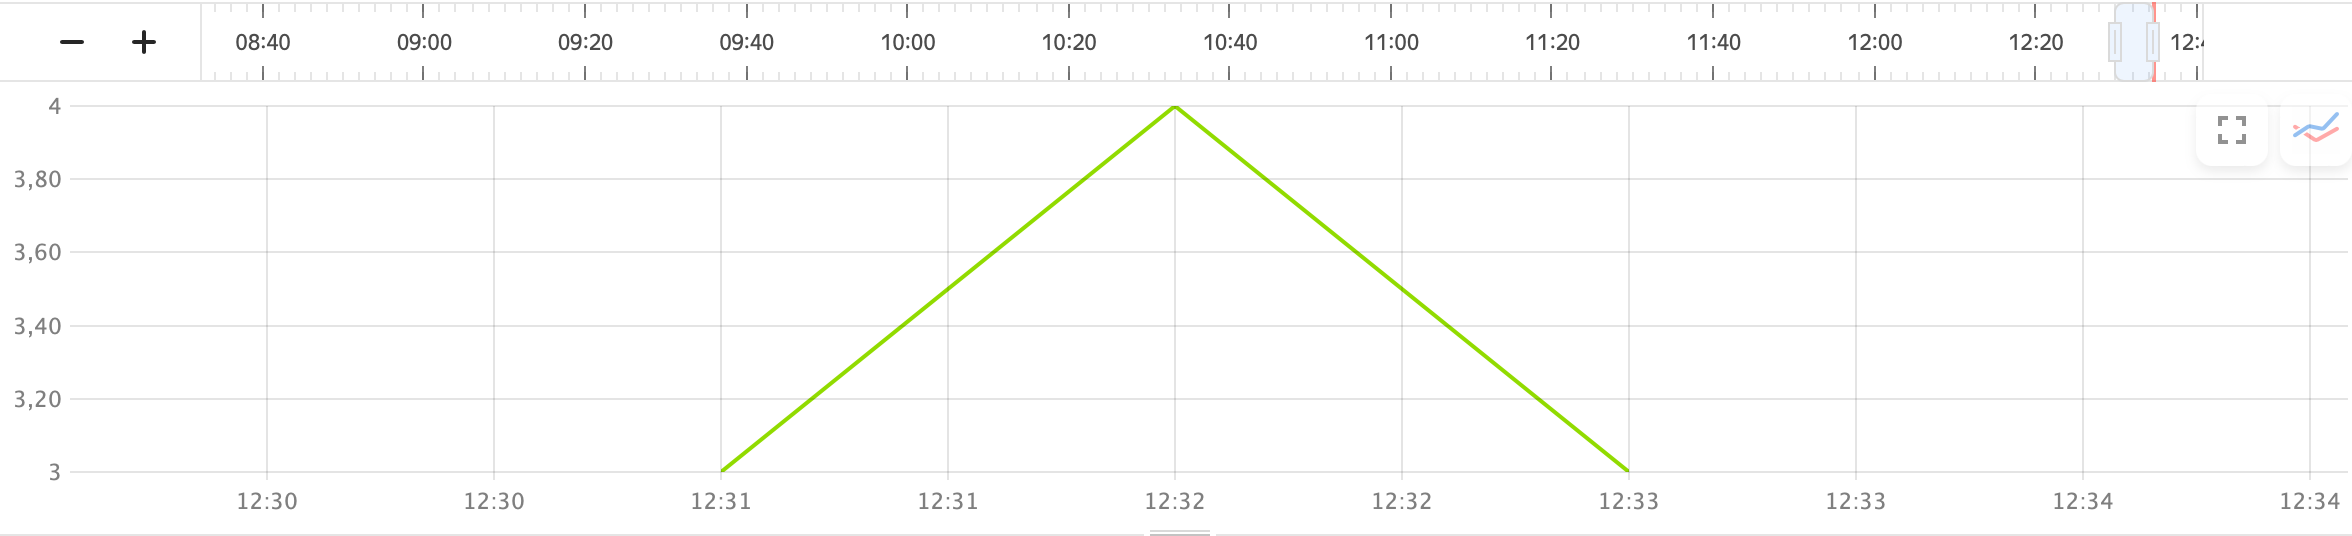
Example of query results in Monitoring: