Yandex Cloud
Search
Contact UsTry it for free
  • Customer Stories
  • Documentation
  • Blog
  • All Services
  • System Status
    • Featured
    • Infrastructure & Network
    • Data Platform
    • AI for business
    • Security
    • DevOps tools
    • Serverless
    • Monitoring & Resources
  • All Solutions
    • By industry
    • By use case
    • Economics and Pricing
    • Security
    • Technical Support
    • Start testing with double trial credits
    • Cloud credits to scale your IT product
    • Gateway to Russia
    • Cloud for Startups
    • Center for Technologies and Society
    • Yandex Cloud Partner program
    • Price calculator
    • Pricing plans
  • Customer Stories
  • Documentation
  • Blog
© 2025 Direct Cursus Technology L.L.C.
All solutions
    • All solutions for Monitoring
    • You set up a notification channel in Monitoring, but you do not receive any event notifications
    • Your cloud resources are running normally, but you see gaps in monitoring charts

In this article:

  • Issue description
  • Solution
  1. Monitoring
  2. Your cloud resources are running normally, but you see gaps in monitoring charts

Your cloud resources are running normally, but you see gaps in monitoring charts

Written by
Yandex Cloud
Updated at December 17, 2025
  • Issue description
  • Solution

Issue descriptionIssue description

On the monitoring page of your cloud resource, you see gaps and voids in one or more charts; however, your cloud resource operates properly.

SolutionSolution

Gaps in monitoring charts depend on the specifics of chart display for certain cloud resource types. This may be the case if you enabled downsampling in the chart settings. It substantially accelerates rendering of pages that aggregate many monitoring metrics.

However, if Monitoring receives low values for certain metrics (plotted against the Y axis), you may see gaps in the chart lines with enabled downsampling. Such gaps usually do not mean you have issues with the cloud resource.

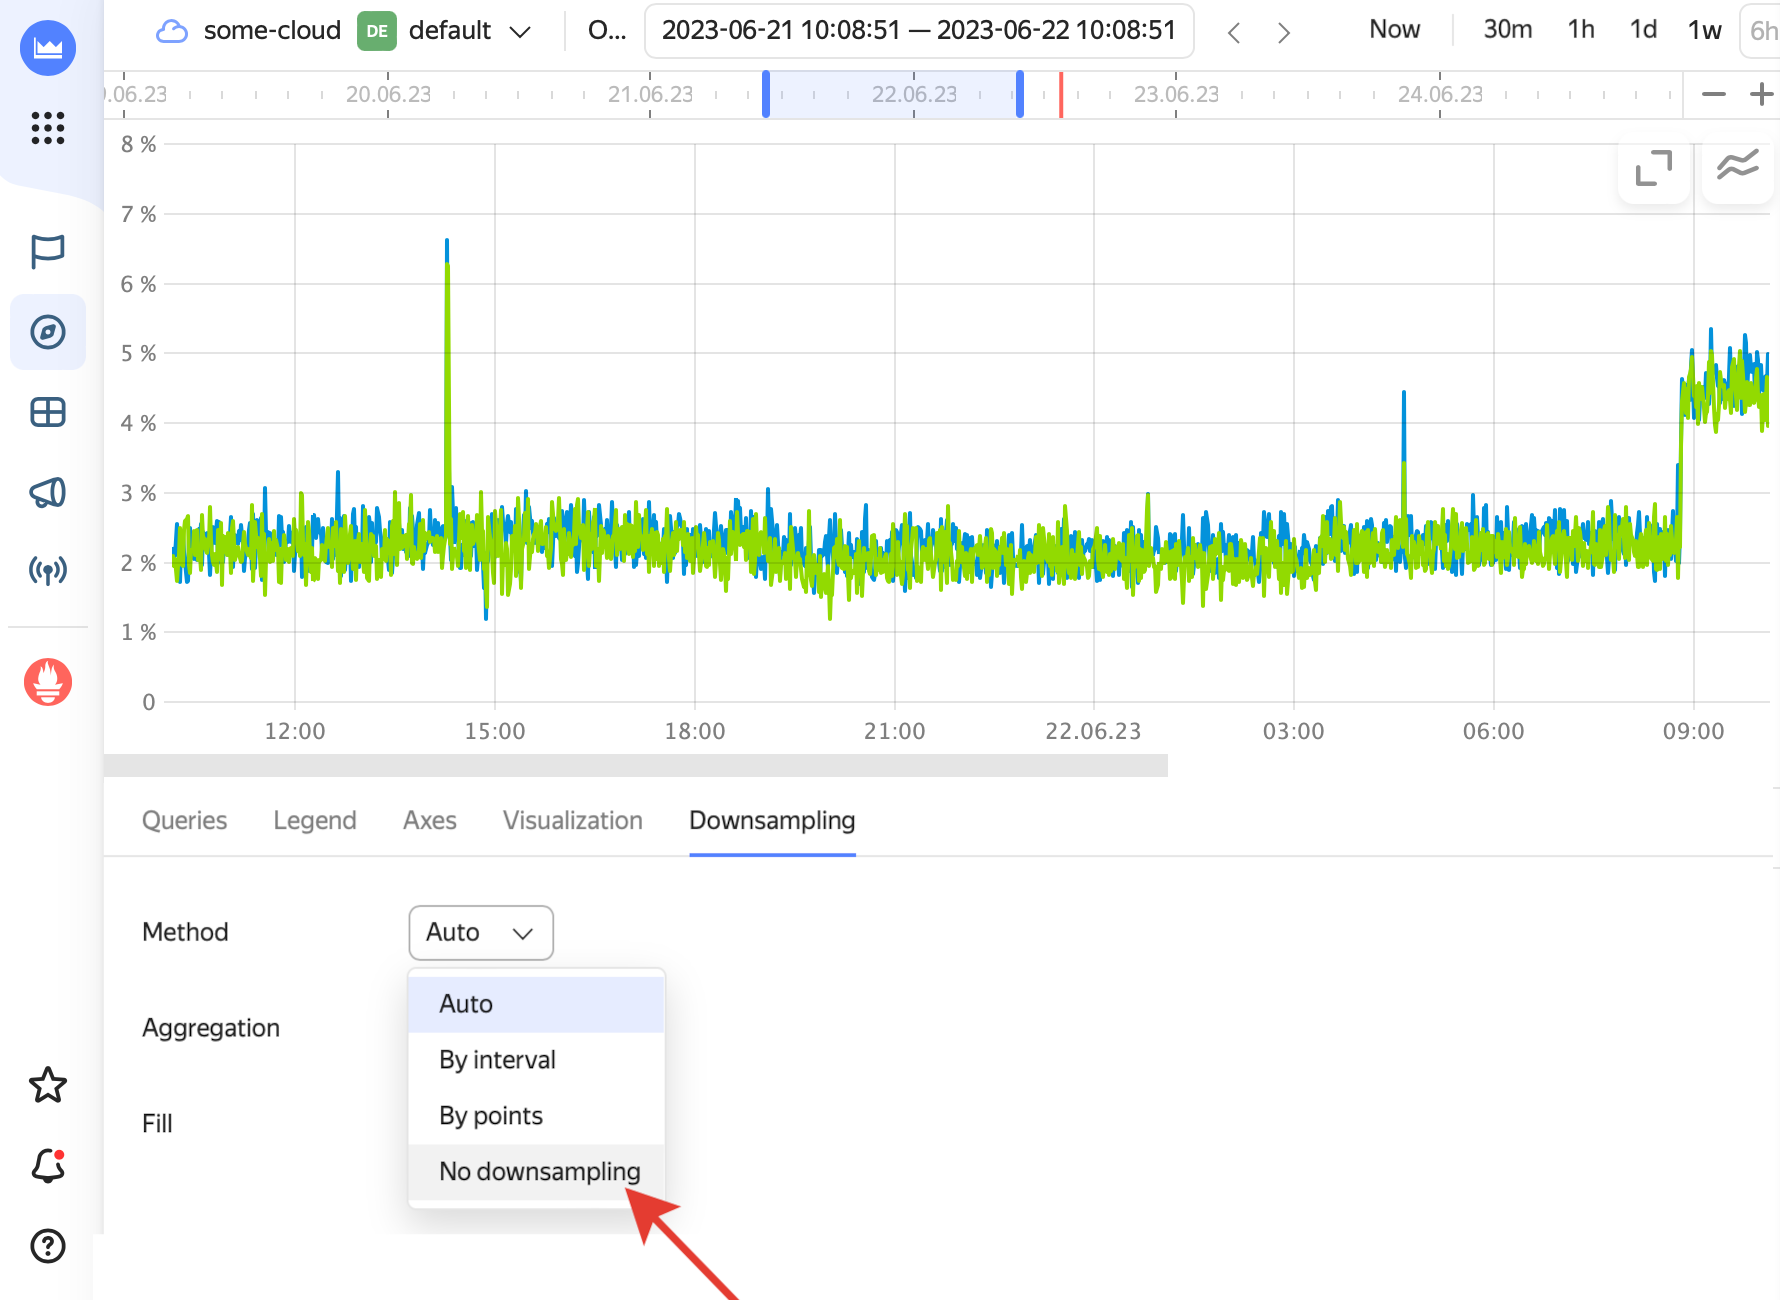
You can disable downsampling for a chart in Monitoring. To do this, follow these steps:

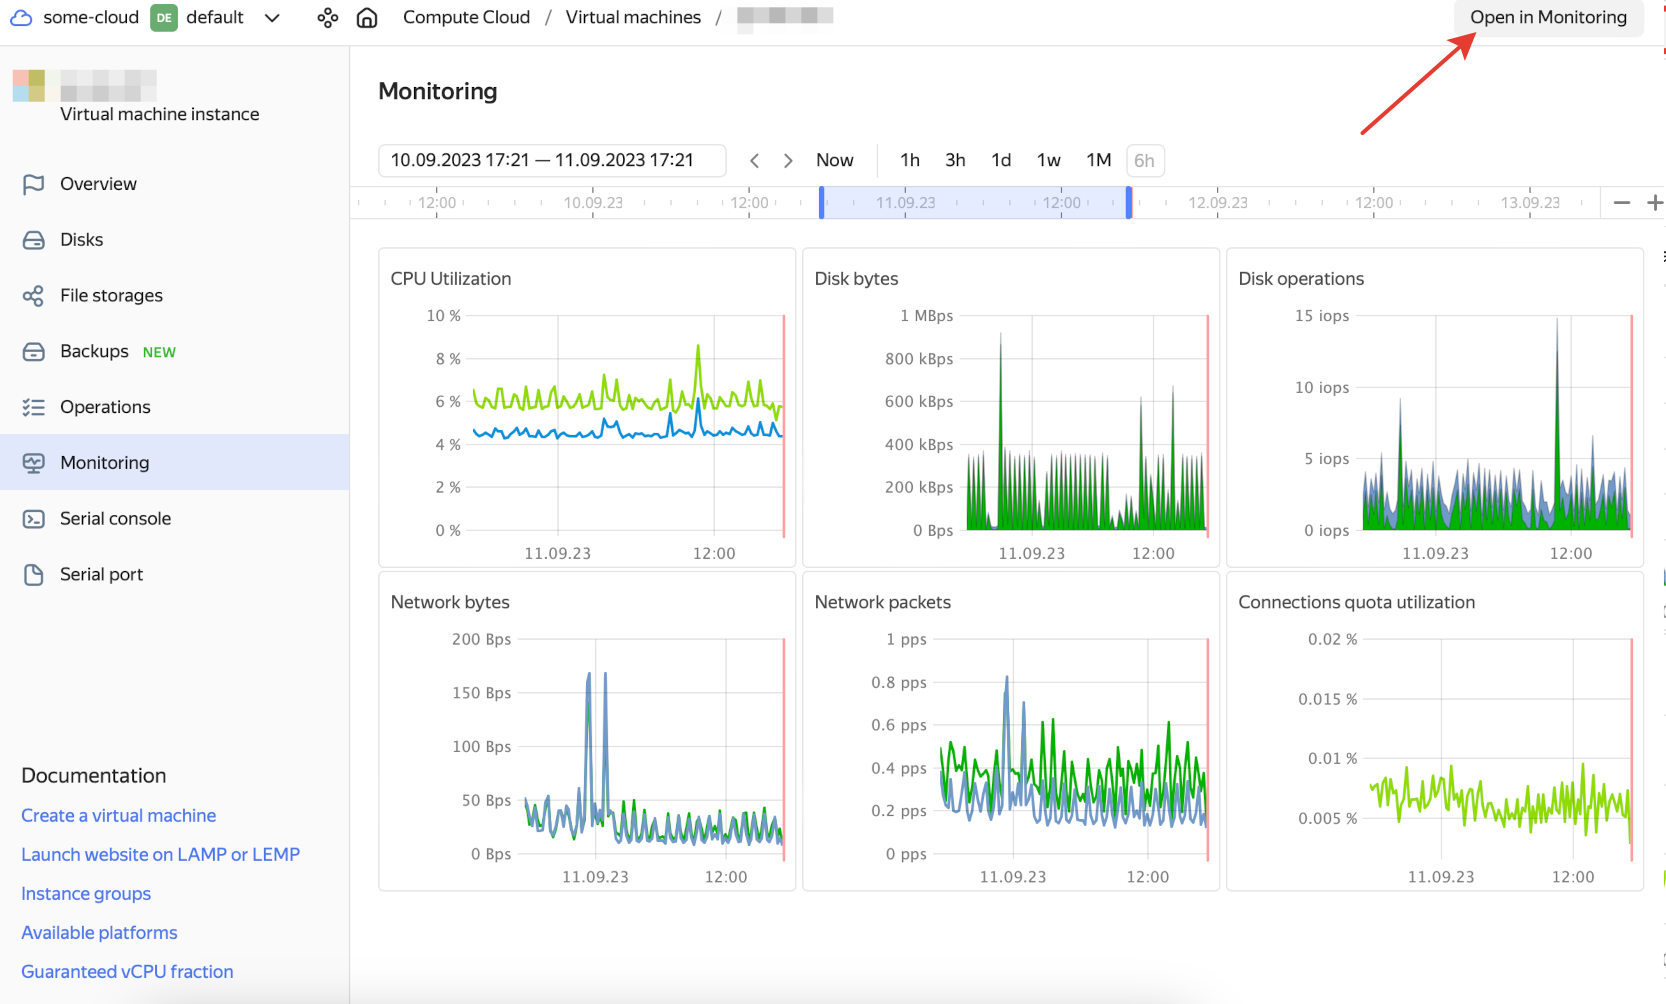
  1. Open the page of your cloud resource and navigate to Monitoring.

  2. In the top-right corner of the page, click Open in Monitoring:
    image

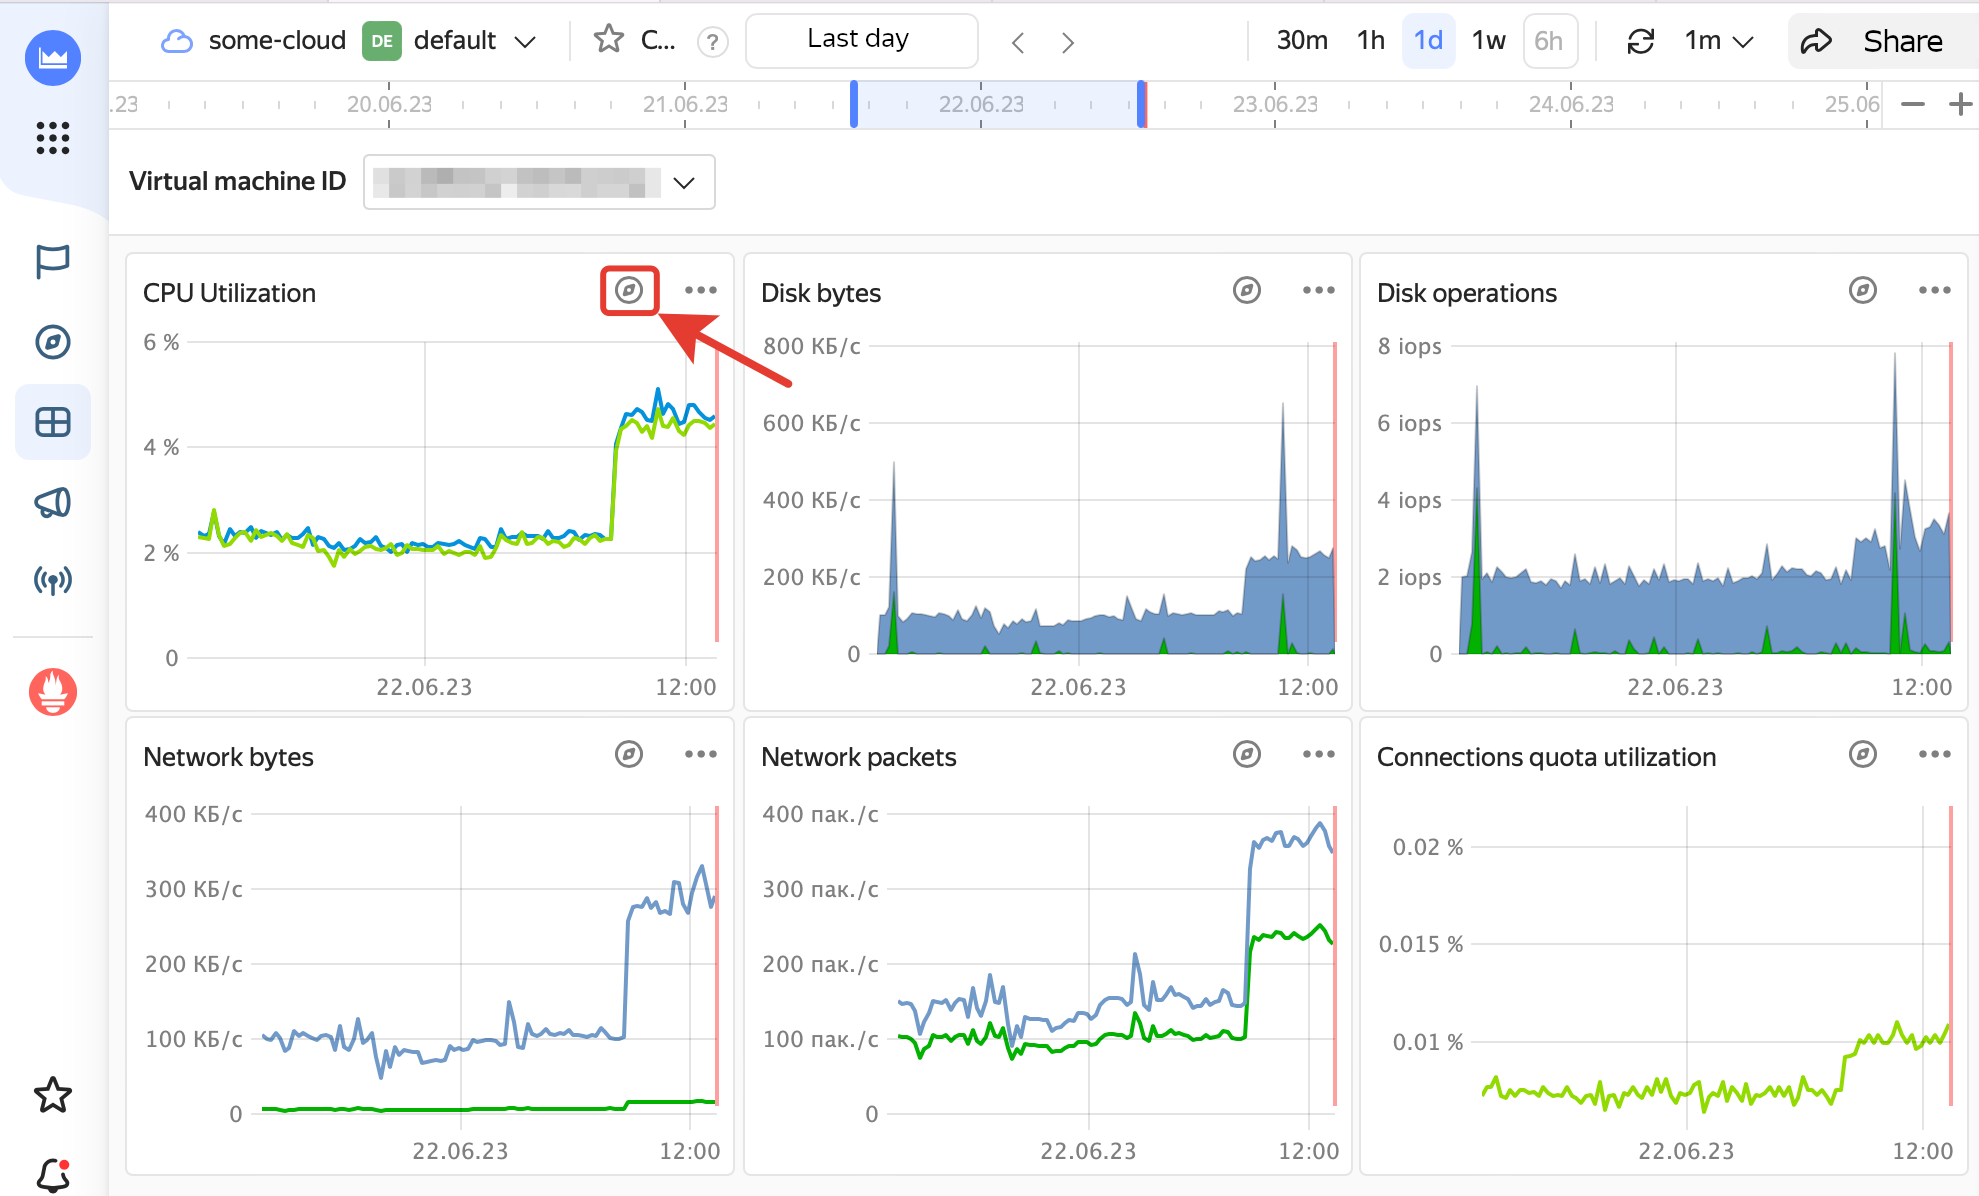
  3. Click the button to the right of the chart name:
    image

  4. Navigate to the Downsampling tab and select the No downsampling value for the Method field:
    image

Was the article helpful?

Previous
You set up a notification channel in Monitoring, but you do not receive any event notifications
Next
All solutions for Serverless Containers
© 2025 Direct Cursus Technology L.L.C.