[Yandex DataLens] Inconsistent aggregation among operands
ERR.DS_API.FORMULA.VALIDATION.AGG.INCONSISTENT
This occurs when a single function (or a single operator) uses an aggregated and an unaggregated expression as arguments (operands).
When computing an aggregate value, a large set of strings is converted into a single value. Special aggregate functions are used for this. The most common functions are SUM, MIN, MAX, AVG, and COUNT. The aggregate functions calculate and return one resulting value for all strings of the query. If data grouping is used, values are calculated and returned separately for each one of the groups the query result is broken down into.
In DataLens, you cannot use aggregated and non-aggregated values in the same expression. You cannot use measures (blue in the dataset and wizard) and dimensions (green in the dataset and wizard) in the same expression.
Another error is likely to occur when the window function in the WITHIN section has fields that are neither an aggregation nor a dimension in the chart.
How to fix the error
To fix this error:
- Apply aggregation to all fields in the expression.
- Break the expression down into individual measures.
- Use LOD expressions to create nested aggregations as well as aggregations over all data or groups that are different from the chart-level grouping.
Examples
Example 1. Dividing a field by an aggregated sum
- Incorrect formula:
[Sales] / SUM([Sales]). - Issue: The field
Salesis non-aggregated, whileSUM([Sales])is aggregated. TheSalesfield is neither an aggregation nor a dimension within the group. It does not have a fixed value and may vary from string to string. Therefore, it is impossible to determine what specific value of theSalesfield needs to be selected to calculate the[Sales] / SUM([Sales])expression. It is impossible to compute this expression. - Solution: Use aggregation for the
Salesfield. In which case this field will become a measure. - Correct formula:
AVG([Sales]) / SUM([Sales]).
Scenario with dividing a field by an aggregated sum
For better visualization, follow this scenario:
-
Create a connection to the demo database and a dataset based on the
MS_SalesFactstable. -
Create a Table chart based on the dataset.
-
Drag the
Salesfield fromDimensionsto Columns. No aggregation function is applied to the field; it is a dimension. In the interface, dimensions are displayed in green. They set grouping in charts. -
Create a field named
SUM([Sales])with theSUM([Sales])formula and drag it fromDimensionsinto the Columns section. In the field's formula, an aggregation function is applied to the numerical value; it is a measure. In the interface, measures are displayed in blue. The aggregation function calculates and returns a single resulting value for each one of the groups the query result is broken down into, i.e., oneSUM([Sales])value is calculated for eachSalesgroup. -
Create a field named
[Sales]/SUM([Sales])with the[Sales]/SUM([Sales])formula and drag it fromDimensionsinto the Columns section. It is a measure as well. TheSalesdimension is used to build the chart and sets grouping for the calculation of measures. Therefore, to calculate each[Sales]/SUM([Sales])value, one particularSalesvalue is used, and no error occurs.Aggregation in a chart with grouping
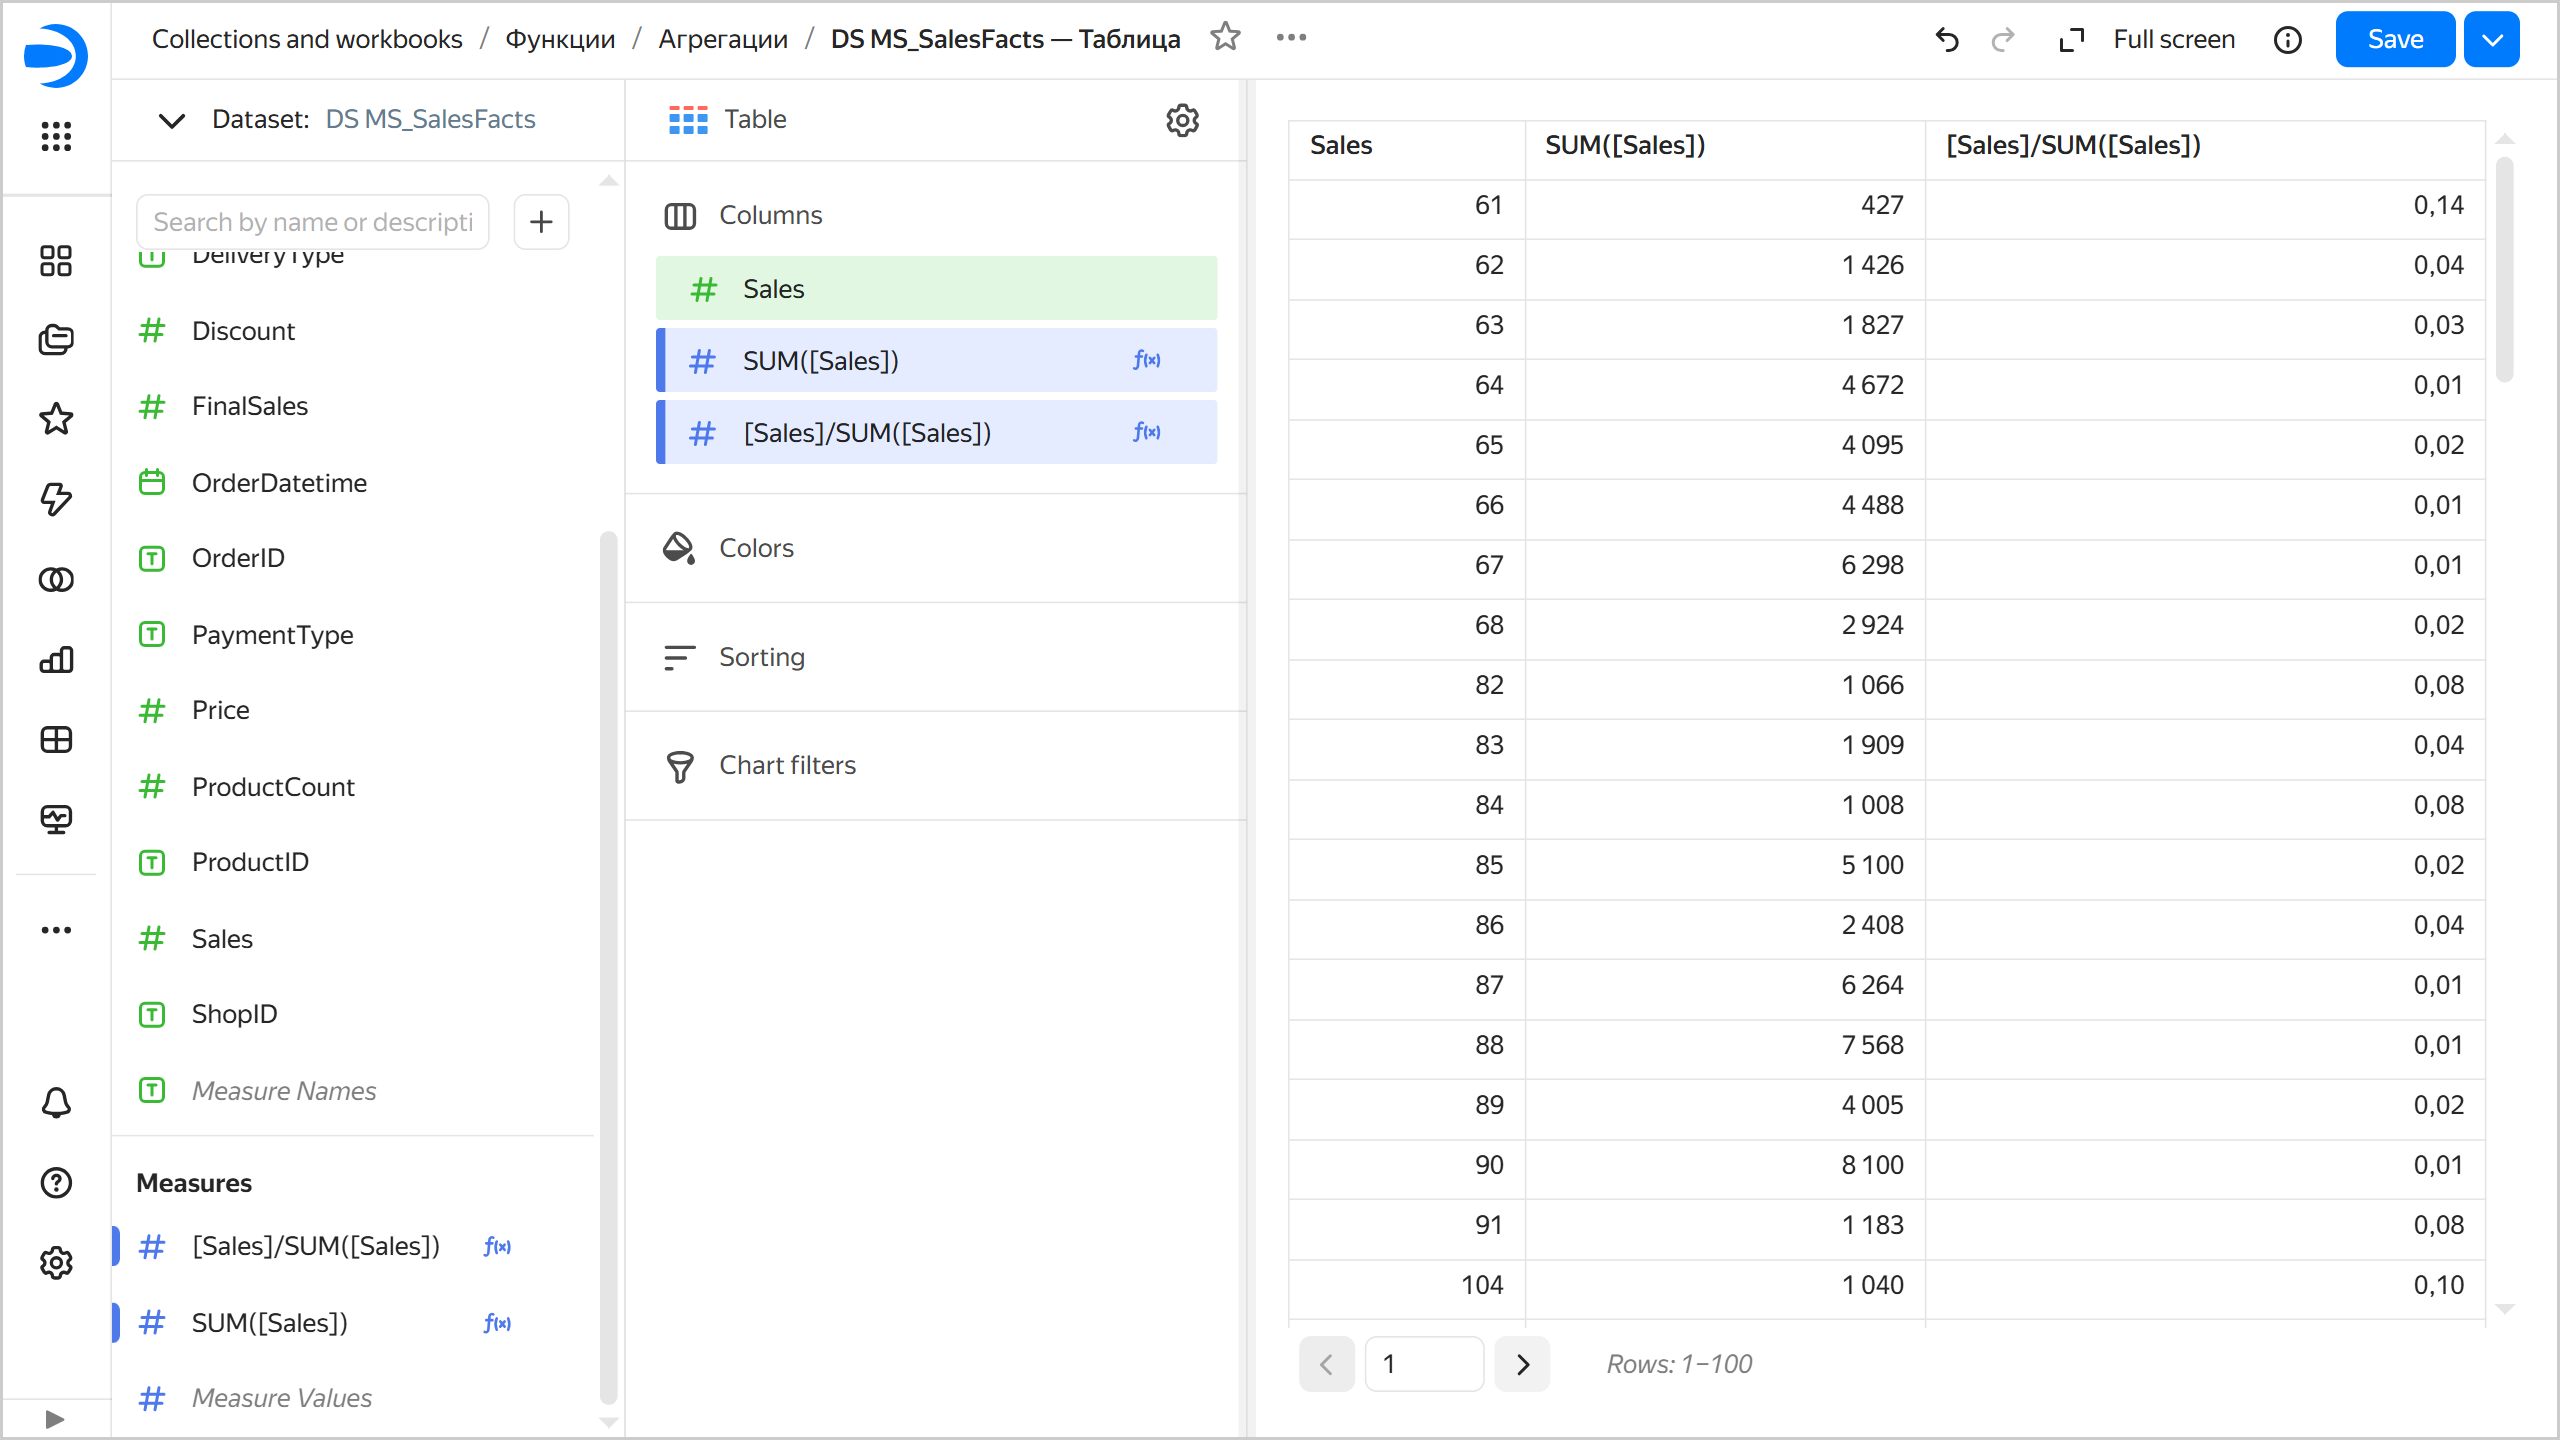
-
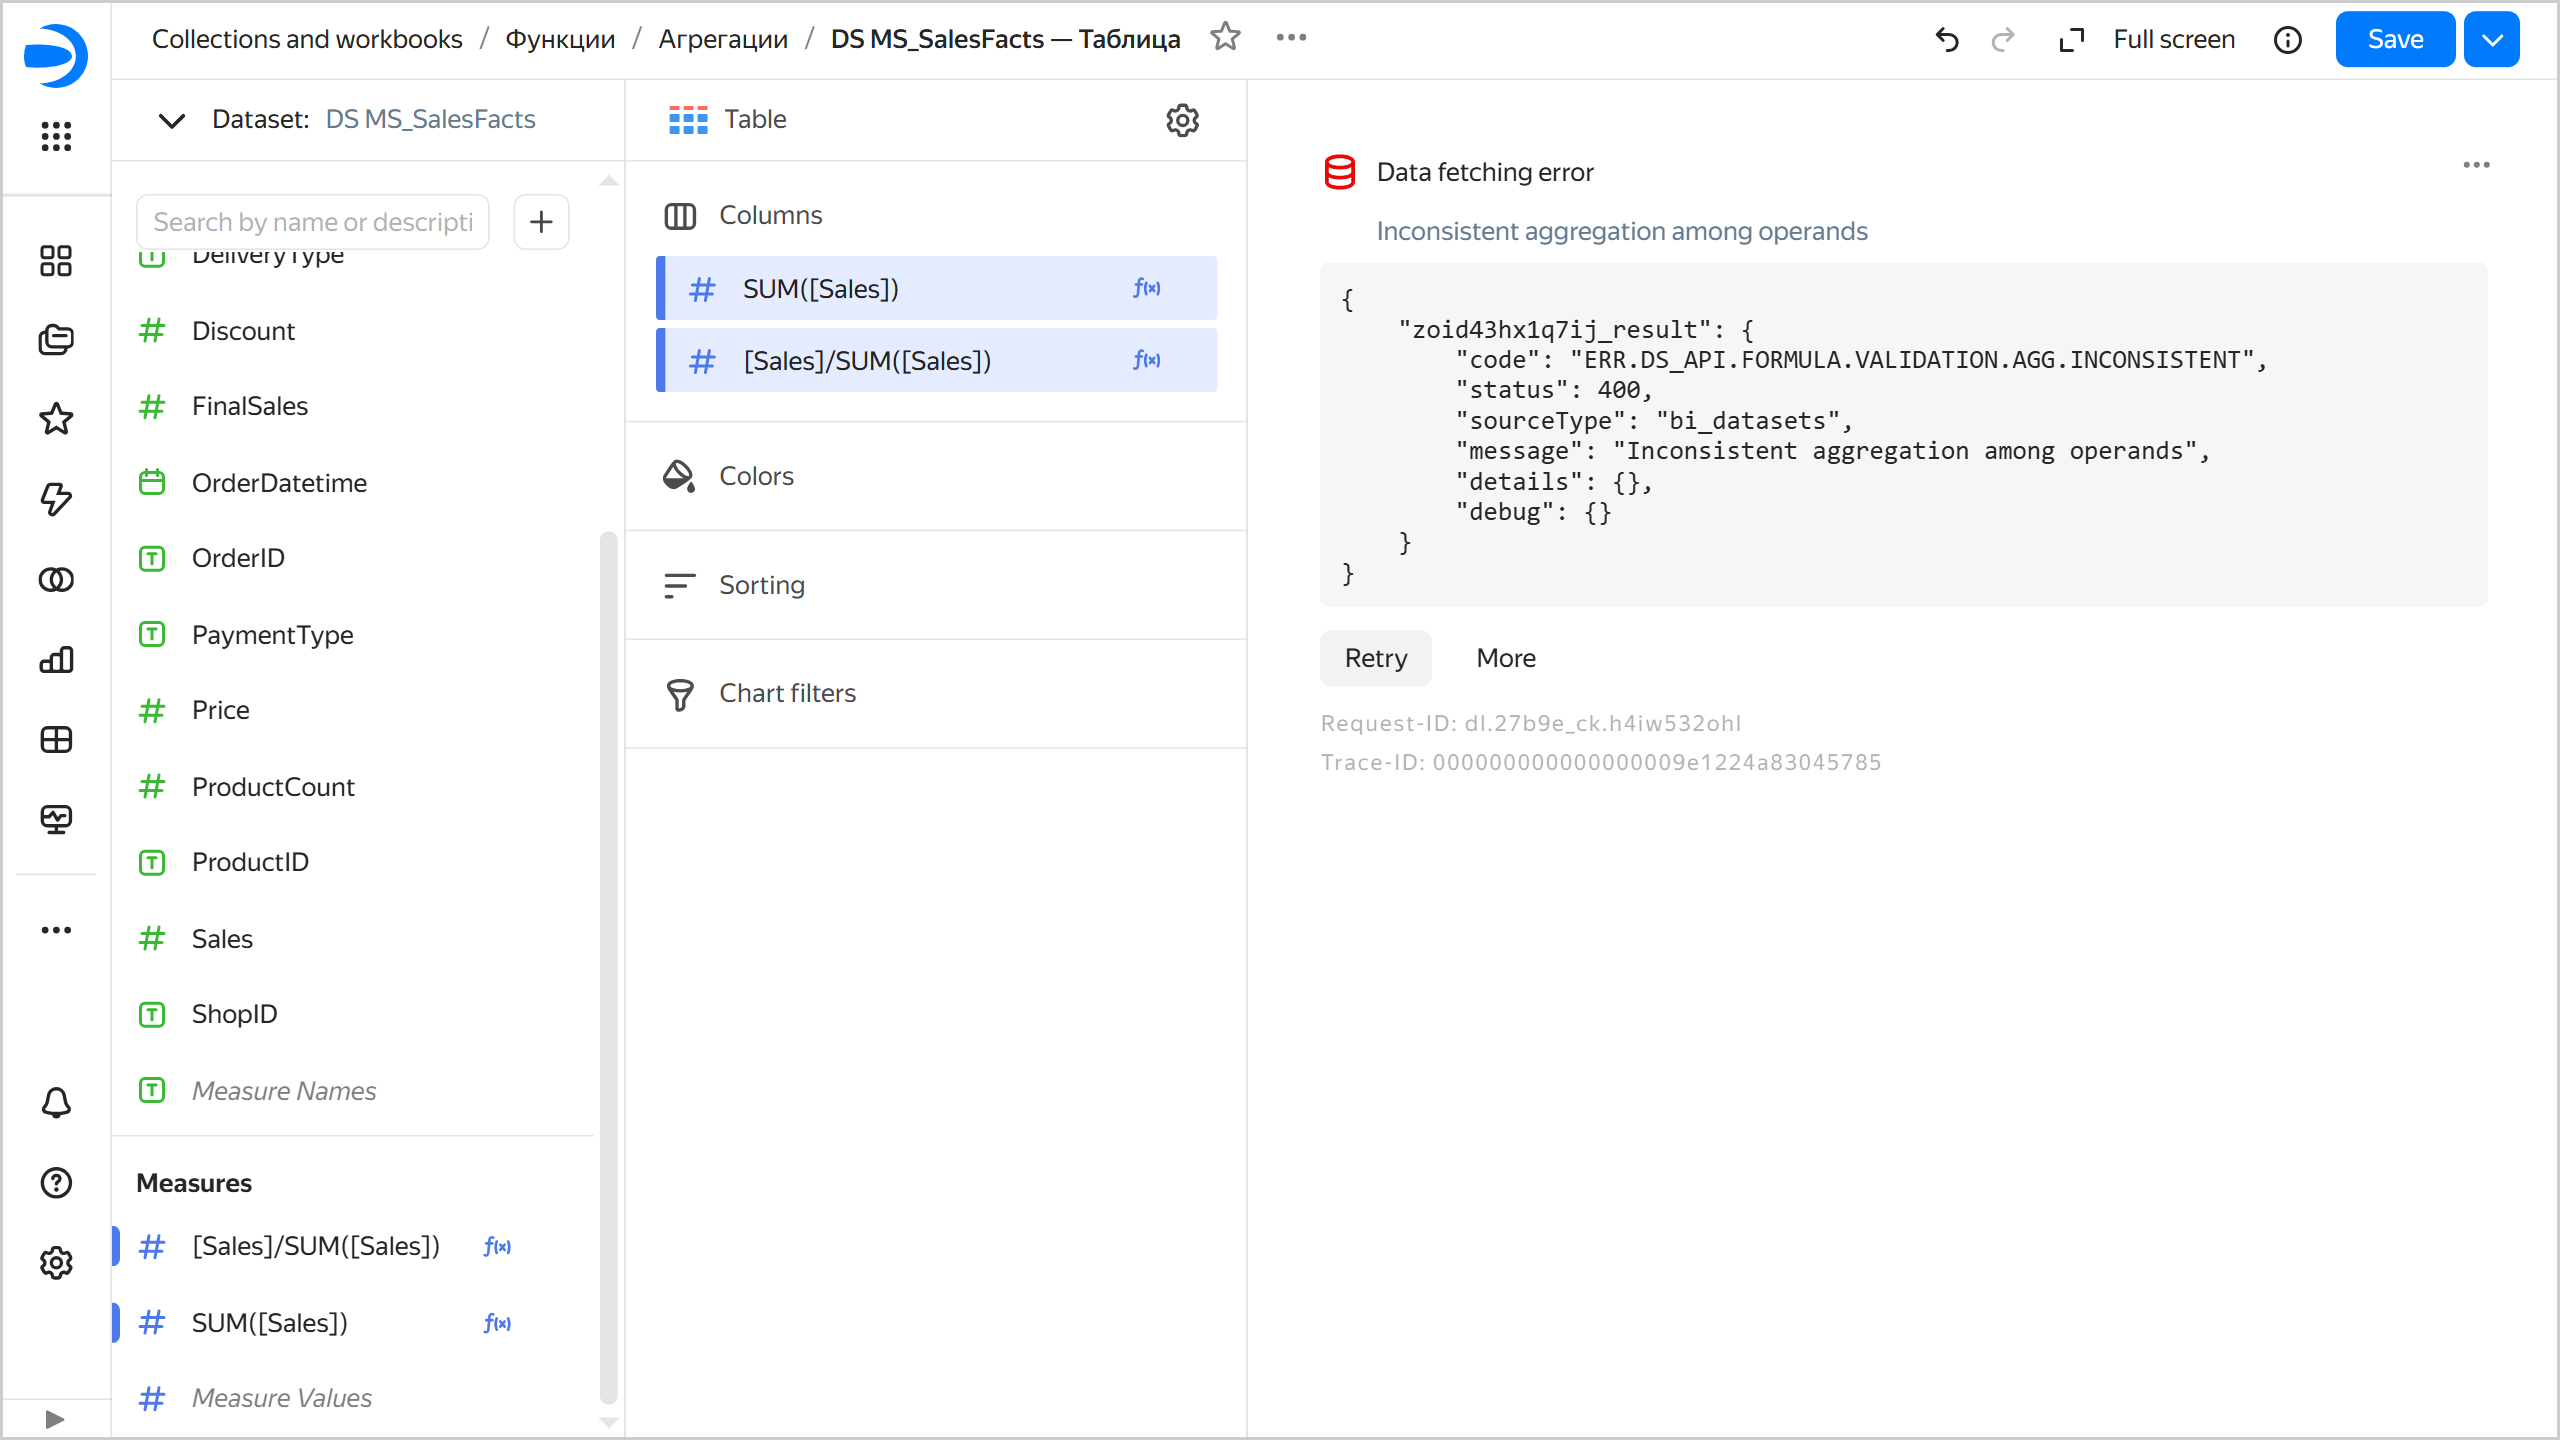
Delete the
Salesmeasure from the Columns section. Now there is no dimension to define the chart's grouping, and the aggregate functions calculate and return one resulting value for all strings of the query. However, the[Sales]/SUM([Sales])formula contains theSalesfield without aggregation, which is not used to build the chart and has no fixed value. Therefore, it is unclear whichSalesfield value to use to calculate the expression. This results in an error.Aggregation with an error
-
Drag the
PaymentTypefield fromDimensionsto the Columns section. Now, the chart's grouping is defined by thePaymentTypedimension, and the aggregation function calculates and returns one resulting value for each group. However, within eachPaymentTypegroup, there are many records with differentSalesvalues, so it is unclear whichSalesfield value to use to calculate the[Sales] / SUM([Sales])expression. This also results in an error. -
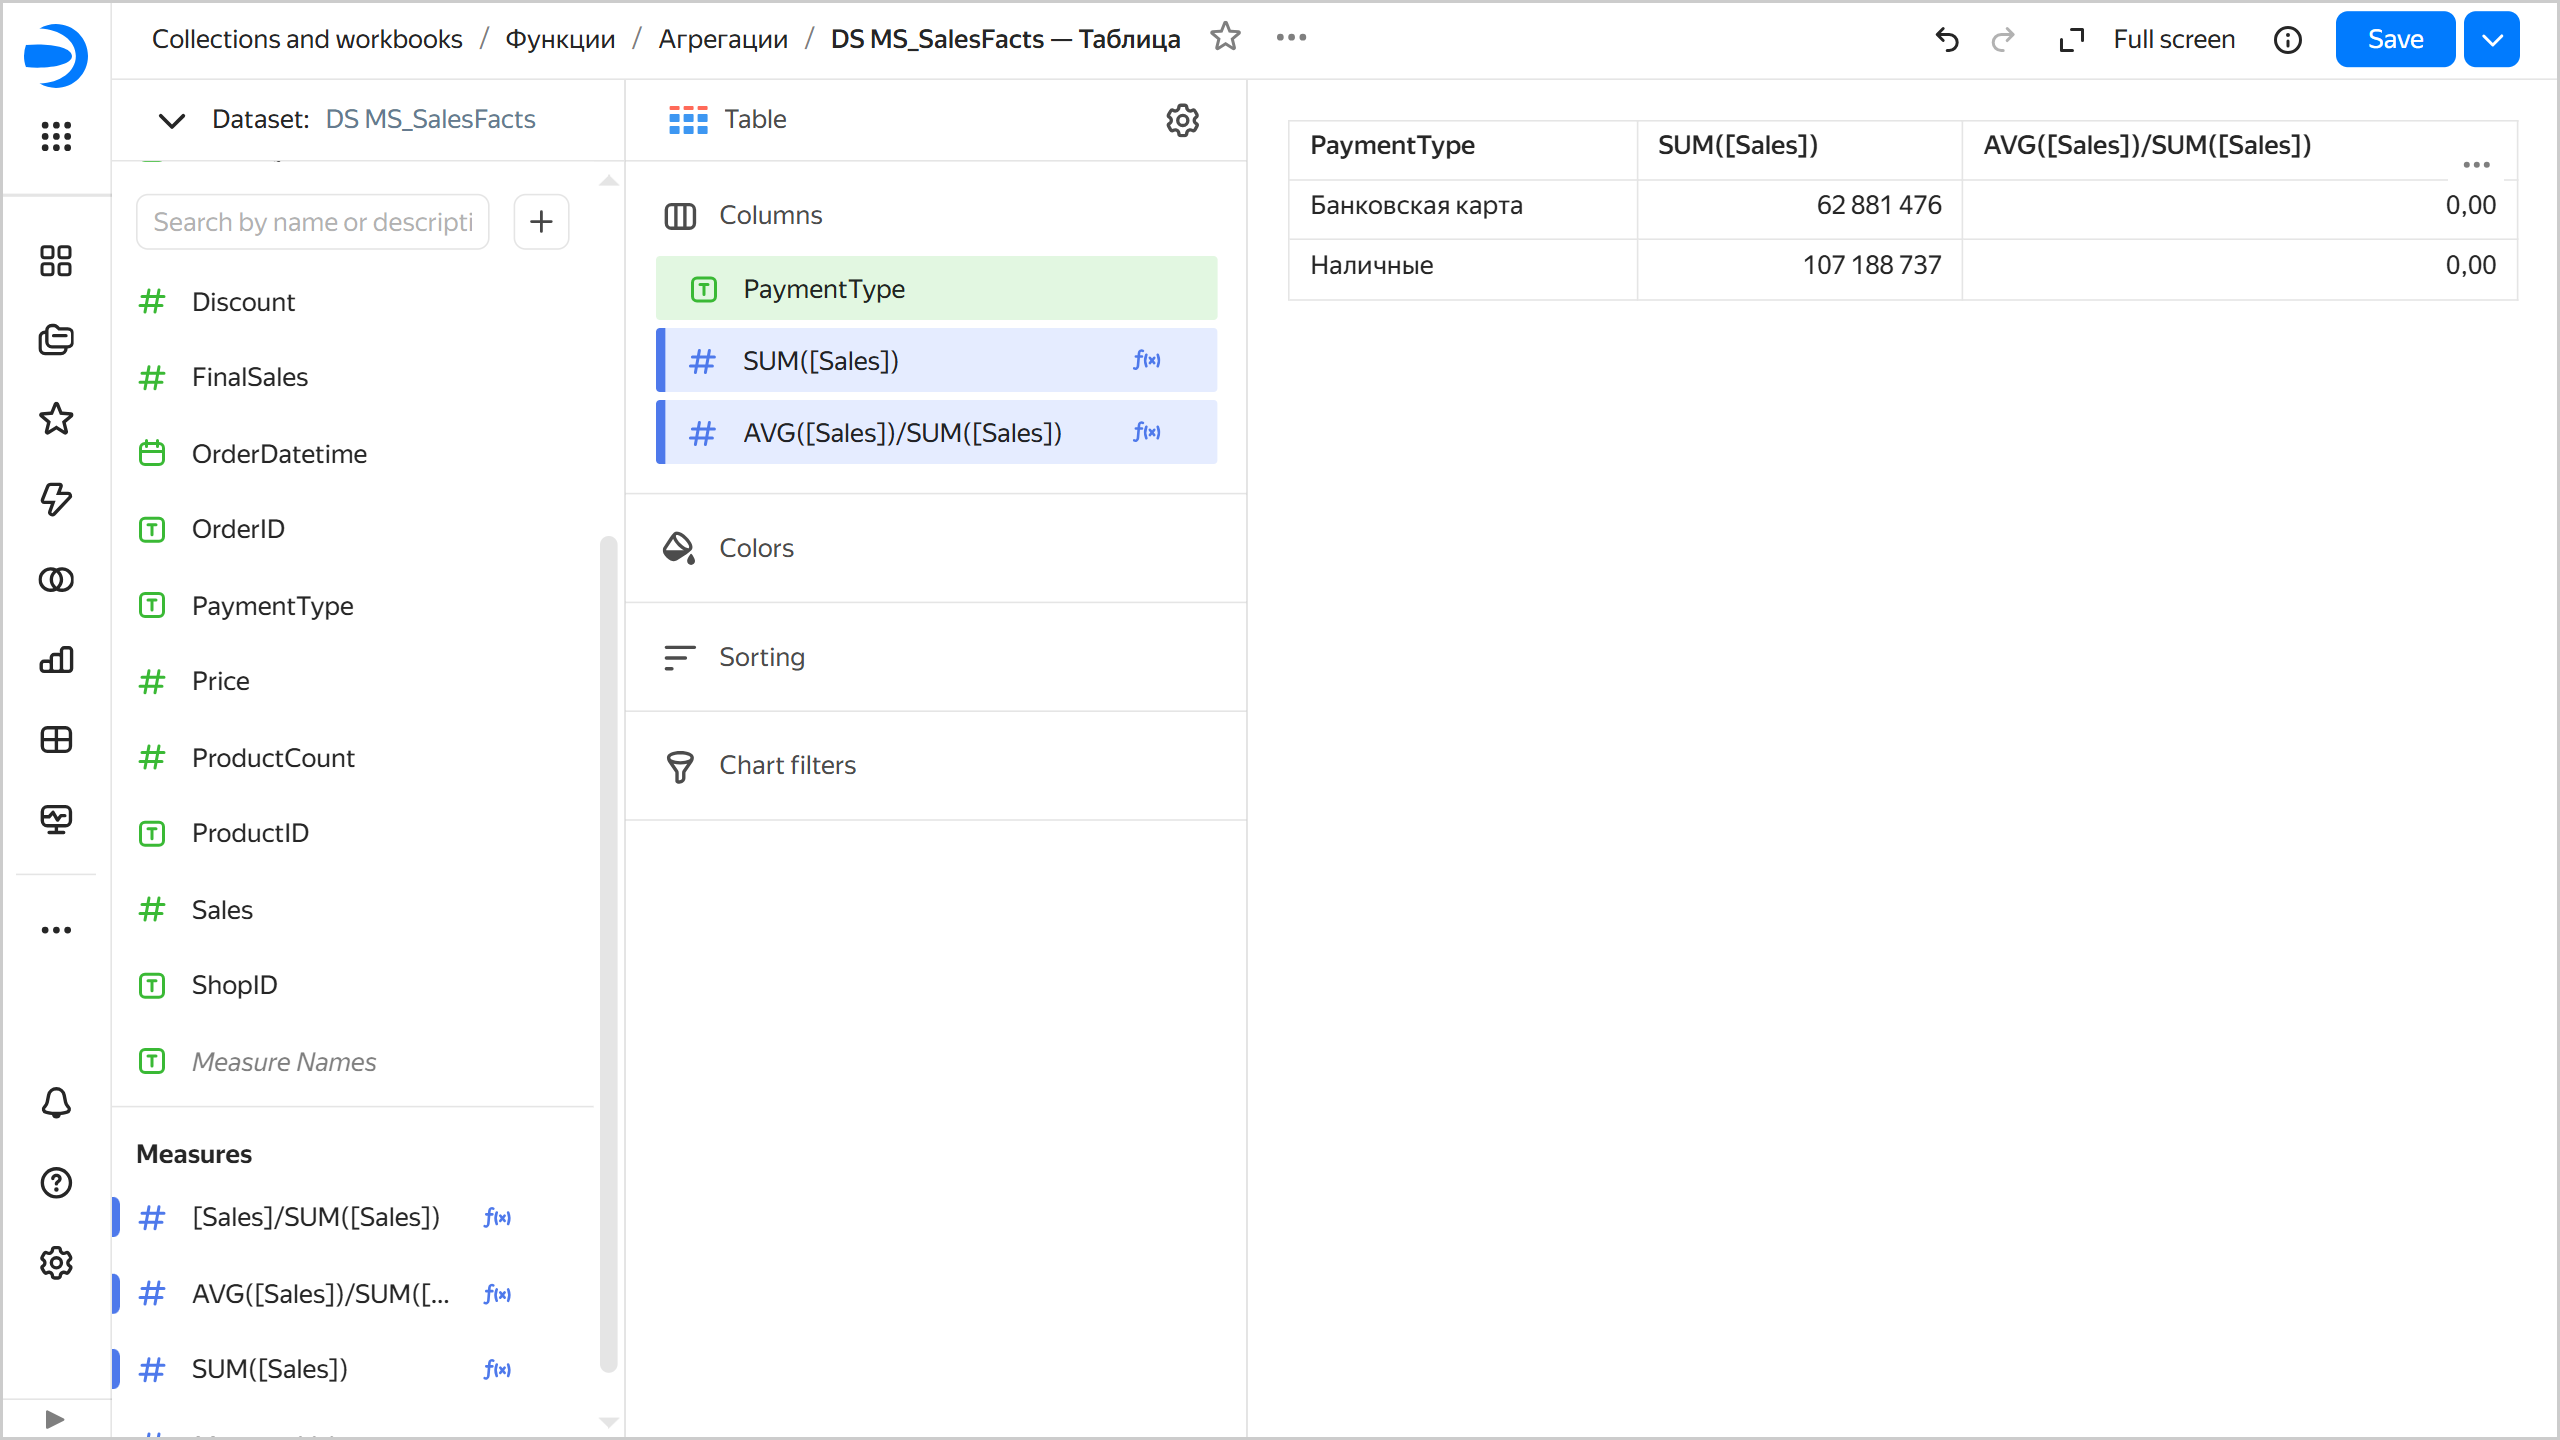
Create a field named
AVG([Sales])/SUM([Sales])with theAVG([Sales])/SUM([Sales])formula and use it to replace the[Sales]/SUM([Sales])measure in the Columns section. Now, for eachPaymentTypegroup, the resultingAVG([Sales])andSUM([Sales])values are calculated, which are used to calculate theAVG([Sales])/SUM([Sales])expression. No error occurs.Aggregation without an error
Example 2. Subtracting a non-aggregated field from an aggregated one
- Incorrect formula:
[Total Sales] - [Profit]. - Issue: The
Total Salesfield is aggregated, whereasProfitis non-aggregated.[Total Sales]is the result of combining all the group's records, whereas the[Profit]expression has a different value for each record, and it is not clear for the group which value to use. An expression like this does not make sense and is impossible to calculate. - Solution: Apply aggregation to the
Profitfield. - Correct formula:
[Total Sales] - SUM([Profit]).