You can think of a light curve as being similar to an electrocardiogram (ECG), except instead of tracking the heart’s electrical activity, it shows how the brightness of a celestial object evolves over time. However, unlike doctors who can control the conditions under which they monitor patients, astronomers do not always run their observations under consistent conditions or at regular intervals, which complicates data analysis.

How machine learning helps researchers study red dwarf flares
This is how Yandex Cloud helped astrophysicists to automate data analysis and create the largest catalog of dwarf flares. Now the scientists will be able to better understand the nature of solar and star flares.
SNAD is an international group of researchers dedicated to detecting anomalies in astronomical catalogs and databases. This work involved experts from the Sternberg Astronomical Institute of Lomonosov Moscow State University (MSU), the Faculty of Space Research at MSU, and the Carnegie Mellon University.
Light curves are graphs plotting how a star’s brightness changes over time. They allow astronomers to observe various phenomena, such as flares, planetary transits, and stellar pulsations, helping scientists study the behavior of stars and exoplanets.
A sequence of stages for data to pass, from collection to final results. It typically includes data pre-processing, model training, evaluation, and testing. A well-designed pipeline automates and standardizes the workflow, making it more structured and easier to reproduce.
Monitoring solar activity helps predict geomagnetic storms on Earth and their impact on electronics and communication systems. It also reduces the risk of satellite malfunctions.
In this effort, studying flares on red dwarfs (small cool stars with physical properties similar to the Sun) helps scientists better understand flare dynamics and mathematically simulate processes that are similar to solar eruptions. However, analyzing these flares on red dwarfs requires processing enormous amounts of data, which is a task one cannot perform manually. This challenge called for automation, giving rise to the joint project between SNAD and Yandex Cloud.
Backed by Yandex Social Tech, an international team of astrophysicists and data analysts from SNAD
A light curve helps astronomers understand how and why a star’s brightness changes over time. These variations can indicate processes occurring on or around the star, such as flares, eclipses, or pulsations. By compiling numerous measurements, scientists create a graph that plots how the object’s brightness evolves, offering valuable insights into its behavior.
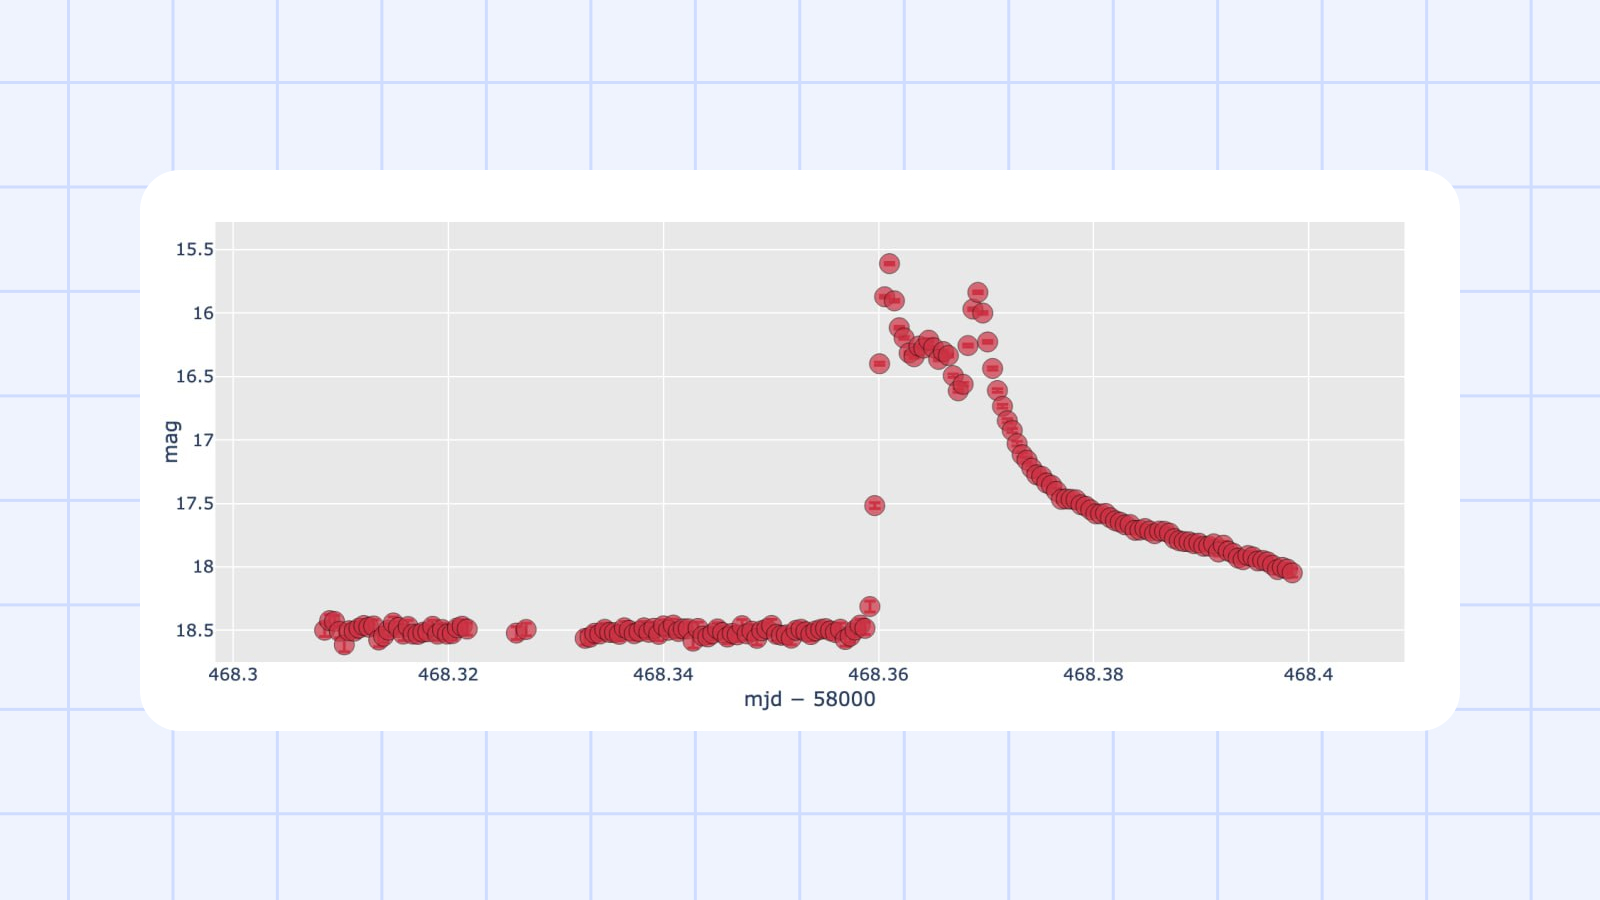
Zwicky Transient Facility is a wide-field astronomical survey designed to detect transient phenomena, such as supernova explosions, asteroids, and comets. It uses a powerful camera mounted on the Samuel Oschin Telescope at Palomar Observatory.
Transiting Exoplanet Survey Satellite is a NASA space observatory dedicated to discovering exoplanets using the transit method.
A machine learning algorithm based on an ensemble of decision trees, which builds multiple trees trained on different subsets of data and makes final predictions through majority voting.
A gradient boosting framework based on decision trees, specifically optimized for handling categorical features without requiring prior coding.
This research explored data from major astronomical surveys provided by the ZTF and TESS teams: their telescopes continuously monitor the sky, recording brightness variations across billions of astronomical objects. With machine learning models, specifically Random Forest and CatBoost, researchers classified light curves to determine whether observed brightness changes were caused by stellar flares.
The SNAD team analyzed 100 million light curves in search of flares occurring on red dwarf stars. Developing the machine learning algorithms took about a year, while the final data processing pipeline required several days of computing power to complete. Manually reviewing such a vast number of light curves for classification would have taken years.
The finalized ML model, trained on approximately one million time series (sequences of brightness measurements showing how a star’s light changes over time), helped scientists from SNAD identify 1,196 stellar flares on red dwarfs, creating the largest catalog of such events based on ground-based observations.
These are planets located outside our Solar System that orbit stars other than the Sun. Studying them helps scientists understand how unique our planetary system is and whether conditions suitable for life might exist elsewhere. Researchers estimate that our galaxy could host more than 100 billion exoplanets, based on data from such telescopes as Kepler.
With this new flare catalog, scientists can deeper analyze the dynamics of stellar flares and gain better insight into the physics of stellar activity and its consequences
Why studying flares on red dwarfs matters
Red dwarfs are small, relatively cool stars that make up the majority of stars in our Milky Way galaxy. Scientists estimate their numbers to be between 160 and 320 billion
Because of their dimness, red dwarfs are hardly observable with the naked eye. Even Proxima Centauri, the closest star to the Sun and also a red dwarf, cannot be seen without a telescope from most locations on Earth. However, these stars are known for producing bright and powerful flares. These eruptions are caused by frequent magnetic reconnection events, when magnetic energy rapidly turns into kinetic energy. The frequency of flares depends on the star’s age.
Red dwarfs have surface temperatures ranging from about 2,700 to 3,500 K, and their luminosity ranges from 1/10 to 1/1000 that of the Sun.
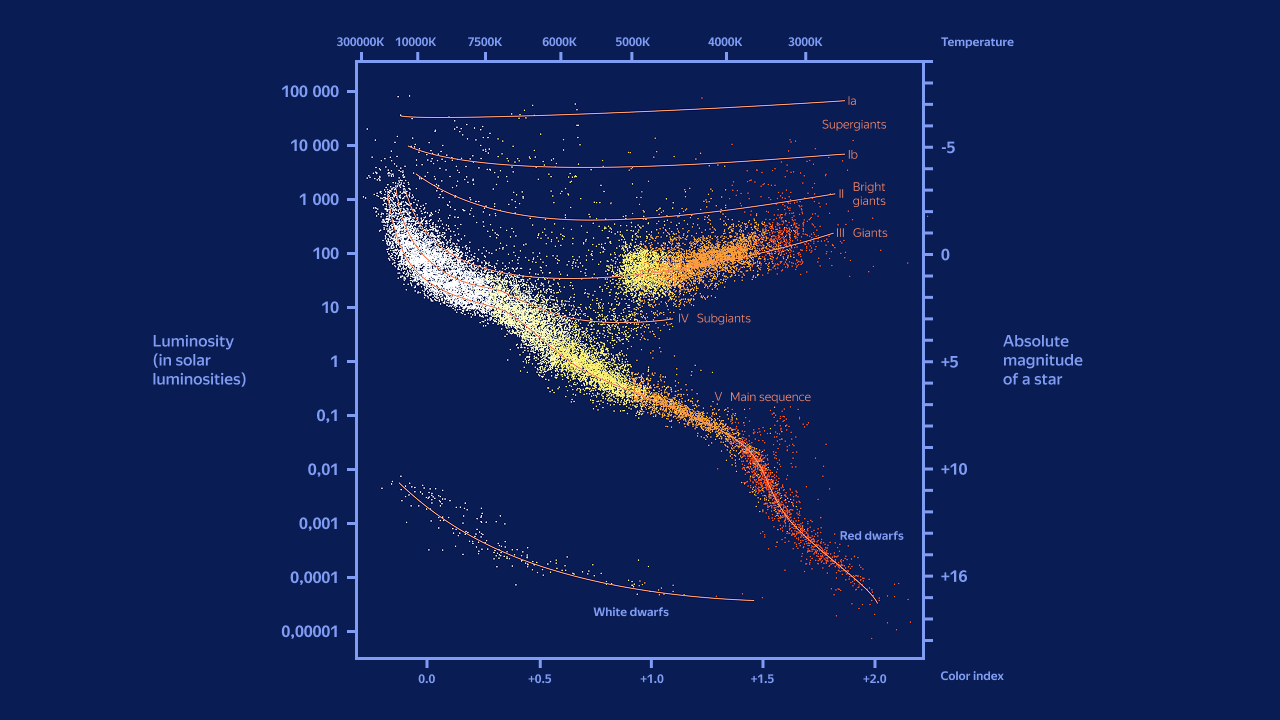
The Hertzsprung–Russell diagram below illustrates how stars are distributed based on their luminosity and temperature. Red dwarfs appear in the lower-right corner of the diagram, as they have low temperatures and low luminosity compared to more massive stars. This diagram provides a visual way to understand the differences between various types of stars.
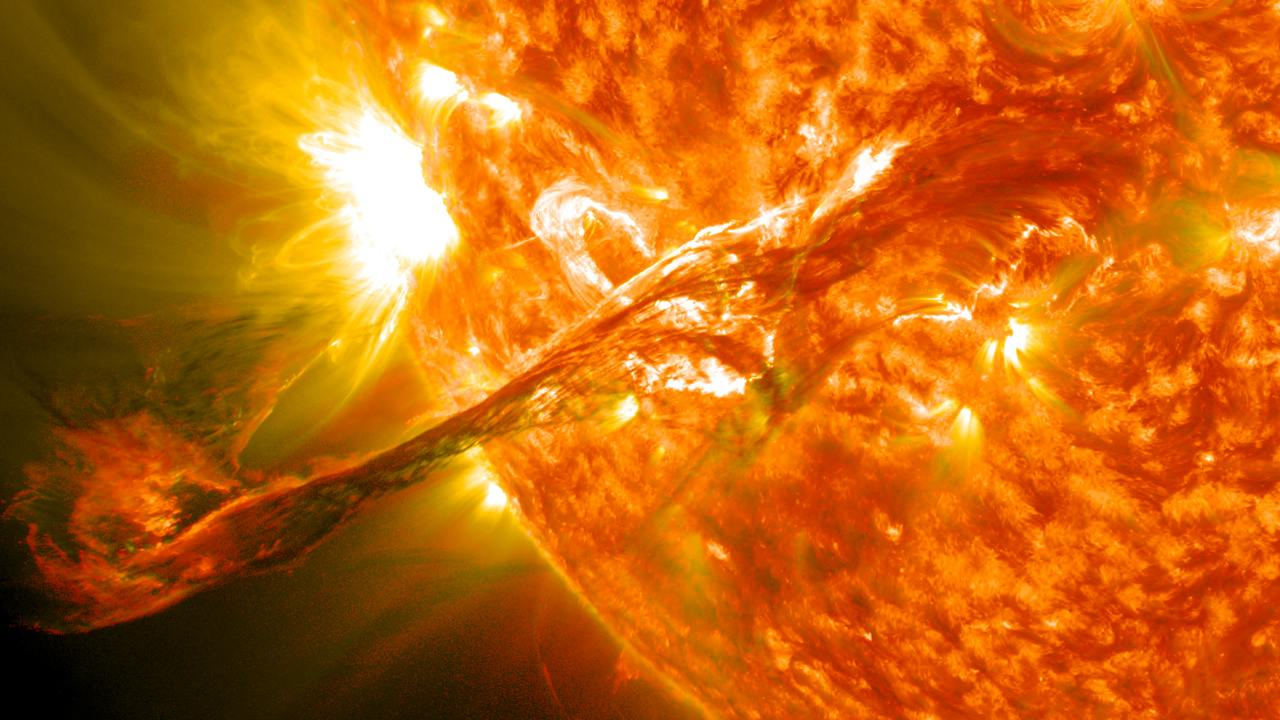
A solar flare on August 31, 2012, captured by NASA’s Solar Dynamics Observatory (SDO), a space observatory launched in 2010 to study the Sun. Source: Flickr
Solar activity affects Earth’s magnetic field and can trigger geomagnetic storms.
Well-known cases of sun flare impacts
In 1989, a powerful solar flare caused a severe magnetic storm
Flares from red dwarfs hardly ever reach Earth, but they do have a strong impact on nearby exoplanets. These eruptions can strip away planetary atmospheres, posing serious challenges to the development of life. Despite this, astrophysicists often find habitable zones around red dwarfs, which are regions where the conditions might support life. These zones can form over time thanks to the extremely long lifespans of red dwarfs, which can last tens of billions of years. That’s why red dwarfs are considered key targets in the search for exoplanets and extraterrestrial life.
Their low luminosity also makes red dwarfs easier to study: the transit-related methods and direct imaging of exoplanets are most effective when dealing with these types of stars.
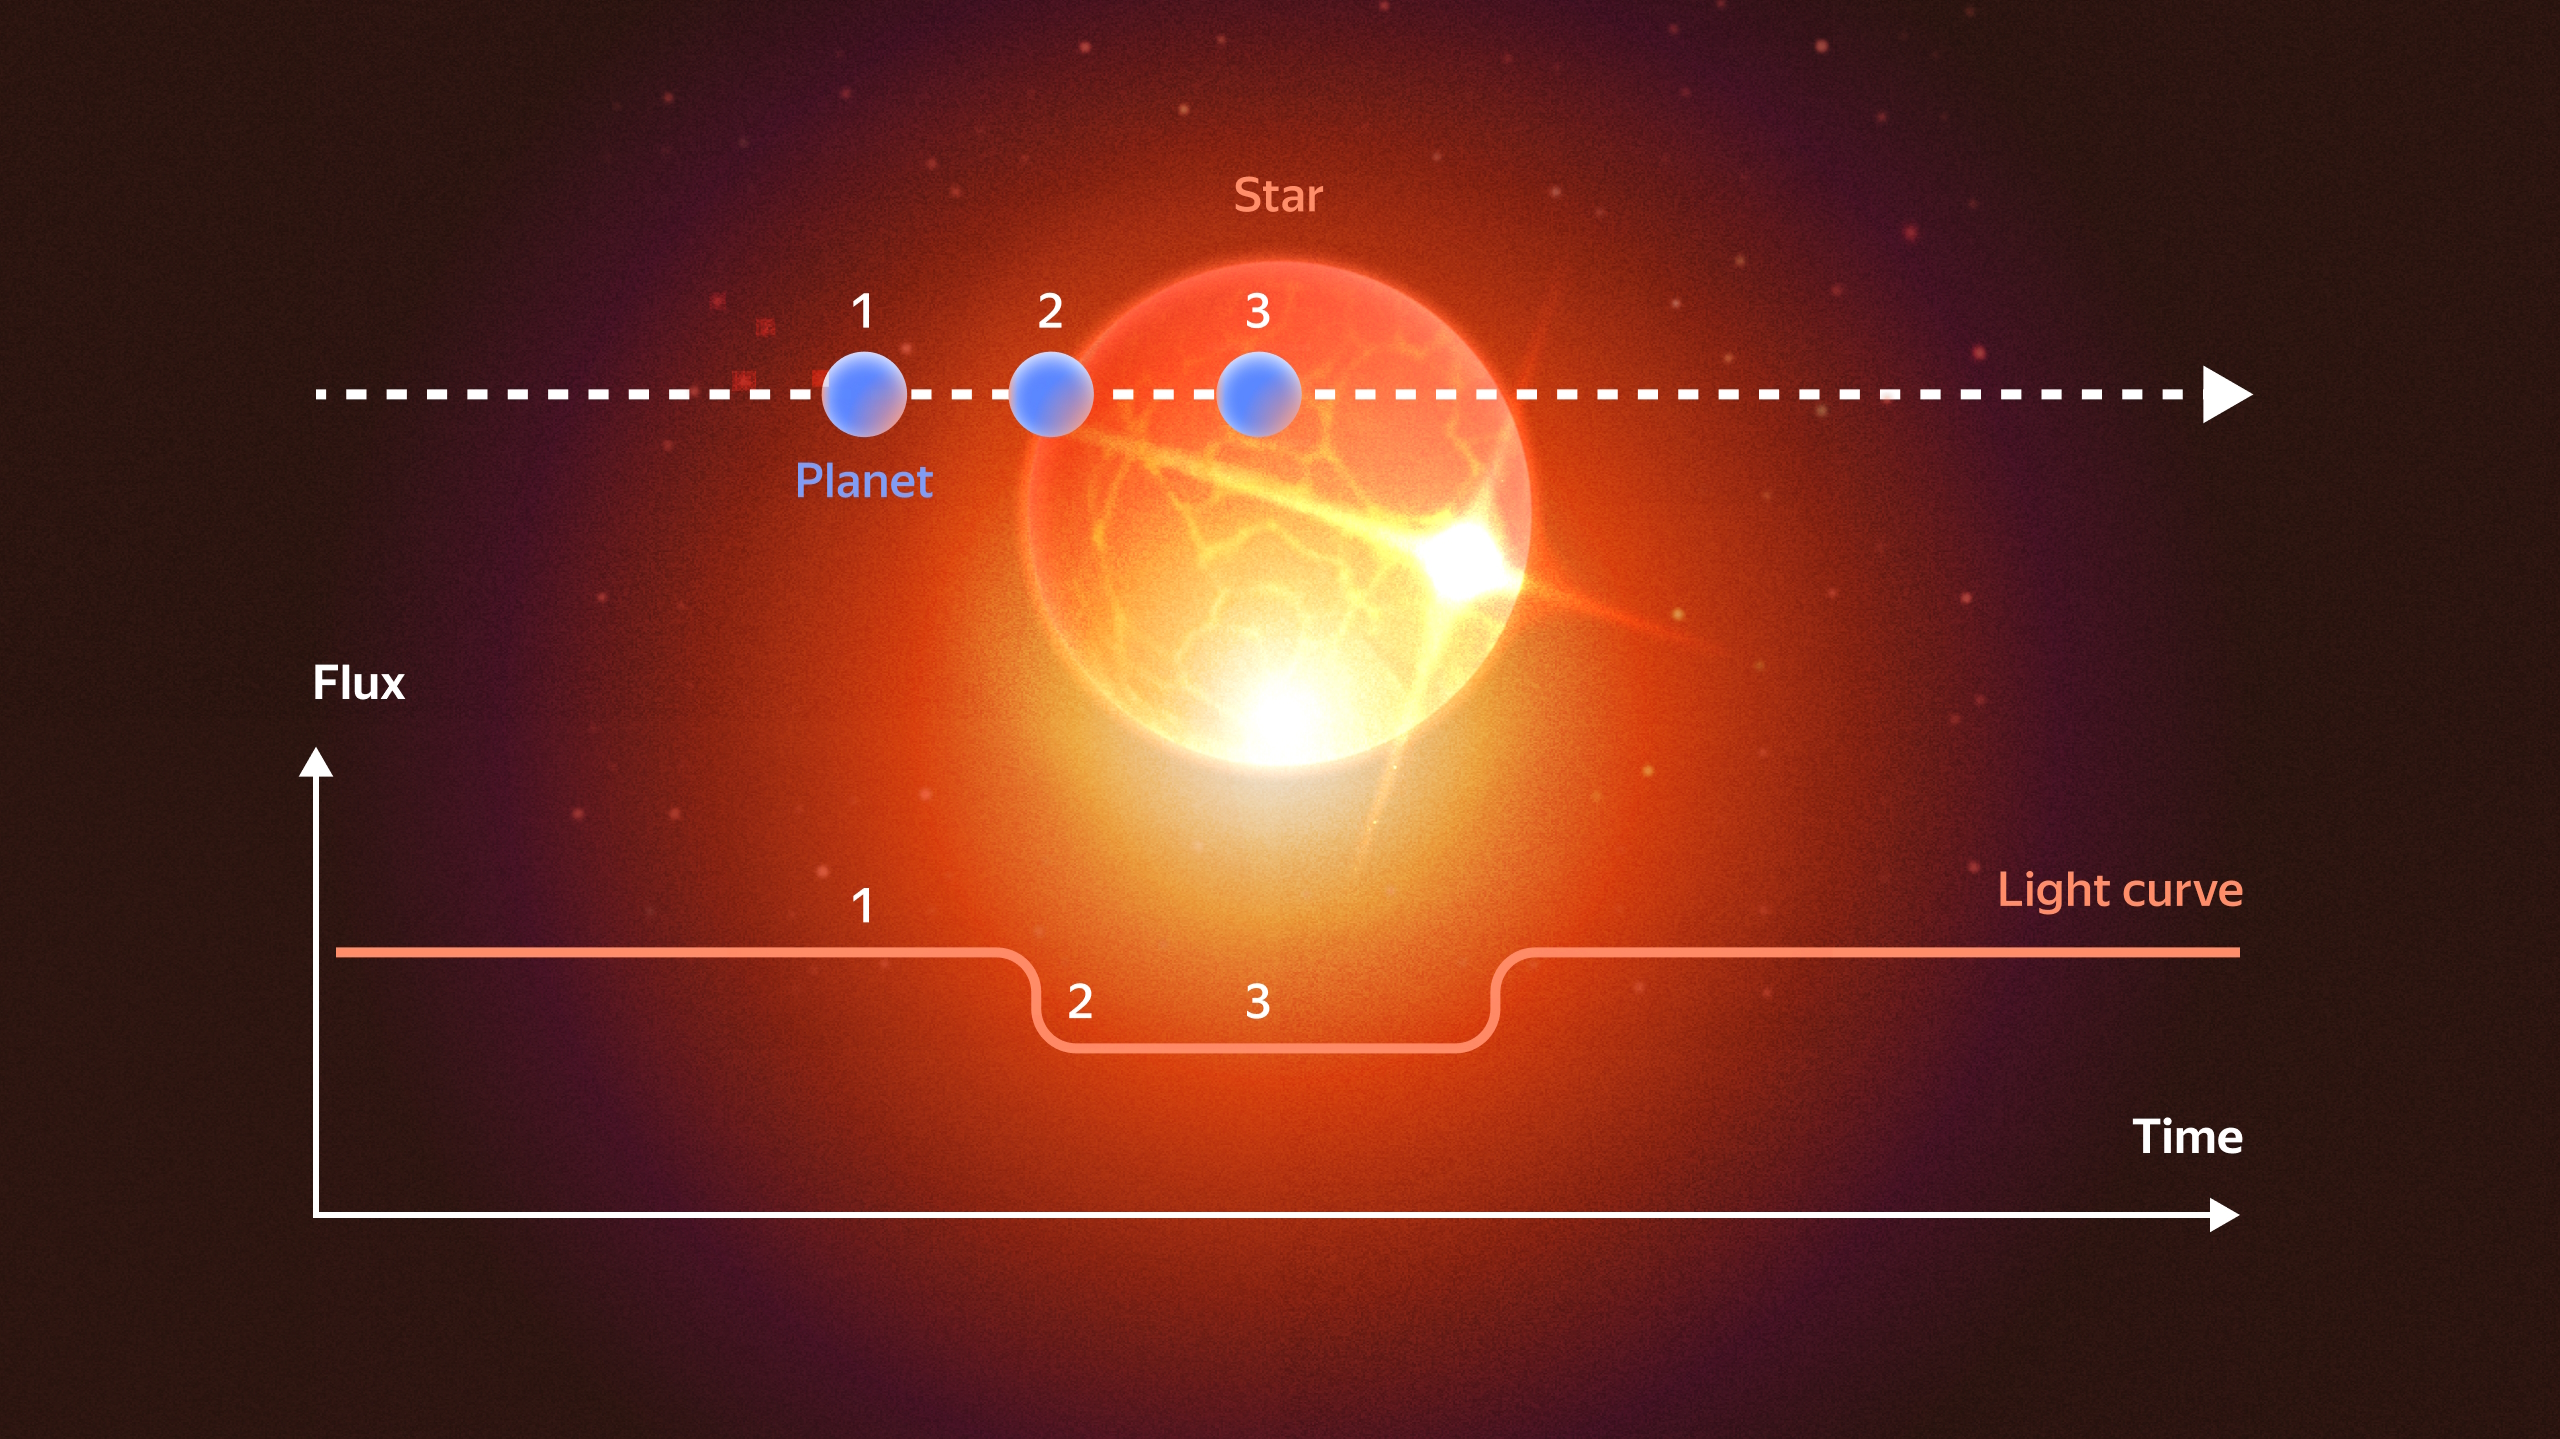
The transit method for detecting exoplanets. The top part of the image illustrates how a planet passes in front of its host star (a transit); the bottom part, the respective light curve, which graphs the star’s brightness over time. By detecting and analyzing the patterns, astronomers can confirm the presence of an exoplanet.
Some exoplanets are located in the habitable zone, the region around a star where conditions might allow for liquid water to exist. For example, in the TRAPPIST-1 system, centered around a red dwarf star, seven exoplanets orbit the star, and three of them lie within the habitable zone.
Searching for flares among billions of celestial objects: Yandex Cloud and SNAD collaboration
The project team automated the search for stellar flares using machine learning algorithms, drawing data from the ZTF astronomical survey and NASA’s TESS.
The ZTF survey, conducted using the Samuel Oschin Telescope, aims at observing fast transient events, such as supernovae, tidal disruption events, asteroids, and comets. It records brightness changes across billions of stars, storing the data as light curves. Thanks to its wide-field camera, the telescope captures about a terabyte of image data each night.
TESS, on the other hand, surveys the entire sky to detect exoplanets transiting their host stars; an approach that helps identify potentially habitable worlds. The observatory measures stellar brightness and generates vast datasets used not only for exoplanet research but also for studying stellar activity.
The SNAD team applied Random Forest and CatBoost ML algorithms to scan through years' worth of light curves collected by ZTF in search of flare signatures. Scientists then manually verify the detected events to ensure reliability.
Machine learning pipeline
It consists of multiple key stages, each essential for classifying light curves in an efficient way.
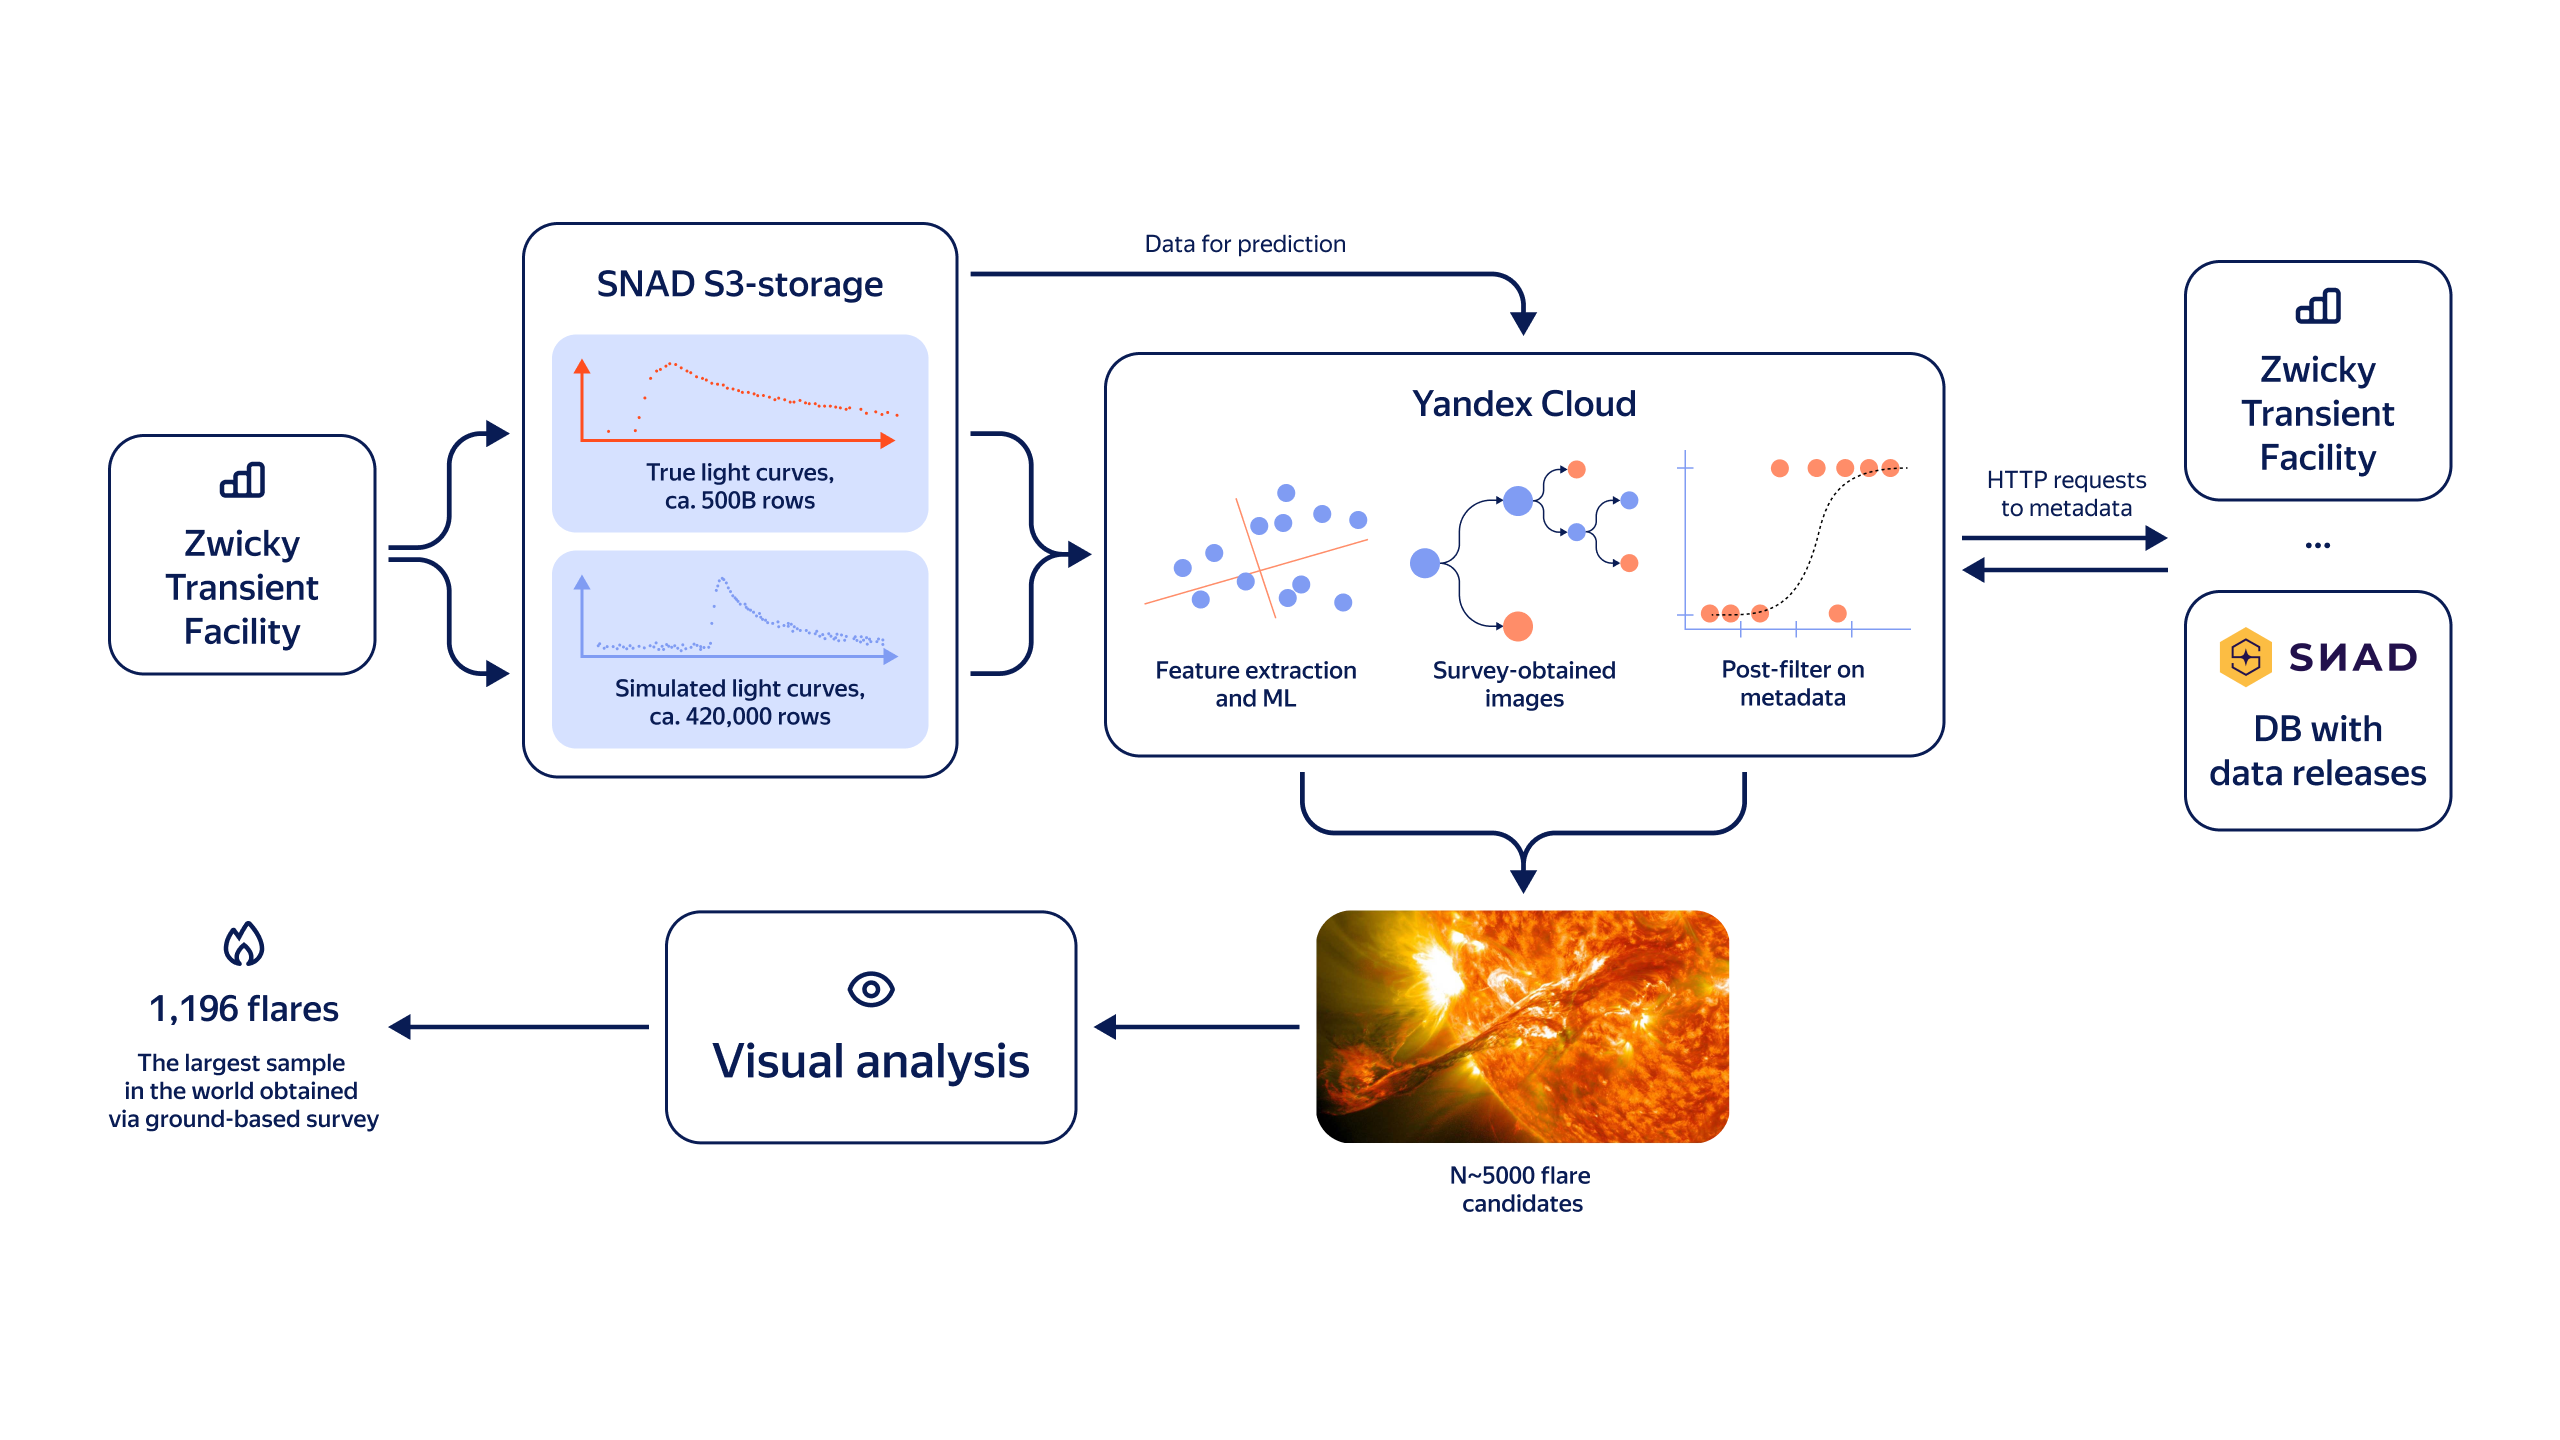
The data processing and analysis pipeline illustrates how the data from ZTF and TESS is used to generate training datasets, extract features, build models, and classify light curves; all powered by the computational capabilities of Yandex Cloud.
Stages of collecting and analyzing data from ZTF and TESS
In this context, this is about the cases where the algorithm incorrectly identifies a signal as a flare.
| Stage | Description |
|---|---|
| Data collection | ZTF scans the night sky and records the brightness of billions of celestial objects. Observations are collected regularly, depending on telescope availability and observing conditions. These measurements are then converted into light curves for further scientific analysis. |
| Data filtering | Researchers filter out high-cadence observation sequences where flares may be detected. These are the graphs used to assess stellar activity and identify potential flare events. |
| Data modeling and simulation | To train ML algorithms, scientists use data from the TESS telescope. These observations help simulate different types of flare profiles, improving detection accuracy and enabling models to better recognize flare patterns in red dwarfs. Also, simulating light curves helps overcome limitations caused by insufficient real-world training data. |
| Feature extraction | From the numerical data in the light curves, two types of features are extracted: astrophysical features, calculated using mathematical formulas, and analytical features, derived using neural networks. |
| Model training | ML algorithms, such as Random Forest and CatBoost, are trained on the light curve data. These models analyze brightness variations to automatically detect potential flares. |
| Post-filtering | To reduce false positives, there is a logistic regression model, acting as a post-processing filter. This step increases the true positive detection rate (signal conversion) by up to 40%, significantly improving the overall algorithm performance. |
| Verification | Astrophysicists manually review the detected candidate flares to confirm their authenticity, eliminating algorithmic errors. |
What results the project has yielded by now and how we see its future
The catalog of flares on red dwarfs is valuable for astrophysicists, since it can be used to:
-
Test scientific hypotheses about how flares originate on red dwarfs and how they affect exoplanets.
-
Develop new predictive models that can forecast flare occurrences on red dwarfs and other types of stars.
Looking ahead, the SNAD team expects to expand the project by studying other types of stars, continuously refining the data processing pipeline to make it faster and more accurate in analyzing stellar flares and other transient astronomical phenomena.
A key ongoing challenge is enhancing data analysis workflows with advanced ML techniques. By doing so, the researchers aim to open new frontiers in space exploration, which potentially brings us closer to detecting signs of life beyond Earth.
Throughout implementing the project, the team was backed by the Center for Technologies and Society.
In projects related to science and education, healthcare, environment, and cultural initiatives, Yandex Cloud acts as a technology partner. The YC team dives into a project to boost its implementation and development: particularly, the team assesses the project feasibility, develops its IT architecture, provides free access to technology stack and expert advice, and also offers marketing and PR support. To submit an application for partnership with Yandex Cloud, visit the Center for Technologies and Society.
