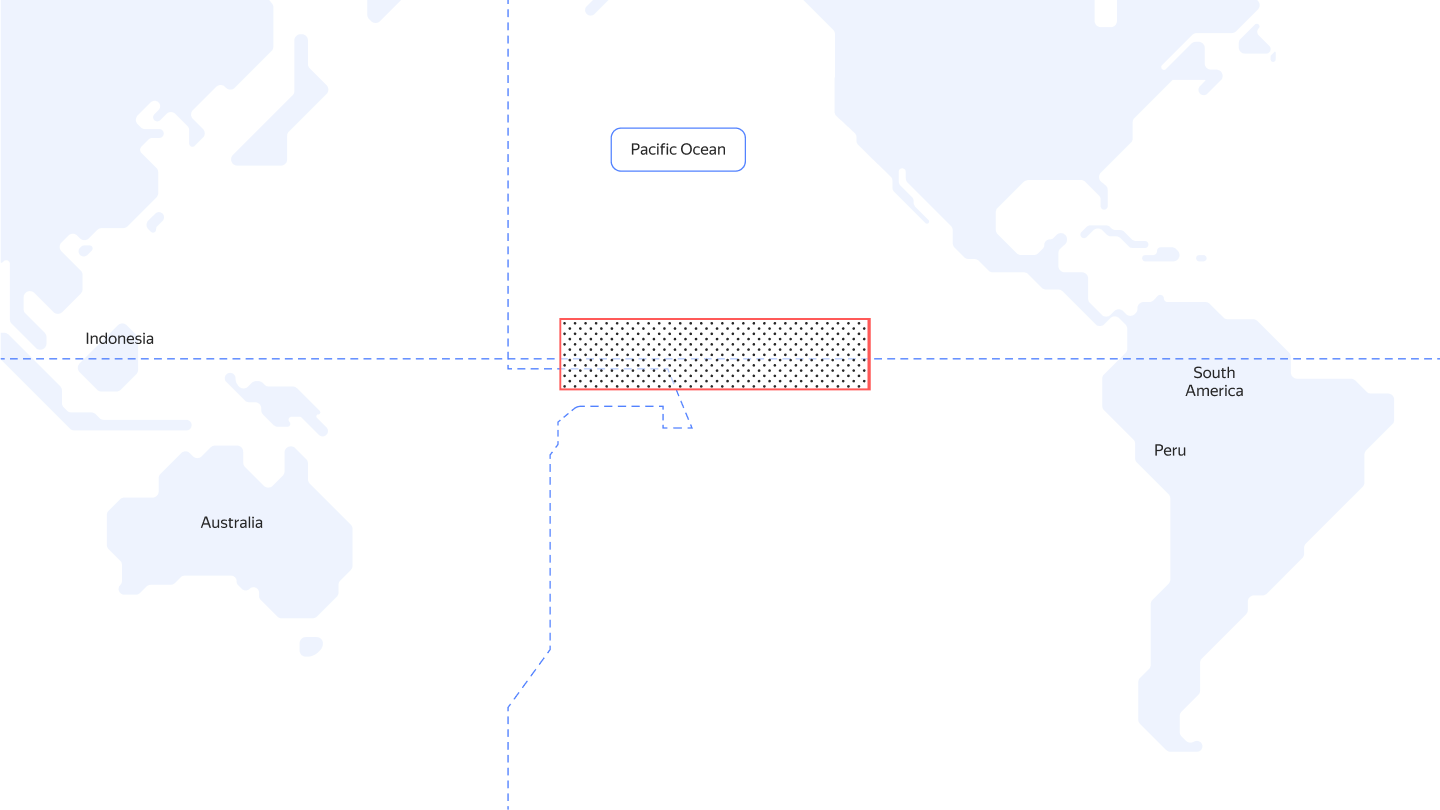
The region where El Niño occurs

What does El Niño lead to and how Yandex Cloud tools help predict it
Find out about the technologies used to increase the forecast period for natural anomalies in the Pacific Ocean, and how scientists from the Higher School of Economics and the Yandex School of Data Analysis built a model that predicts El Niño.
“El Niño” translates as “boy” or “child” from Spanish. This is how Peruvian fishermen, and then climatologists, referred to a natural phenomenon — an abnormal increase in water temperature in the center of the Pacific Ocean. The scientific name for the phenomenon is the southern oscillation. Nikita Gushchin, a research engineer and graduate of the Yandex School of Data Analysis, explains why it’s important to predict El Niño and why even a neural network cannot get beyond the range of a year and a half.
Why is the ocean warming?
Under normal conditions, the current carries cold water along the western coast of the lower part of South America. Trade winds (wind currents) drive the heated surface layer away to the western Pacific Ocean. This is how cold waters accumulate in the east, and warm waters — in the west. As a result, off the coast of Peru, the water warms up to 22-24° C, and off the coast of Australia and Indonesia, temperatures can reach 30° C.

During the El Niño period, the flow of warm waters, on the contrary, goes to the Peruvian shores, while cold oceanic waters rise more slowly. The trade winds also weaken, and surface waters warm over a larger area of the Pacific Ocean as a result.
The drastic warming of the water was first noticed in the early twentieth century by fishermen on the west coast of South America. The cold water is full of plankton that fish feed on, so the catches were good during such periods. Then when the water warmed, the number of fish decreased.

During El Niño, the surface water layer in the center of the Pacific Ocean heats up
What does El Niño affect and why bother predicting it?
Changes in ocean temperatures strongly affect the lives of people in countries living near to the equator. The climate is warming, but this leads to various consequences in different regions. In northwestern Mexico, the southeastern United States, Peru and Ecuador, for example, the air is becoming more humid. In Colombia, Central America, Indonesia, the Philippines, and northern Australia, on the contrary, the climate is becoming drier. So, in some places, El Niño leads to flooding and snowfall not typical of those regions, whereas it leads to droughts and forest fires in others.
This affects harvests and people’s lives in general, with economic and social problems also resulting. The drought and subsequent increase in food prices that occurred during the El Niño period in 2007 caused riots in Egypt, Cameroon, and Haiti.
El Niño also leads to surges in diseases carried by mosquitoes. In India, Venezuela, and Colombia, malaria outbreaks are linked to El Niño cycles, and in Kenya and Somalia, Rift Valley fever began in 1997-1998 due to heavy rainfall during the El Niño period.
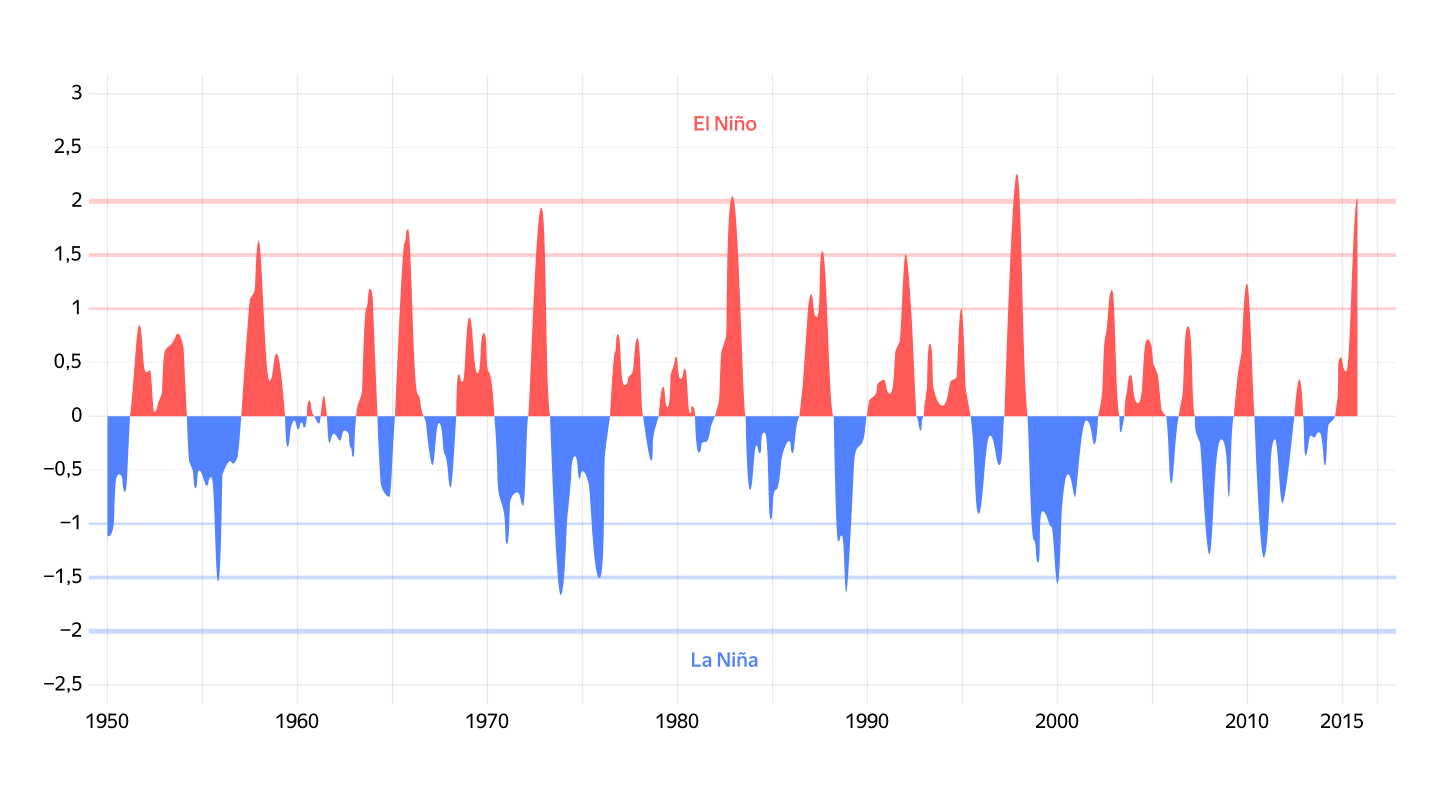
The strongest El Niño periods were recorded in 1982-1983, 1997-1998, and 2015-2016.

The periods of El Niño and the reverse phenomenon, La Niña, when temperatures in the equatorial Pacific Ocean drop below normal
What makes El Niño difficult to predict even with a neural network?
Ocean waters can heat up both once every two years and once every seven years, and previously this phenomenon was considered unpredictable. By now, scientists have learned how to predict El Niño a year and a half ahead.
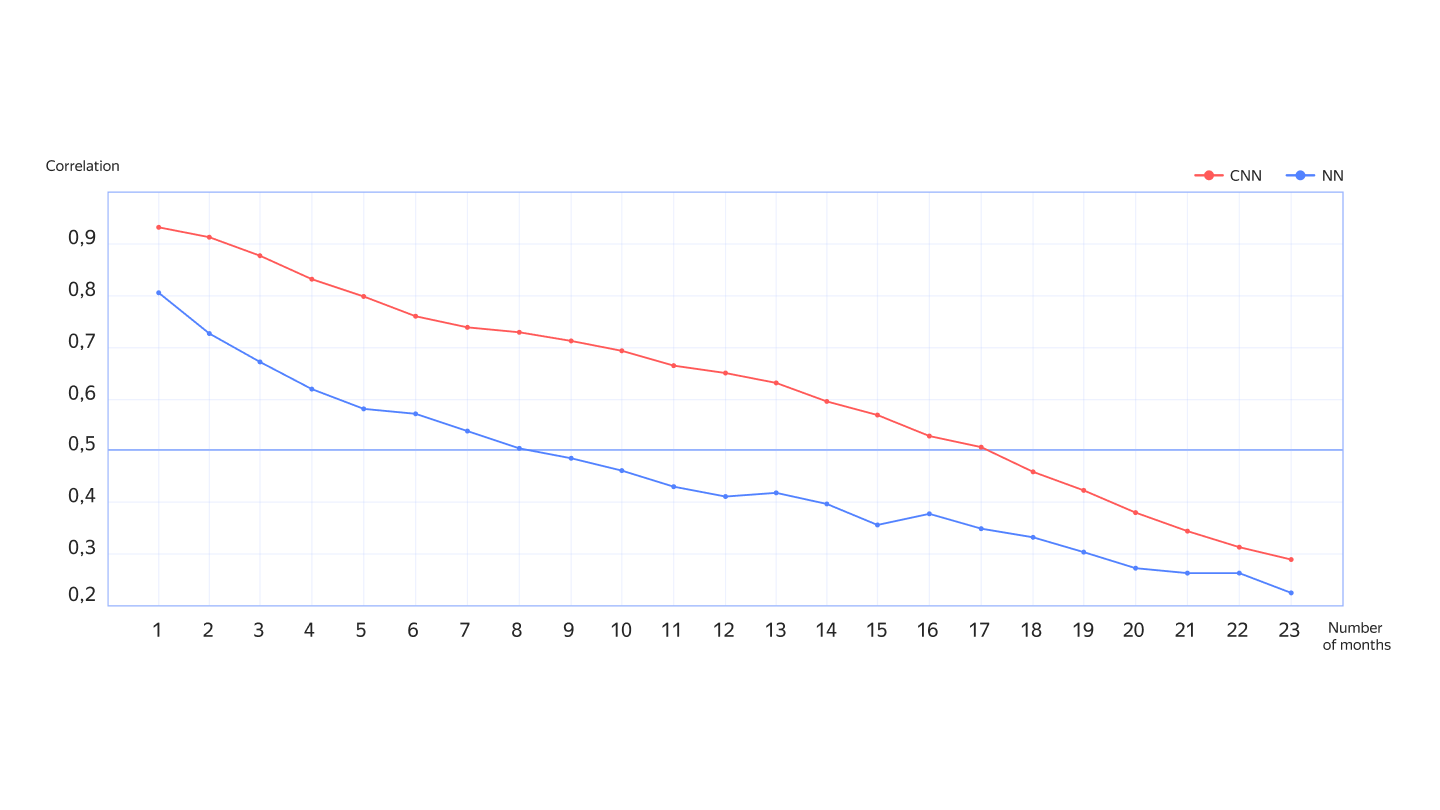
This is the time range that our ML model, developed with scientists from the Higher School of Economics, can predict for. According to climatologists, the forecast range can be increased, but only up to a maximum of two years. We hope to get beyond this deadline.

How forecast accuracy decreases by month. Predictions with a correlation above 0.5 are considered accurate. The graph shows that a convolutional neural network (CNN) provides a more accurate forecast than a conventional neural network (NN). Convolutional networks are more suitable for image processing.
The main problem is that we don’t have much data yet. So we used both real historical ocean temperature data and simulated synthetic data to train the model.
We obtained synthetic data from a climate model built without ML, based only of differential equations, with the help of which physicists describe the laws of nature. In this way, we modeled the ocean surface 100 times and got 250,000 graphs with synthetic data. Although these data were not very accurate, they helped the ML model understand general patterns. We then refined it on a small set of real data: about 2500 graphs obtained during monthly observations of ocean temperature over the past 200 years.
Using equations from physics, our model understands that we are not just working with pictures, but trying to deduce a specific physical law according to which something in nature is changing. As a result, it attempts to get a differential equation on its own, which, when solved, will give us the desired forecast.
Before starting to train the models, both the real and synthetic data had to be pre-processed. We used the Yandex DataSphere service for ML development where you can only pay for the resources consumed.
You will need:
-
1 TB of storage space
-
100 GB of RAM
-
32 processors
-
2 powerful servers with A100 graphics cards, which allow you to train a model with a large number of parameters.
How can we overcome the two-year threshold?
We tried to teach the model to make a longer-term forecast using more powerful and interesting ML models. We used methods from the field of natural language development, the Transformer neural network architecture for time series. It works well on sequential data, which is the type of architecture used by the ChatGPT neural network. In our case, however, the results remained the same.
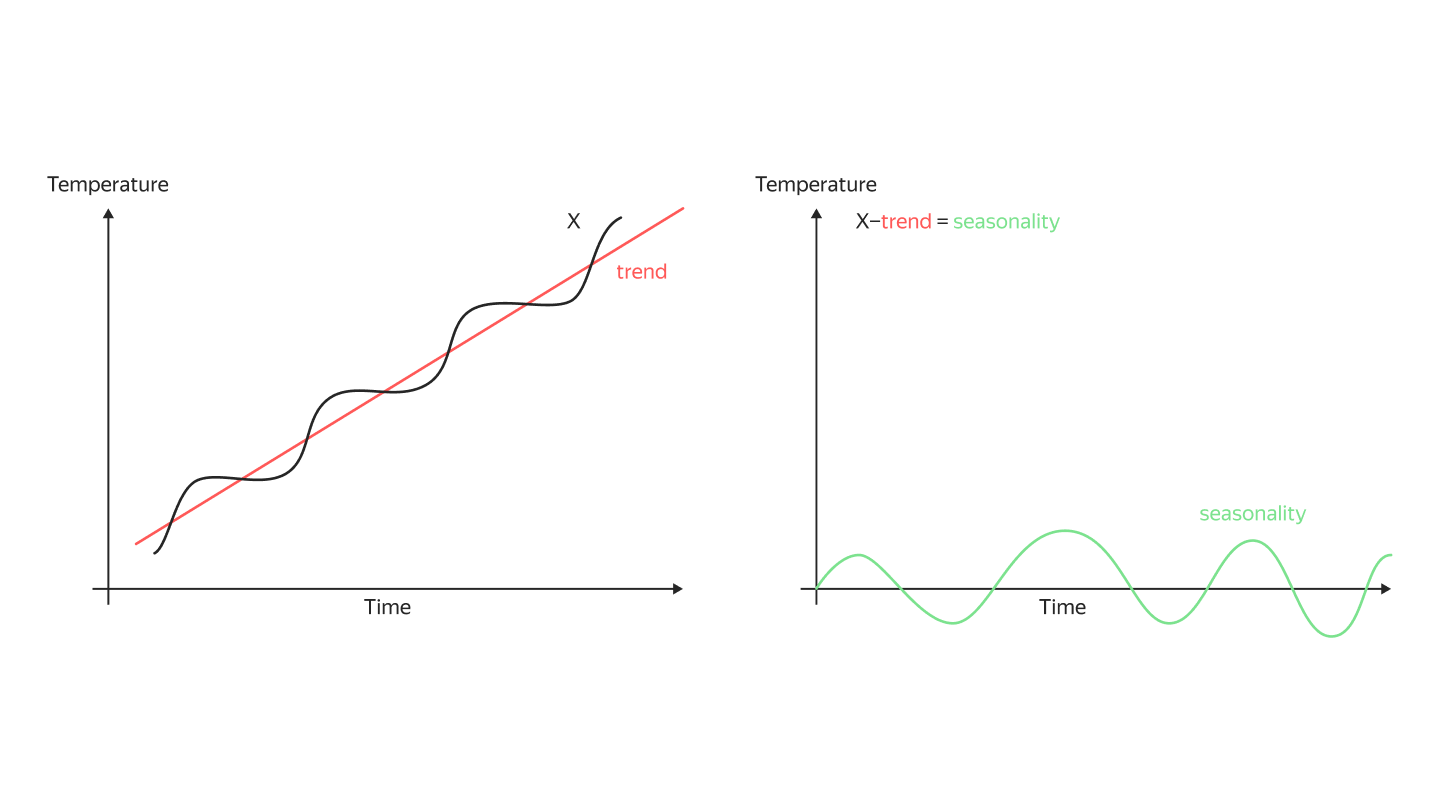
Later, a hypothesis emerged that it is possible to unravel long time patterns by decomposing the series into a trend (a straight line along which the temperature rises) and a seasonal component (what remains after deducing the trend). We are currently working actively on a model based on the Autoformer architecture, which also handles data sequences well.

At the same time, we noticed that different models make similar predictions. The data itself is more important, and right now our main task is to understand which data is best to use.
