Public chart with a map of Moscow from a CSV file
Note
In this tutorial all objects will be created and stored in a workbook. If using legacy folder navigation, create an individual directory to work in.
Create a directory
- Go to the DataLens home page.
- In the left-hand panel, select All objects or Personal directory.
- In the top-right corner, click Create → Directory.
- Enter a name for the directory.
- Click Create.
In DataLens, you can grant public access to your charts and dashboards.
Warning
Before publishing, make sure your charts and dashboards contain no personal data or trade secrets. Access to published data is not restricted.
In this tutorial, we will use DataLens to visualize and publish Moscow population metrics on the map of Moscow districts.
We will use the Moscow Population 2018.csv file as the data source on Moscow population and area in 2018. Download it before you proceed with this guide. Source: List of Moscow districts and settlements.
To visualize and explore data, set up DataLens and follow the steps below:
- Create a workbook.
- Create a connection.
- Create a dataset.
- Create a chart with a map of Moscow districts.
- Publish the chart.
Getting started
To get started with DataLens:
- Log in to your Yandex account. If you do not have an account, create one.
- Open the DataLens home page.
- Click Open DataLens.
- Confirm that you have read the Terms of use and click Log in.
-
Log in to your Yandex account.
-
Open the DataLens home page.
-
Click Open DataLens.
-
Select one of the options:
-
If you already have an organization, select it from the drop-down menu in the Organizations tab and click DataLens.
Note
To activate a DataLens instance, the user must have the
adminorownerrole. For more information about roles, see Access management in Yandex Cloud Organization. -
If you have a cloud but no organization, click Add new DataLens. In the window that opens, enter your organization's name and description and click Create organization and DataLens. For more information about working with organizations, see Getting started with organizations.
-
If you have any technical questions about the service, contact Yandex Cloud support. To ask for advice, discuss the solution to your problem or best practices of the service, write to the DataLens chat in Telegram.
Create a workbook
- Go to the DataLens home page.
- In the left-hand panel, select Collections and workbooks.
- In the top-right corner, click Create → Create workbook.
- Enter a name for the workbook:
Tutorials. - Click Create.
Create a connection
Create a connection to the source data file.
-
In the top-right corner of the workbook, click Create → Connection.
-
Under Files and services, select the Files connection.
-
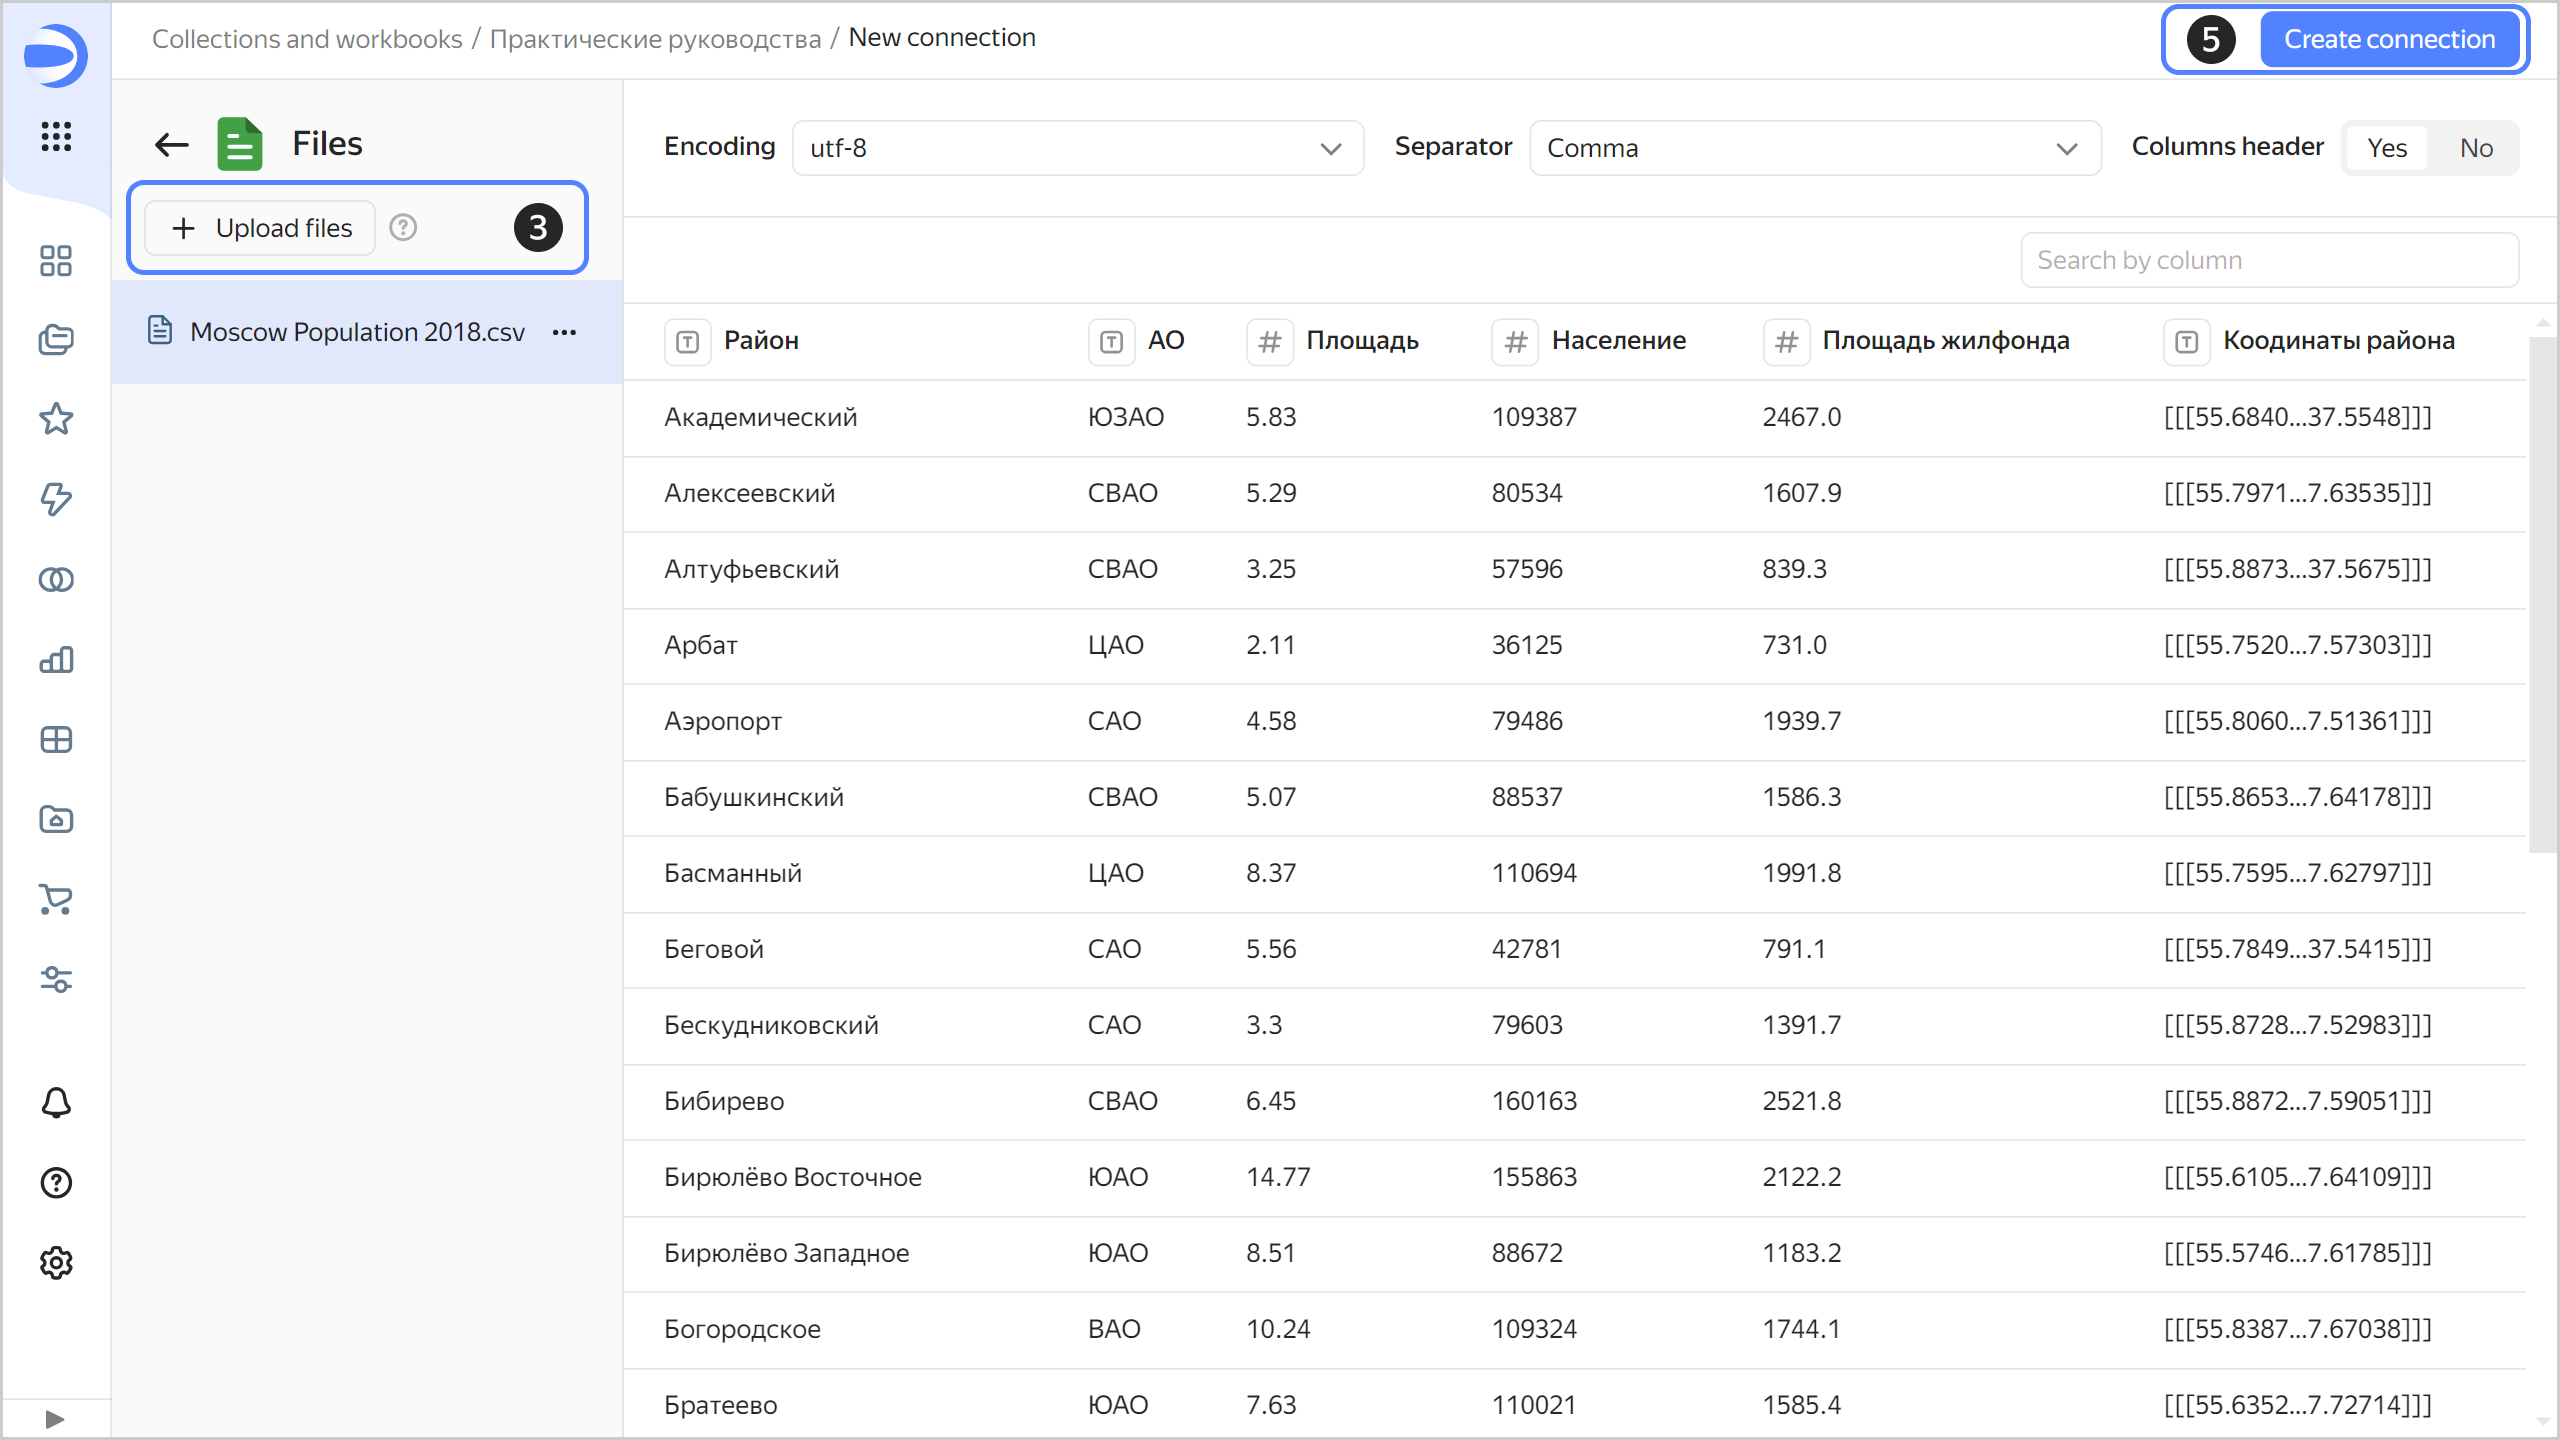
Click Upload files.
-
Select Moscow Population 2018.csv.
Wait until the table content appears on the screen. It may take up to several minutes to load it, depending on the speed of your internet connection.
-
Click Create connection.
-
Enter
Moscow Population 2018for connection name and click Create.
This will create the file connection. The data will be shown in the same form as in the file. To use it, you need to create a dataset.
Create a dataset
Create a dataset based on the Moscow Population 2018 connection:
-
In the top-right corner of the connection page, click Create dataset.
-
In the dataset, go to the Fields tab.
-
For the
Area,Population, andHousing stockfields, specify Sum as the aggregation type. The fields with defined aggregation functions become measures and change their color to blue. -
For the
District coordinatesfield, change the data type to Geopolygon: select Geopolygon in the Type column.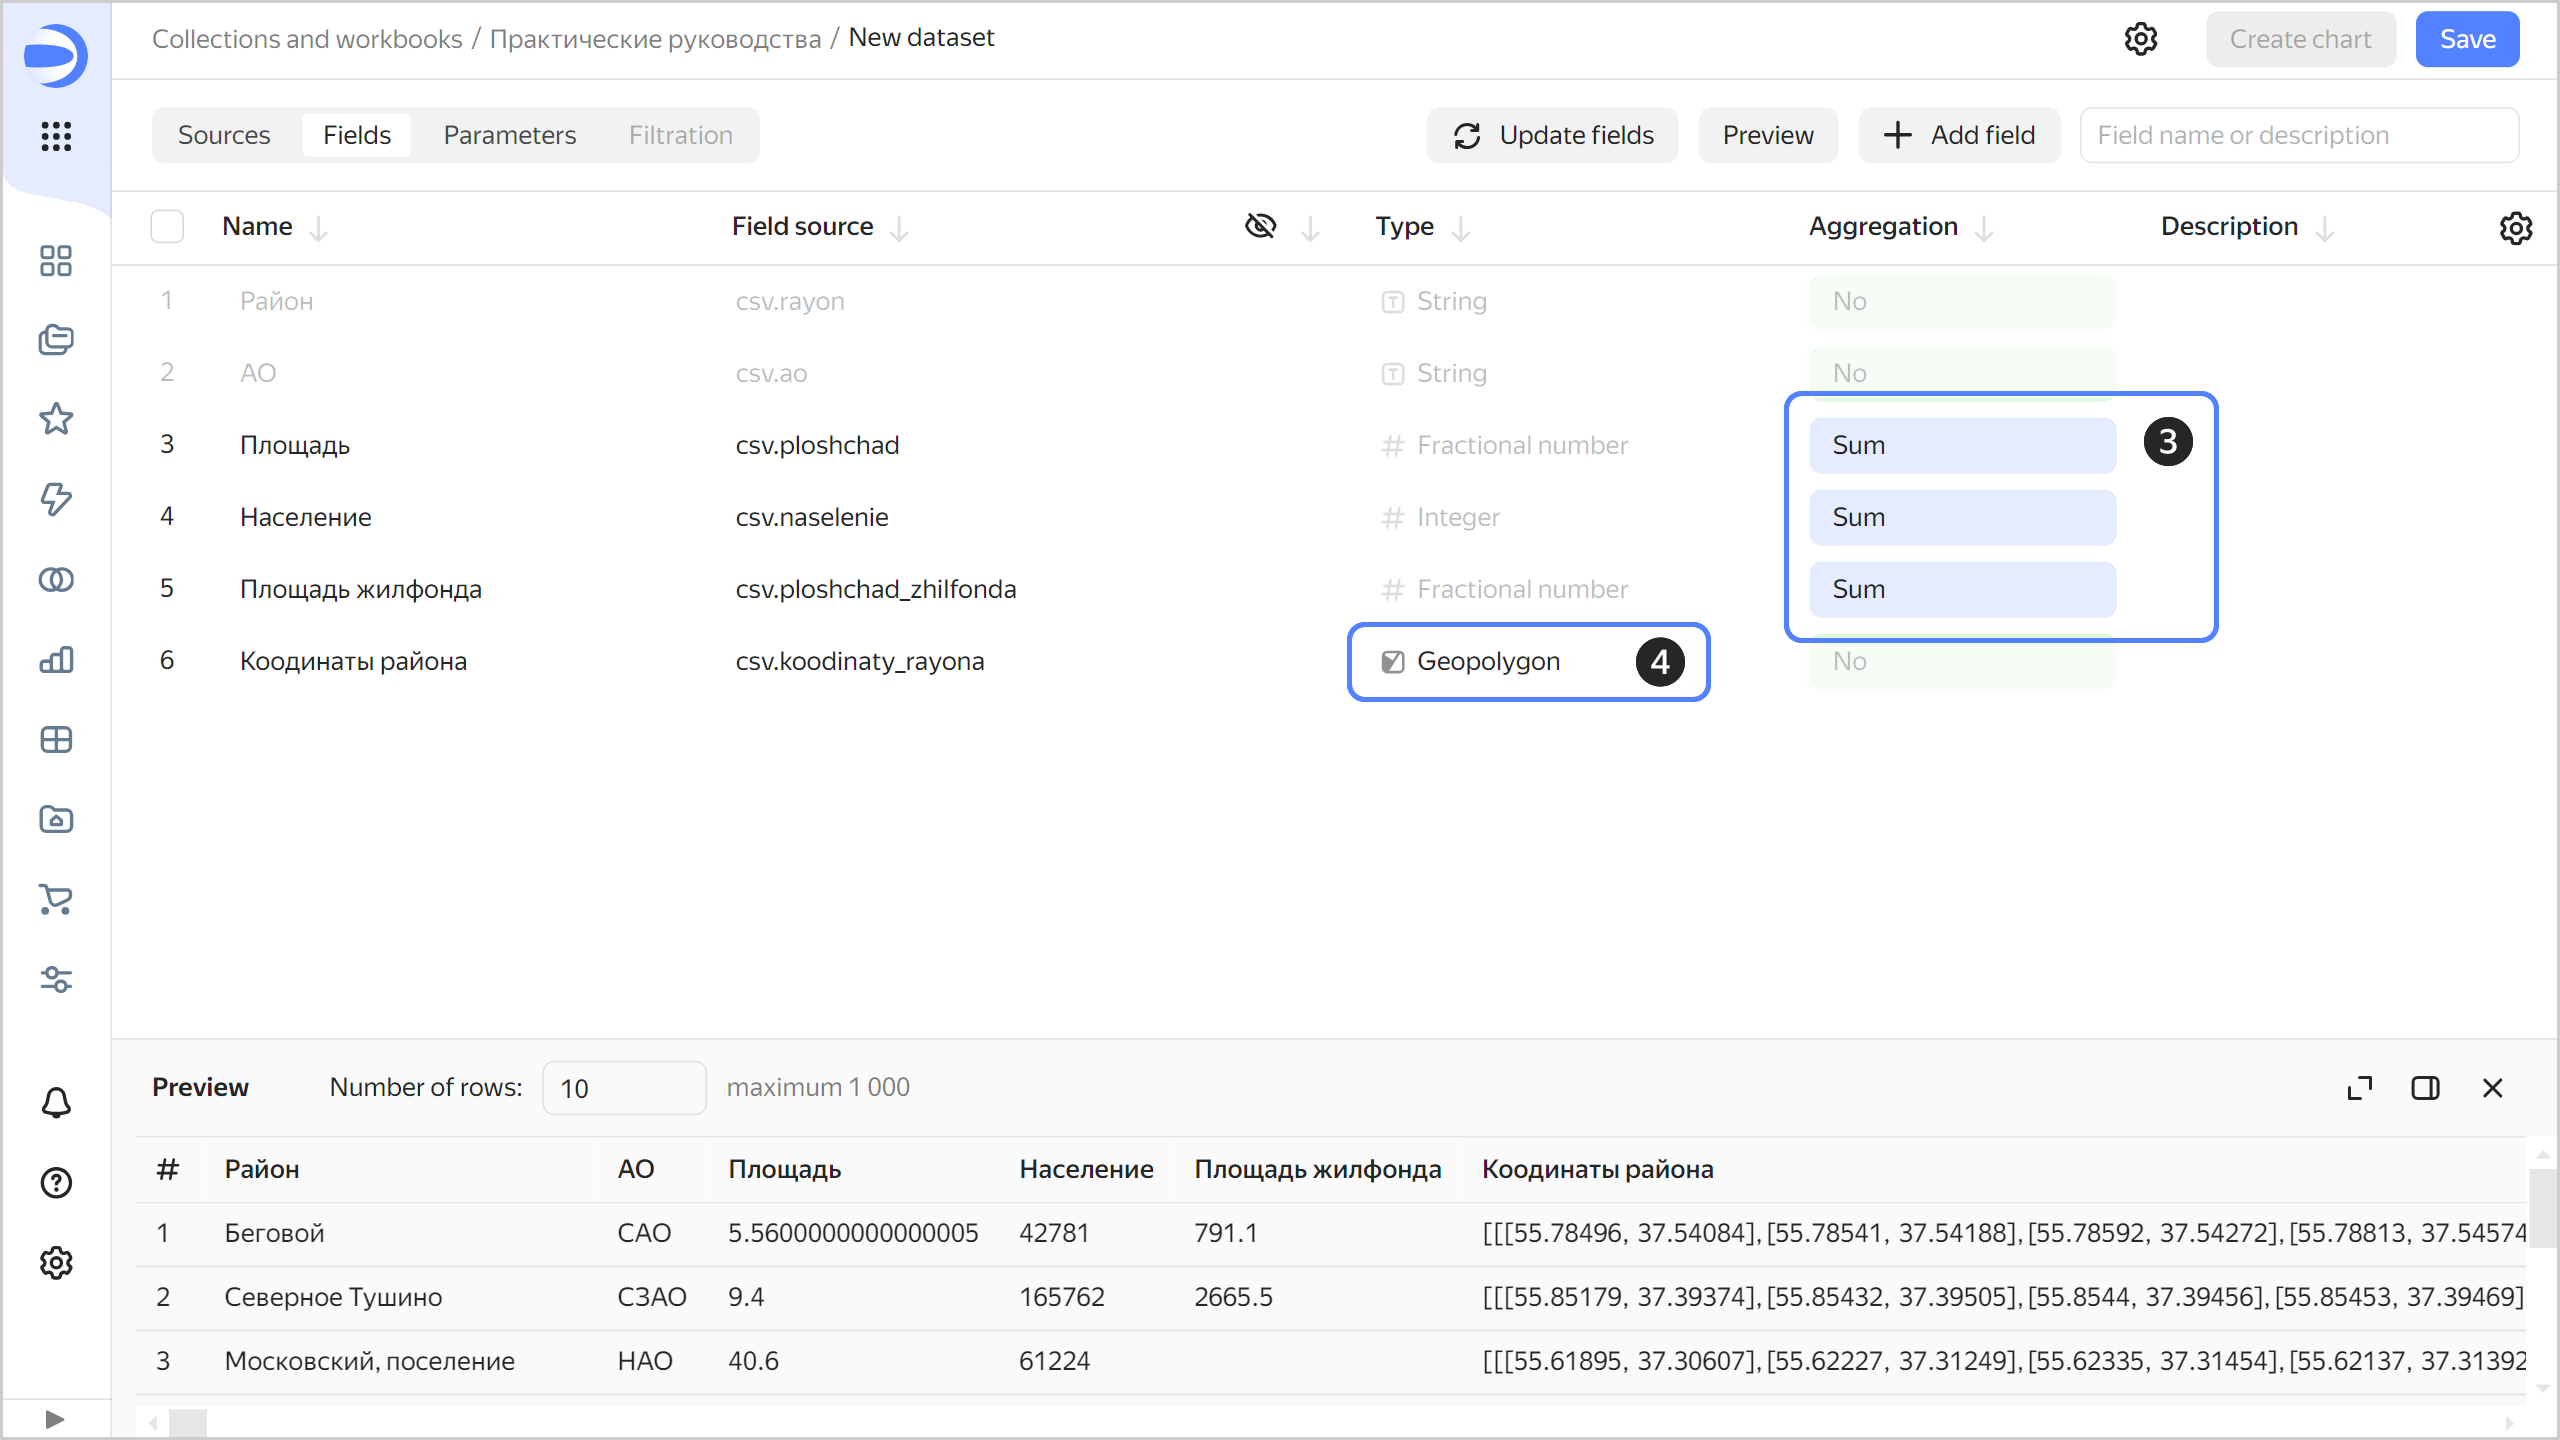
-
Save the dataset:
- In the top-right corner, click Save.
- Enter
Moscow Population datasetfor the dataset name and click Create.
Create a chart with a map of Moscow districts
Create a heat map chart to visualize the distribution of population across Moscow districts:
-
On the dataset page, click Create chart in the top-right corner.
-
Select the Map visualization type.

-
Select Polygons (Geopolygons) as the layer type.

-
Add polygons of districts to the map. To do this, drag the
Coordinatesfield from Dimensions to Polygons (Geoplygons). -
Change the district colors based on the population. Drag the
Population** field from **Measuresto the Colors section.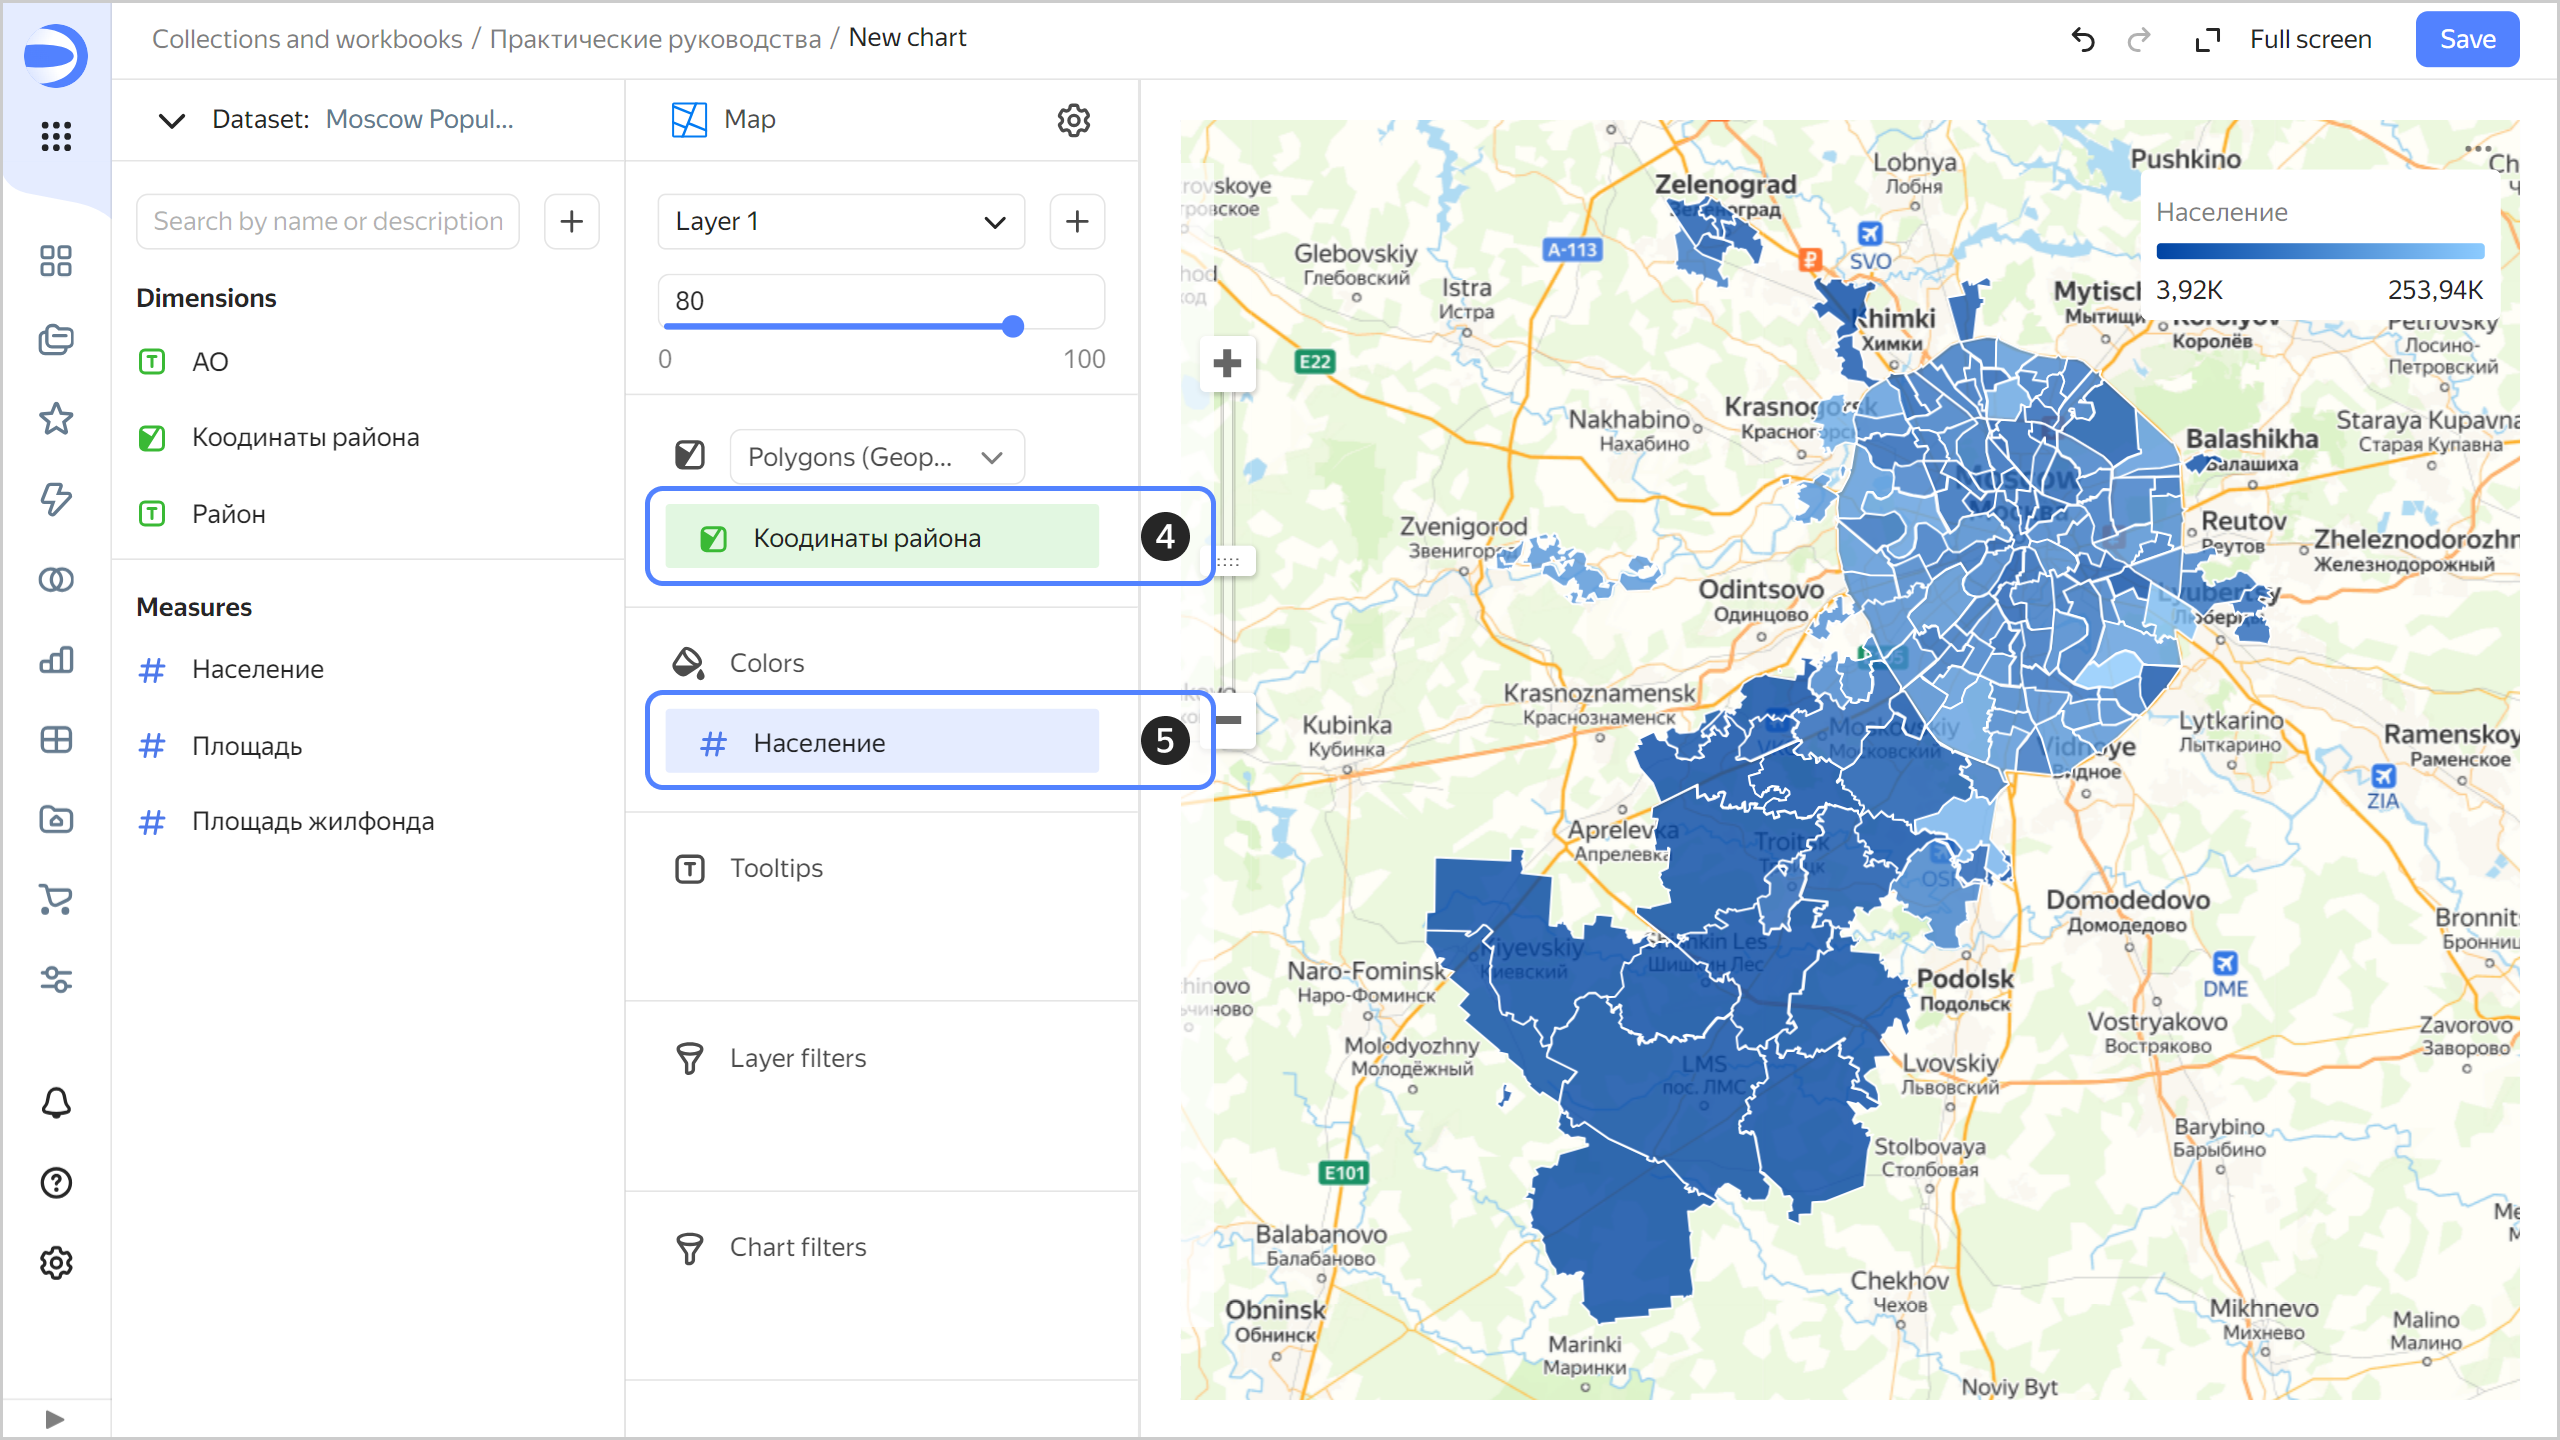
-
Save the chart:
-
In the top-right corner, click Save.
-
In the window that opens, enter
Moscow population map by districtas the chart name and click Save.
-
Publish the chart
-
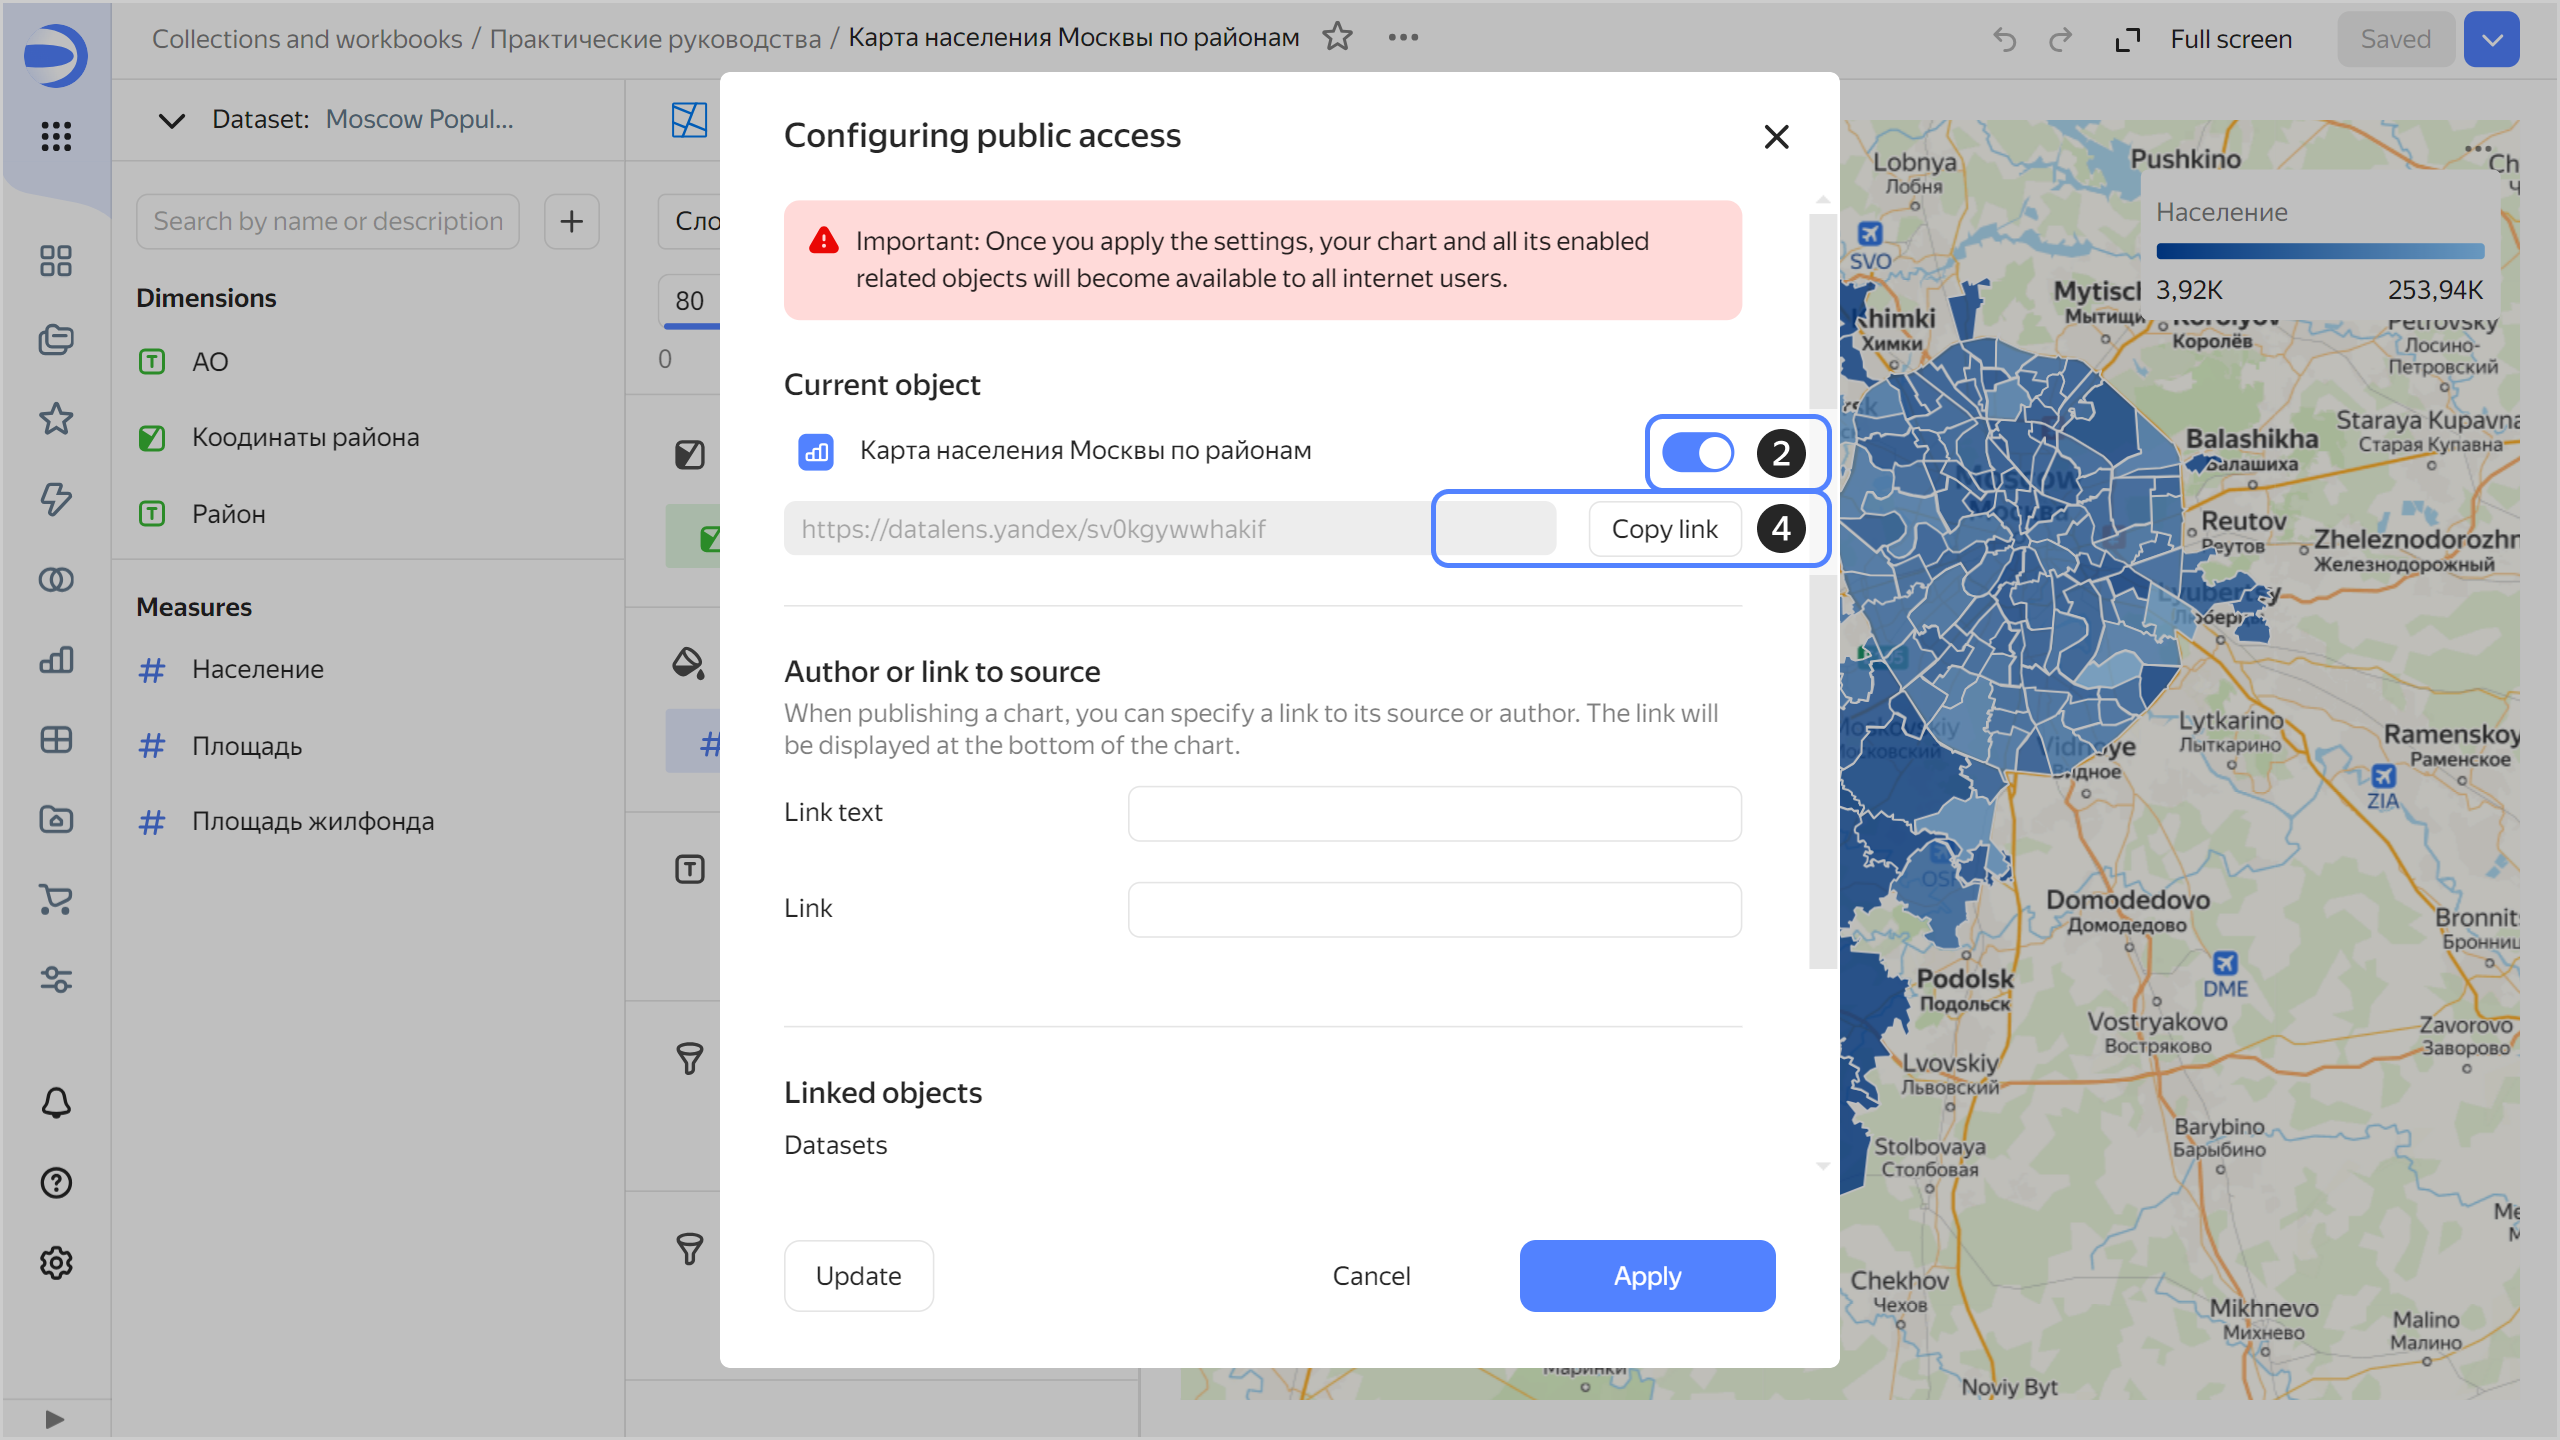
At the top of the screen, click → Public access.
-
In the window that opens, enable the link sharing option next to the chart name.
-
Click Continue to confirm the publication of the chart and its linked data.
-
Click Copy link to copy the chart's unique URL.
-
Click Apply.
-
Open a new tab in the browser and go to the copied link.

You can share this link with your colleagues, partners, and friends. When opening the chart link, authorization and authentication are not required.
Also try:
-
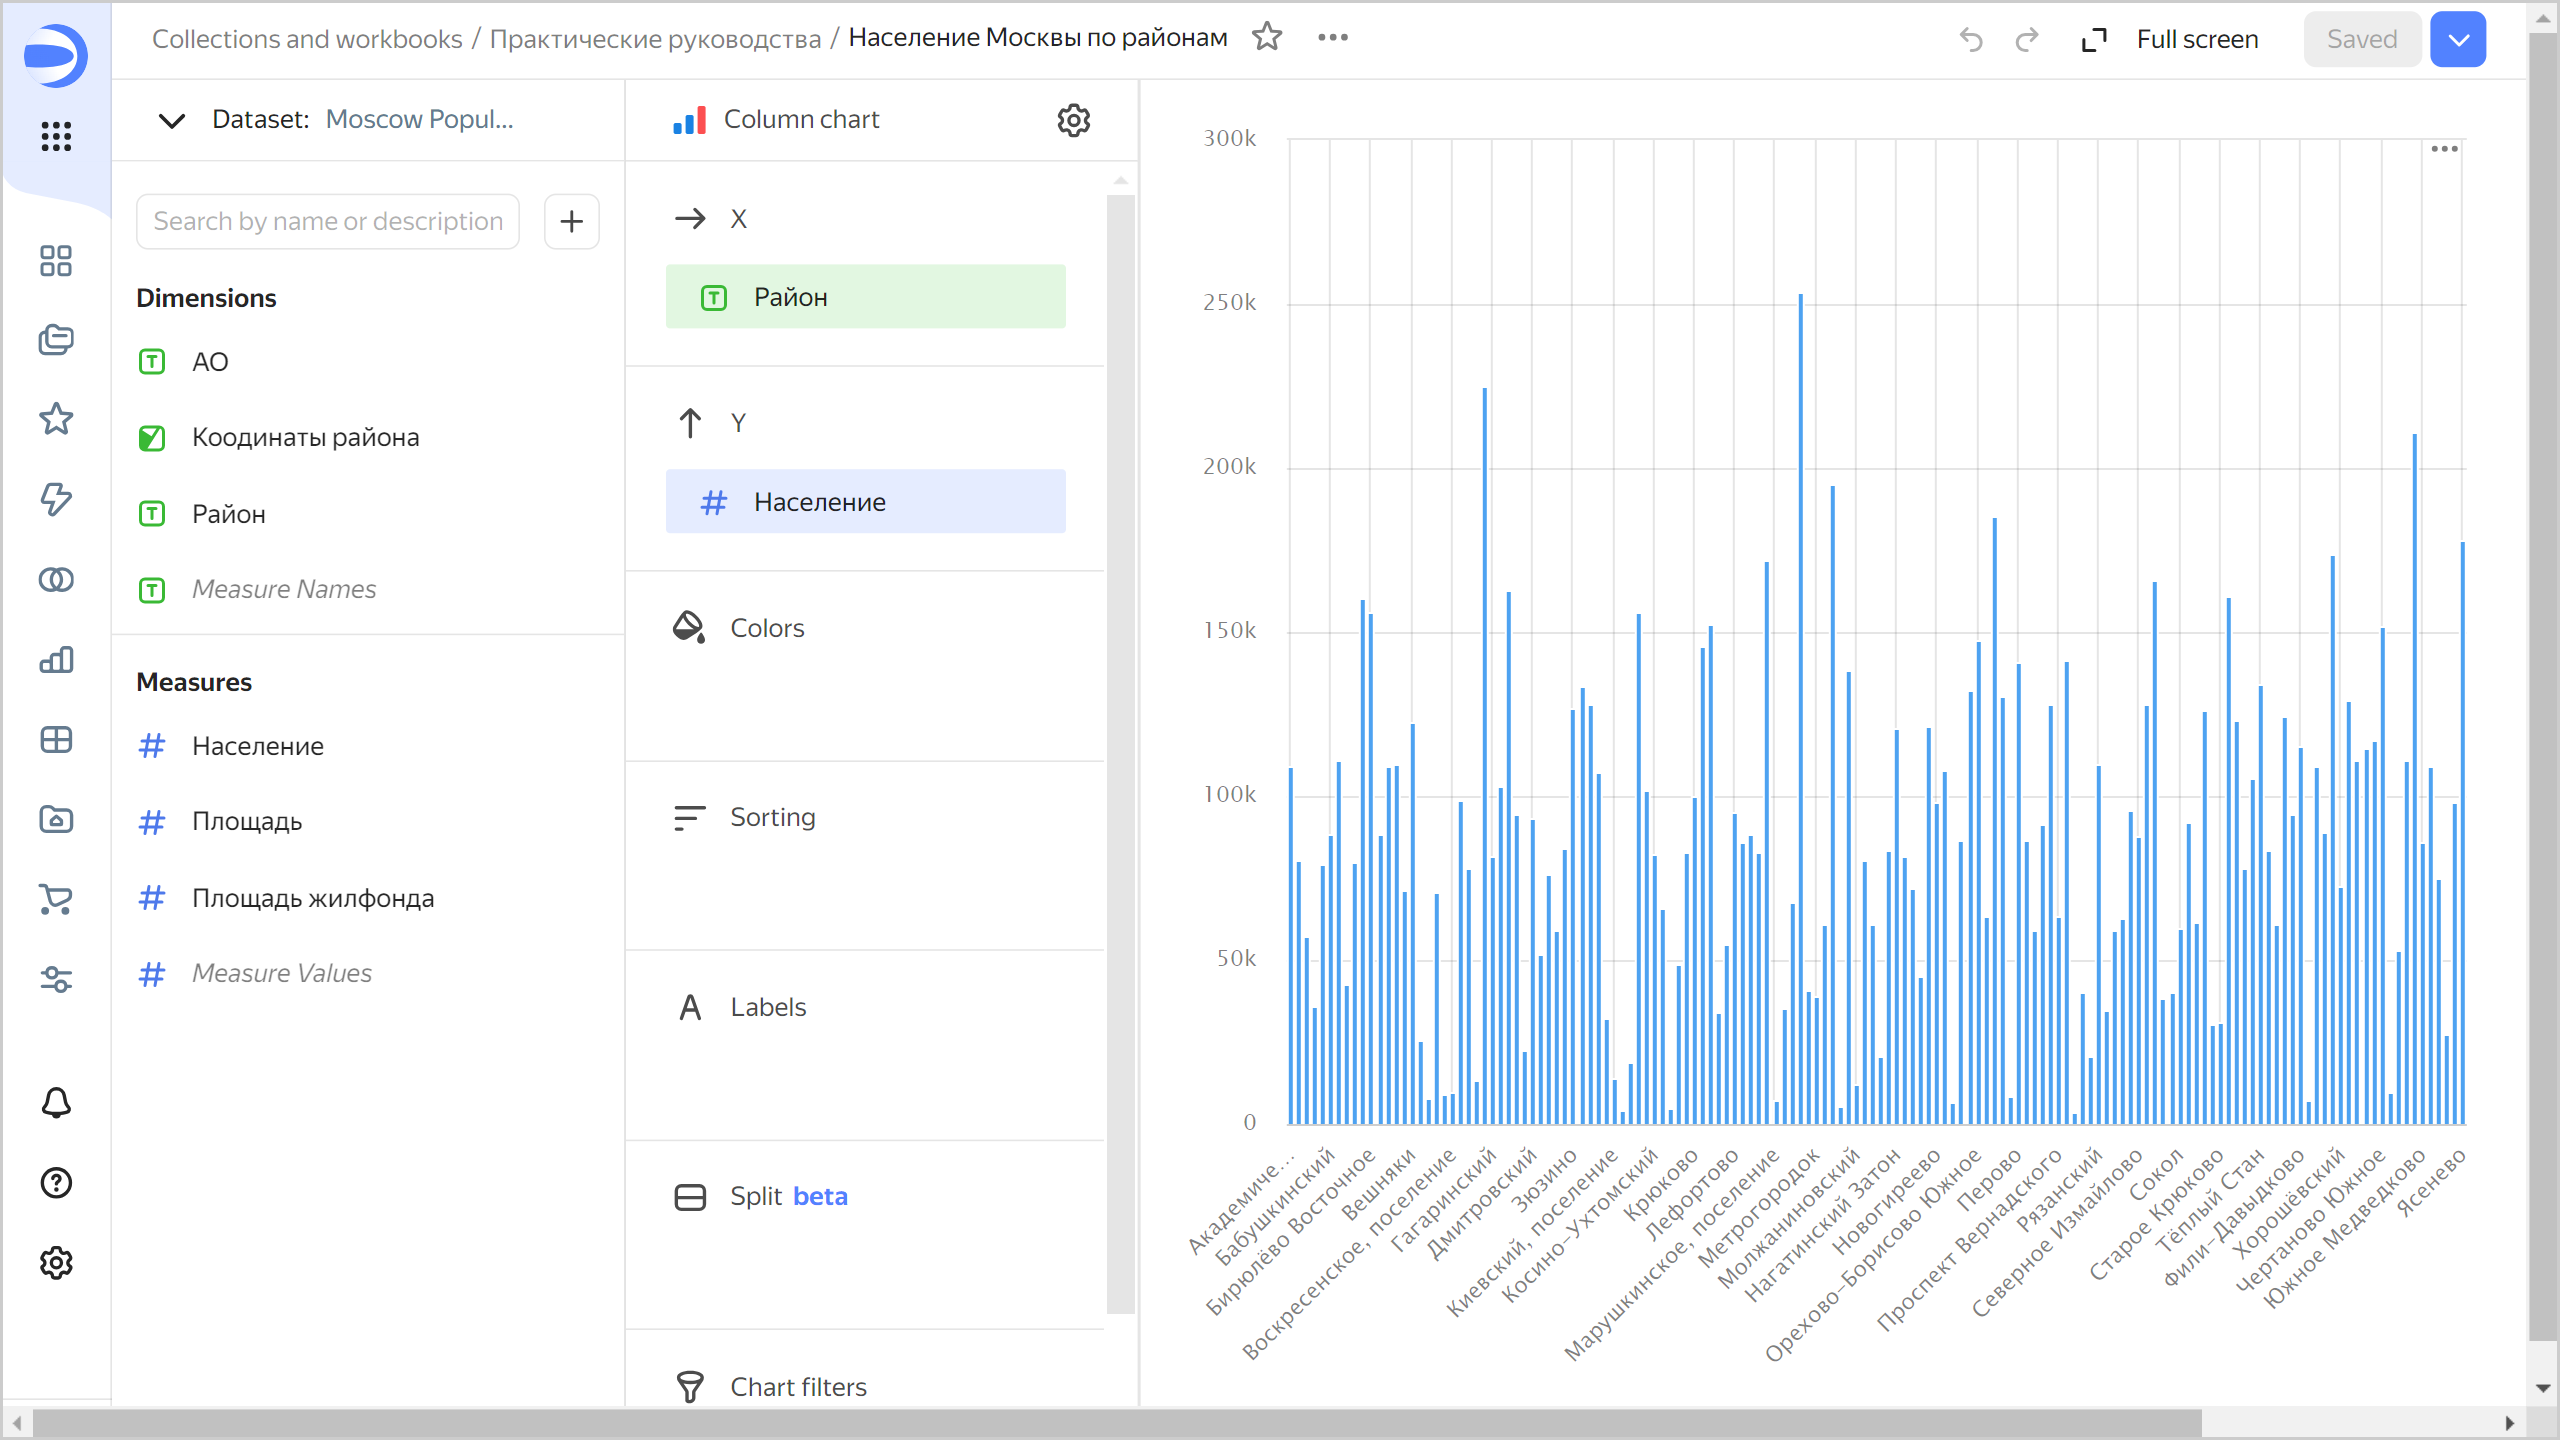
Building a column chart by district and population.
Moscow population by district
-
Creating a dashboard with a map, bar chart, and selectors.