Building a table based on API Connector
Note
This feature is only available with the Business service plan.
Follow this guide to build a table in Editor based on an API Connector connection.
You will use a static JSON file located at https://storage.yandexcloud.net/datalens-public-demo-assets/data/mtcars.json as your data source, but the process is similar for full-blown APIs.
Getting started
To get started with DataLens:
- Log in to your Yandex account. If you do not have an account, create one.
- Open the DataLens home page.
- Click Open DataLens.
- Confirm that you have read the Terms of use and click Log in.
-
Log in to your Yandex account.
-
Open the DataLens home page.
-
Click Open DataLens.
-
Select one of the options:
-
If you already have an organization, select it from the drop-down menu in the Organizations tab and click DataLens.
Note
To activate a DataLens instance, the user must have the
adminorownerrole. For more information about roles, see Access management in Yandex Cloud Organization. -
If you have a cloud but no organization, click Add new DataLens. In the window that opens, enter your organization's name and description and click Create organization and DataLens. For more information about working with organizations, see Getting started with organizations.
-
If you have any technical questions about the service, contact Yandex Cloud support. To ask for advice, discuss the solution to your problem or best practices of the service, write to the DataLens chat in Telegram.
Create a workbook
- Go to the DataLens home page.
- In the left-hand panel, select Collections and workbooks.
- In the top-right corner, click Create → Create workbook.
- Enter a name for the workbook:
Tutorials. - Click Create.
Create an API Connector connection
-
Navigate to the workbook created in the previous step and click Create → Connection.
-
Under Files and services, select API Connector.
-
Specify the connection parameters:
- Host name:
storage.yandexcloud.net. - Port:
443. - URL path:
datalens-public-demo-assets/data/.
Leave the other parameters unchanged.
- Host name:
-
Click Create connection. Enter a connection name and click Create.
-
Go to the
Tutorialsworkbook and find the new connection on the Connections tab. -
Copy the connection ID by clicking → Copy ID next to it. The ID will be copied to the clipboard.
Create a chart in Editor
-
In the workbook, click Create → Chart in Editor in the top-right corner. On the page that opens, select the Table visualization type.
-
Link the chart with the connection by navigating to the Meta tab and adding the connection ID to
links:{ "links": { "mtcars": "<connection_ID>" } }Where:
<connection_ID>: Connection ID copied in the previous step.mtcars: Any alias name you assign to the connection and use to request chart data from the source.
Note
You need the Meta tab to describe service information about the list of related entities. This information is used to detect what connections and datasets the chart is related to, as well as for the related objects dialog, when copying a workbook and when publishing to Public.
-
Get data from the data source. To do this, go to the Source tab and specify:
module.exports = { mtcars: { // Indicate which connection to go to for data // Use the name given to the connection on the Meta tab apiConnectionId: Editor.getId("mtcars"), // Specify the path to the API method/page in the source path: "/mtcars.json", // Request method method: "GET", } }; -
Clear the contents of the Config tab: it contains a template that is not relevant to our example.
-
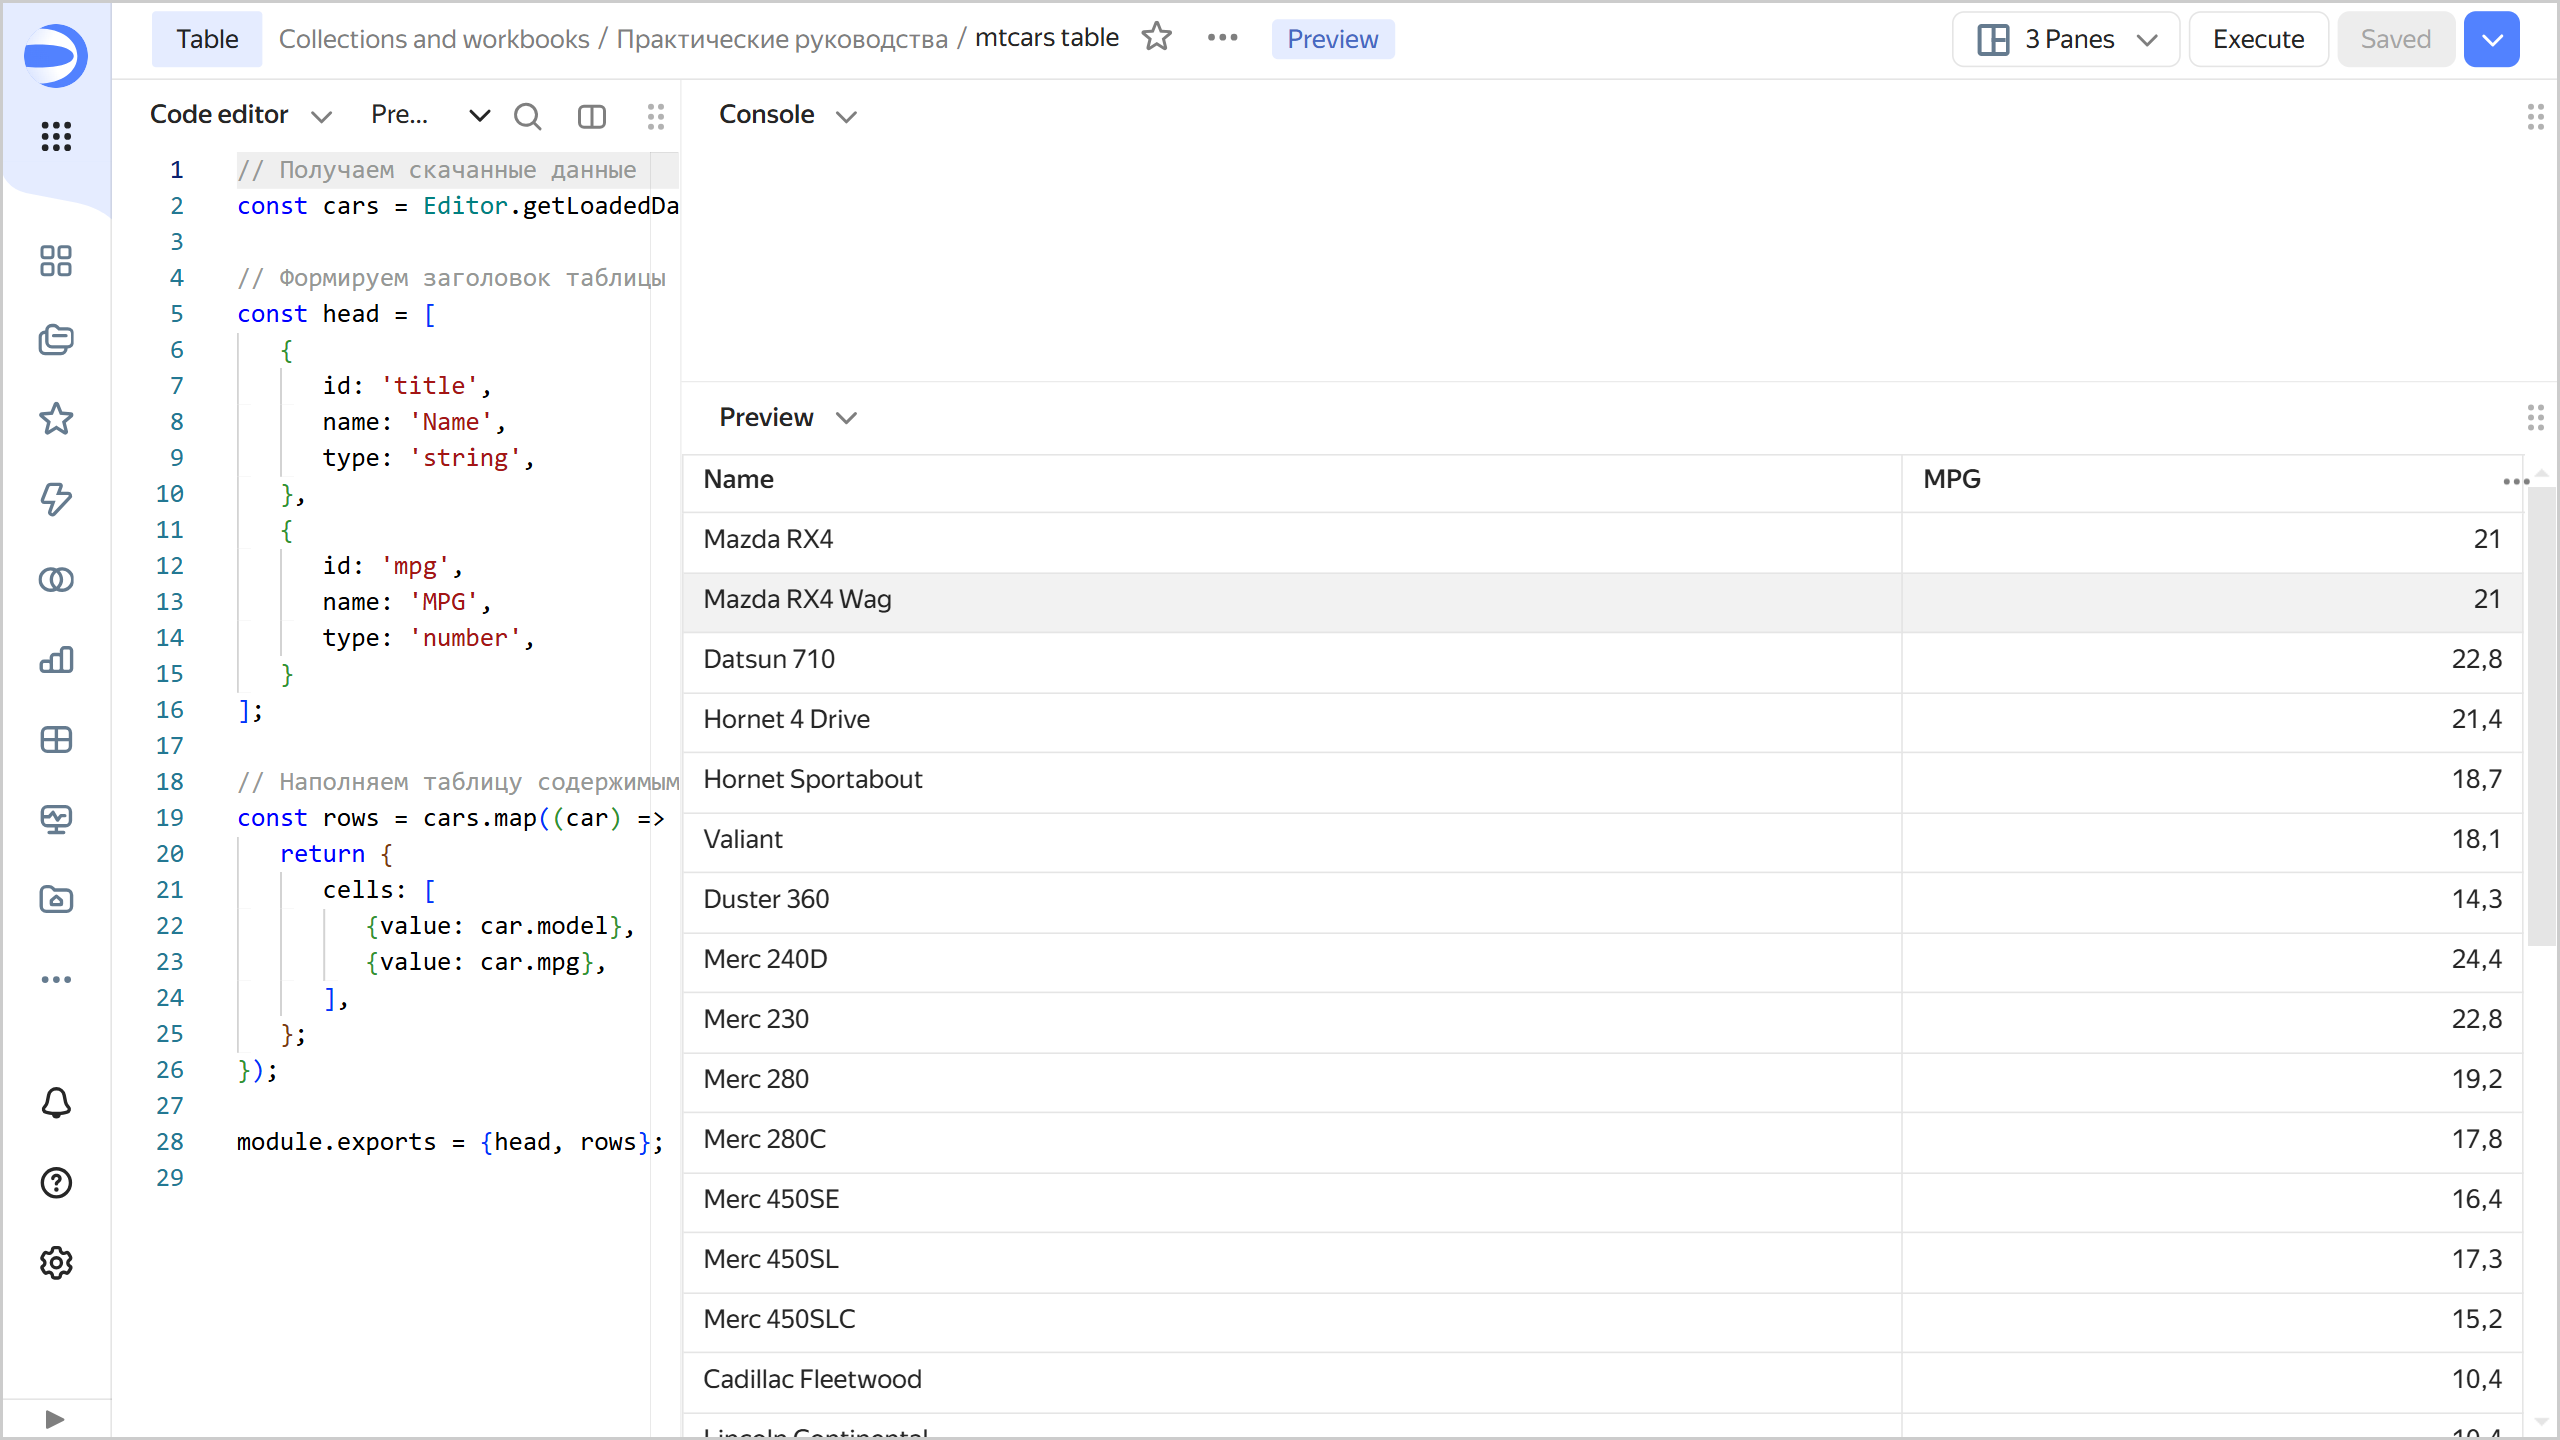
On the Prepare tab, create a table:
// Get the downloaded data const cars = Editor.getLoadedData().mtcars.data.body.cars; // Form the table header and describe the column types const head = [ { id: 'title', name: 'Name', type: 'string', }, { id: 'mpg', name: 'MPG', type: 'number', } ]; // Populate the table const rows = cars.map((car) => { return { cells: [ {value: car.model}, {value: car.mpg}, ], }; }); module.exports = {head, rows}; -
At the top of the chart, click Run. The preview area will display a simple table displaying the data received from the JSON API.
-
To save the chart, click Save in the top-right corner and enter a name for the chart.