DataLens usage statistics
You can connect DataLens Usage Analytics to analyze DataLens user behavior, i.e., view statistics on the service instance usage.
Depending on your pricing plan, the following Usage Analytics connection types are available:
-
Light: Provides aggregated statistics on the DataLens instance usage for a limited period of time (60 days). This connection is available with any service plan.
-
Detailed: Provides both detailed and aggregated statistics on the DataLens instance usage for a long period of time (180 days). It allows you to view detailed statistics on dataset queries and dashboard views. This connection is only available with the Business service plan. Once you change your service plan to Community, the connection will no longer work.
Specifics of working with a connection
Service usage statistics are generated considering the following:
-
For some connections, the query text is not saved:
-
When creating a new object (connection, dataset, chart, or dashboard), you will see
__unknown__instead of its name in the statistics for up to 24 hours. When renaming an object, you will see its old name for up to 24 hours. -
Aggregated data is updated once in 24 hours.
-
Unused objects and inactive users are not presented in the statistics.
DataLens Usage Analytics Light dashboard
The dashboard provides the following summary information:
- Number of active users:
Users Count. - Number of objects of different types:
Dashboards Count,Connections Count,Datasets Count, andCharts Count. - Number of executed queries and errors:
Requests CountandErrors Count. - Percentage of queries utilizing cache data:
Cache Hit. - Number of users working with objects.
Summary
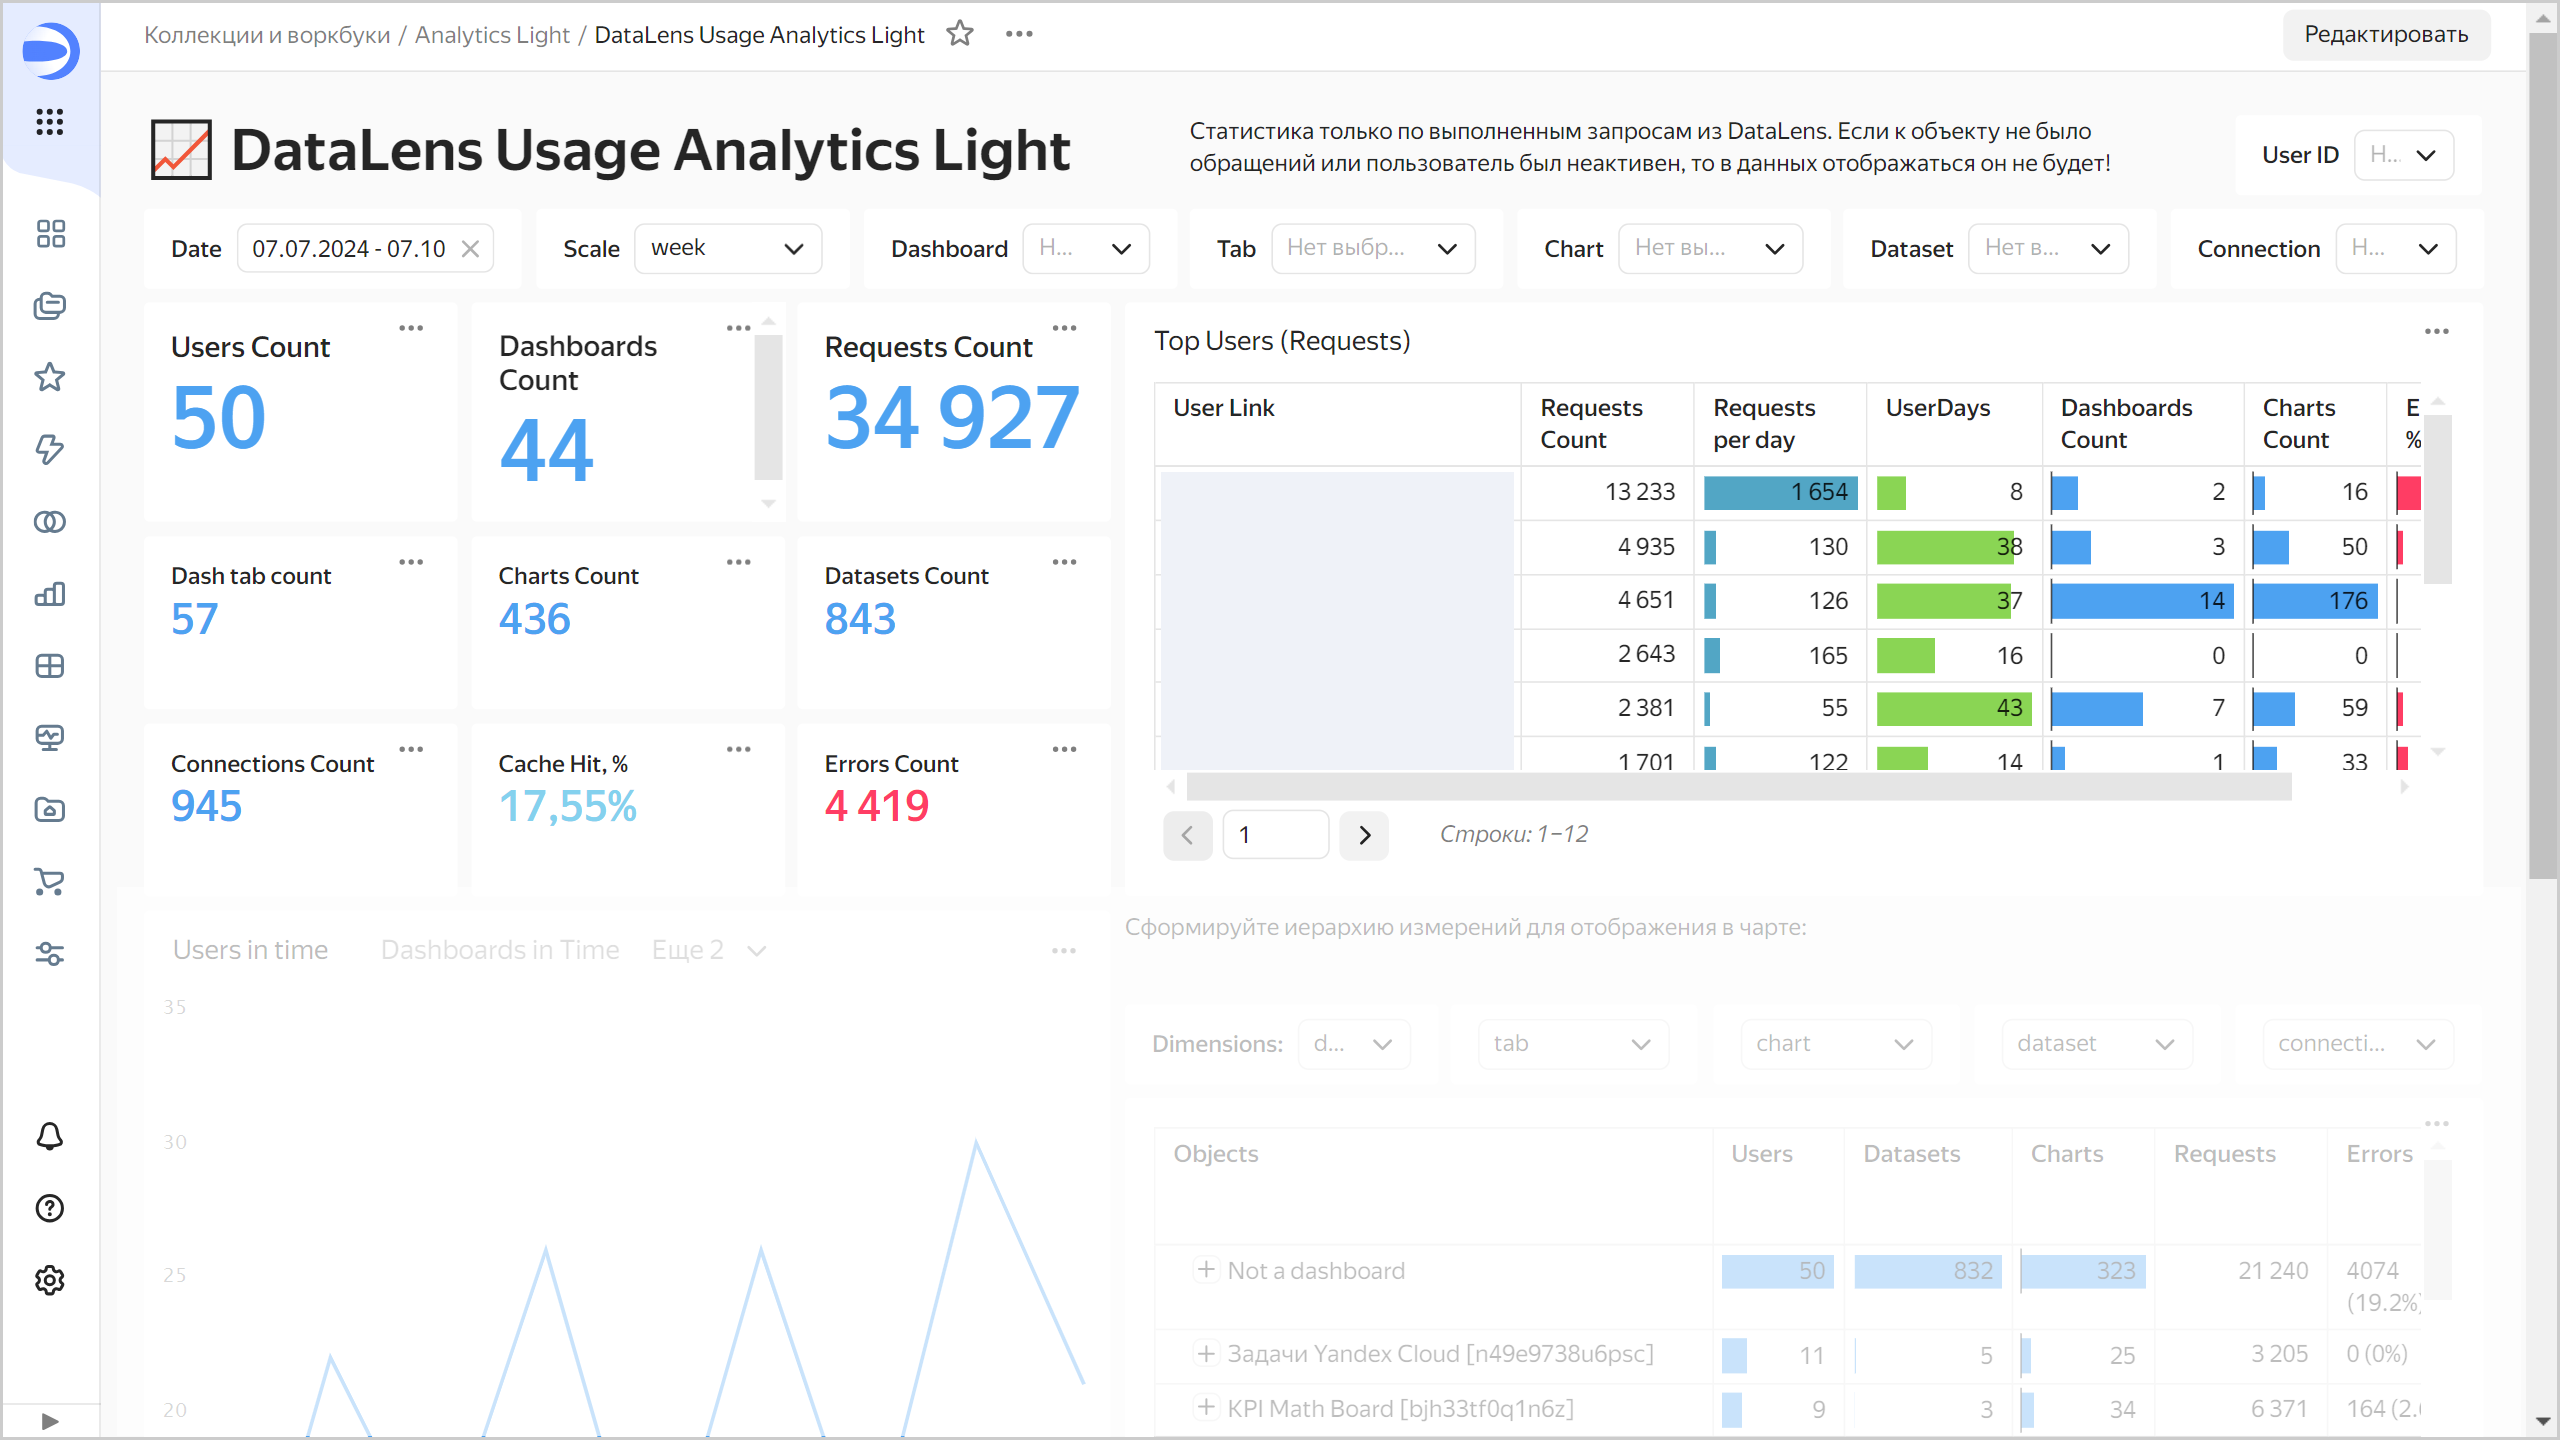
At the top, there are filters by user and object. You can select a dashboard, a tab, a chart, a dataset, or a connection. You can configure the statistics period with the help of the calendar. Using the Scale selector, you can select grouping by month, week, or day for the charts below.
To estimate user activity, refer to the Top Users (Requests) table:
User Link: Username and link to the user page.Requests Count: Number of queries for the specified period.Requests per day: Average number of queries per active day.UserDays: Number of active days.Dashboards Count: Number of dashboards queried by the user.Charts Count: Number of charts queried by the user.Errors, %: Number of errors as a percentage.
Below, you can select a chart to display the number of users, queries, dashboards, or errors.
Queries and errors

Use a custom table with object hierarchy to figure which dashboards are used the most, the number of datasets and charts in each dashboard, and which areas are most prone to errors. By default, objects in a hierarchy are sorted from a dashboard to a connection. In Dimensions, you can customize the hierarchy, e.g., sort objects in reverse order, from a connection to a dashboard. For each object in the hierachy, you can view the following:
Users: Number of users querying the object.Datasets: Number of linked datasets.Charts: Number of linked charts.Requests: Number of queries.Errors: Number and percentage of errors.Lvl 1: Link to the top-level object in the hierarchy.
DataLens Usage Analytics Detailed dashboard
This dashboard is divided into three sections:
-
Objects: This section provides a summary about the number of different types of objects. At the top, there are filters by object. Use a custom table with object hierarchy to figure which dashboards are used the most, which charts take longer than others to load, which areas are most prone to errors, and other information.
Objects section
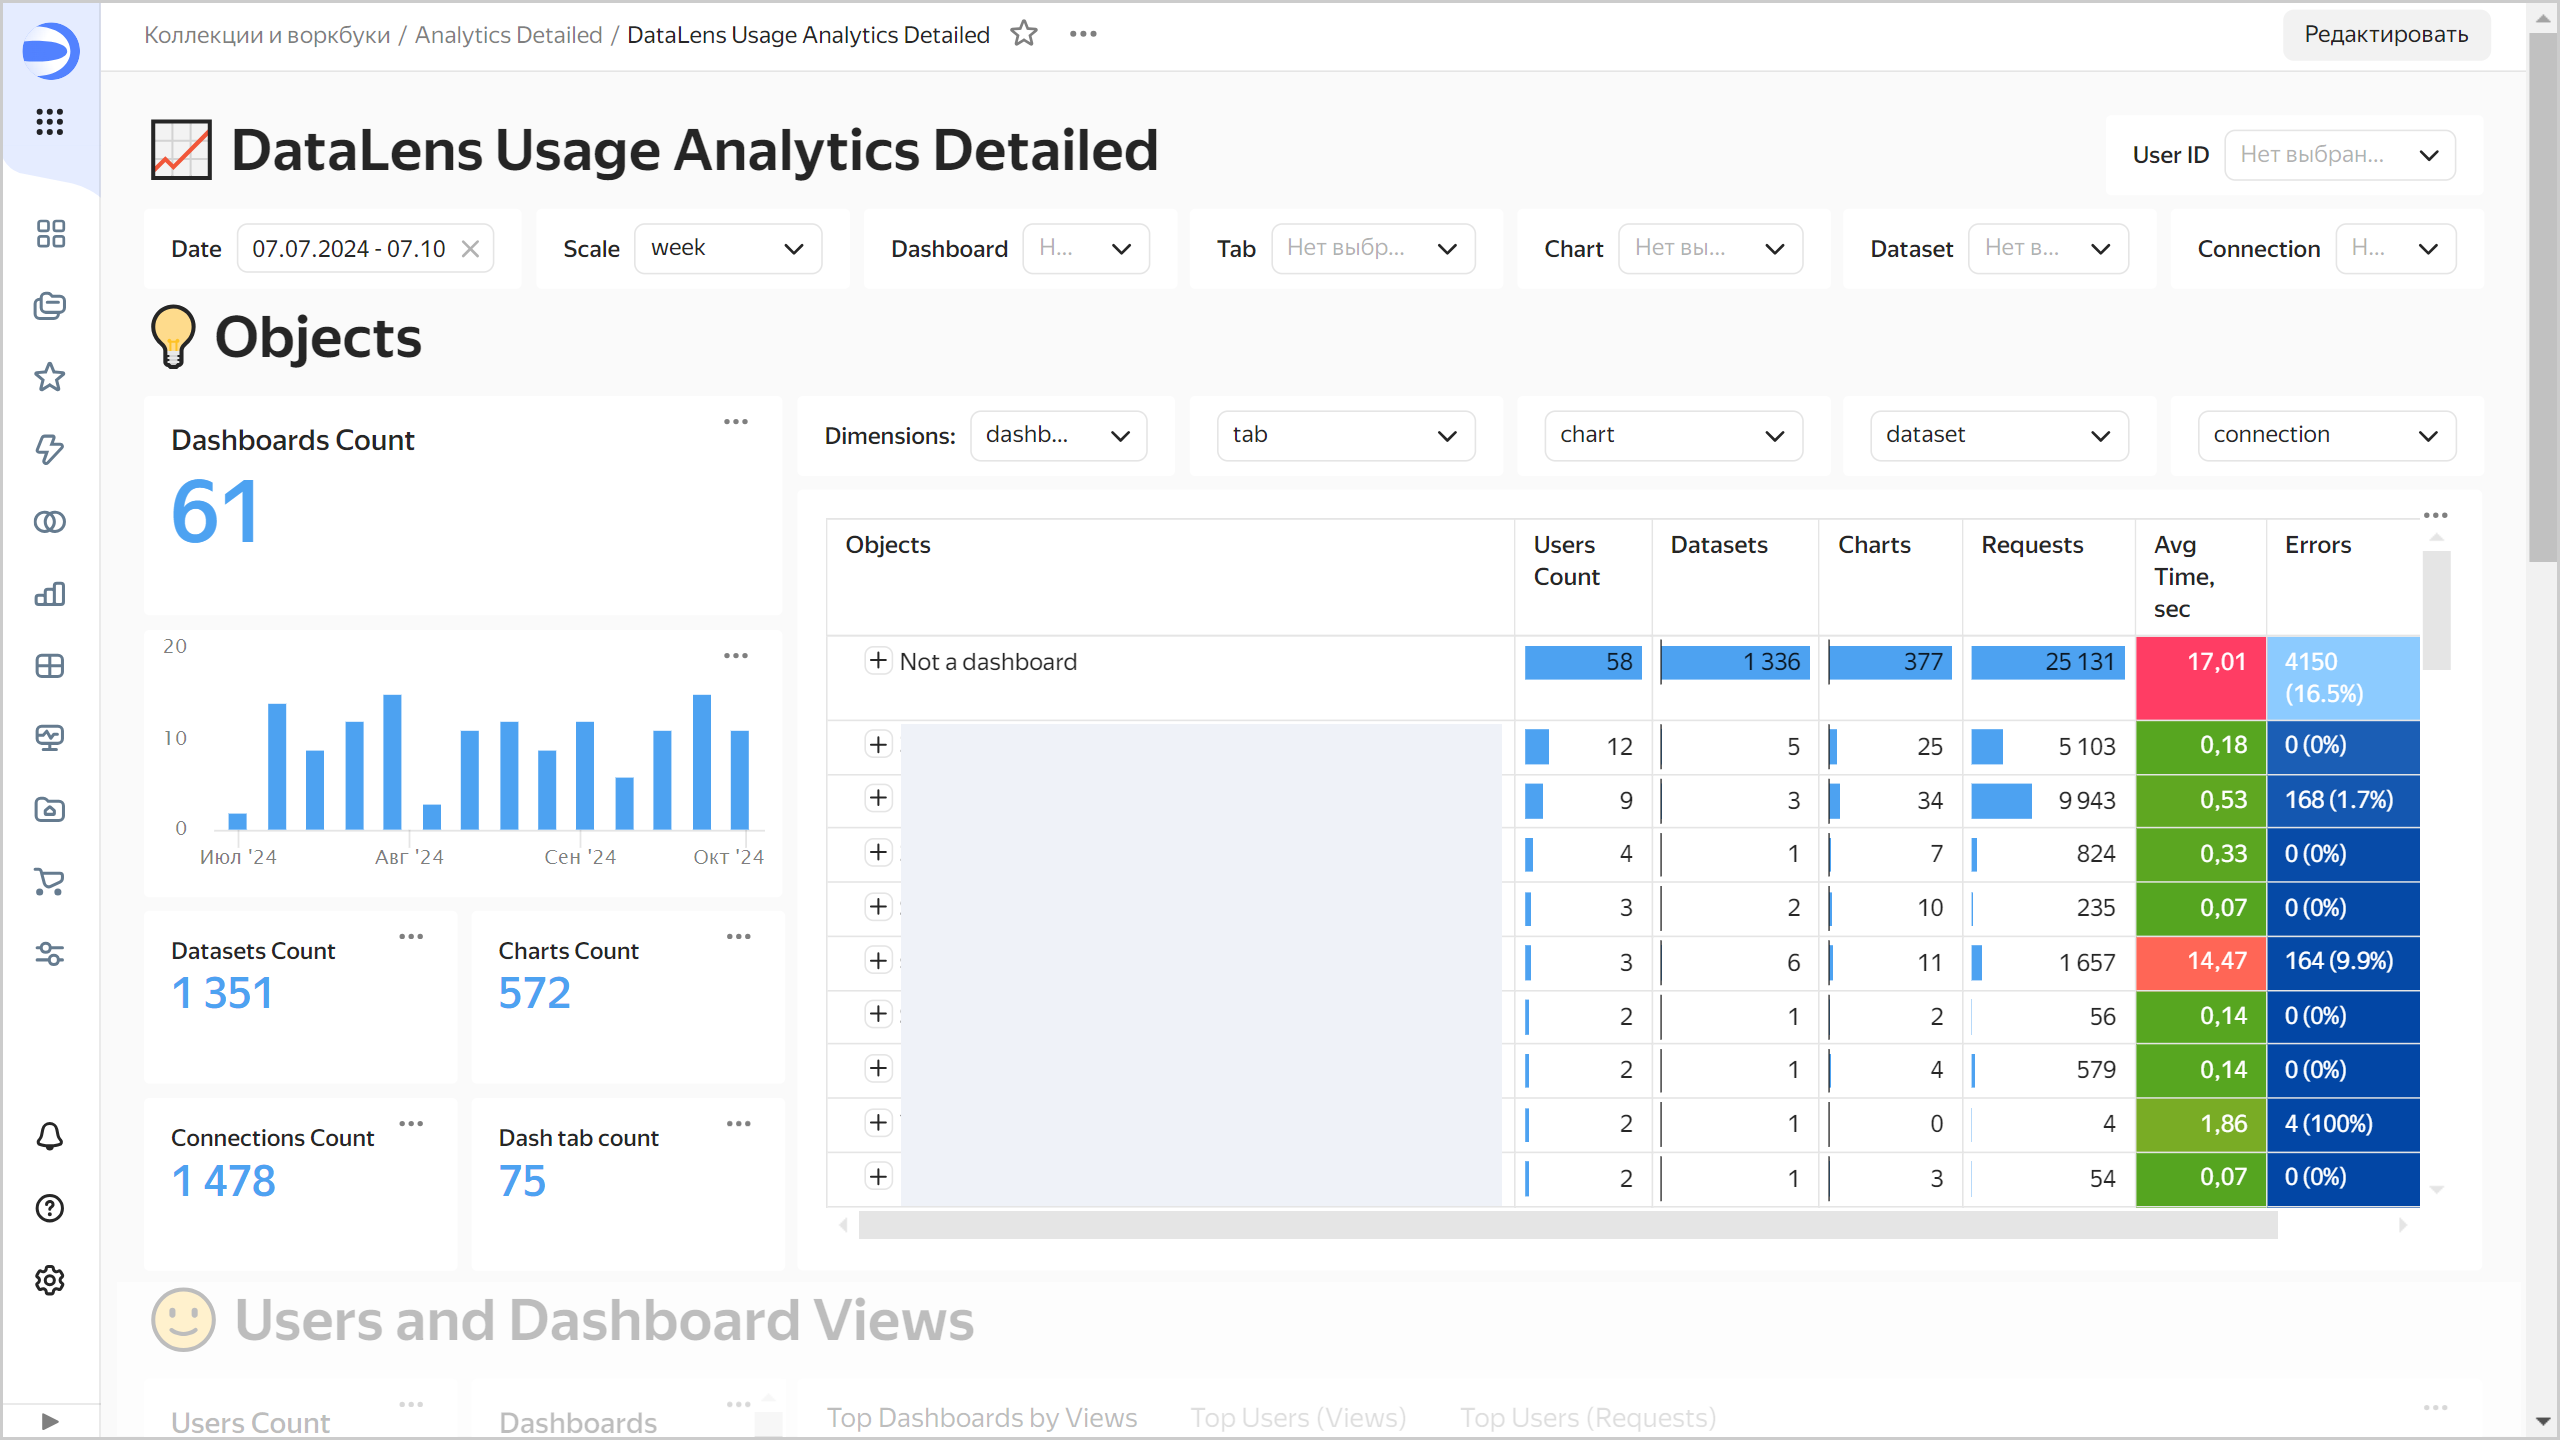
By default, objects in a hierarchy are sorted from a dashboard to a connection. In
Dimensions, you can customize the hierarchy, e.g., sort objects in reverse order, from a connection to a dashboard. For each object in the hierachy, you can view the following:Users Count: Number of users querying the object.Datasets: Number of linked datasets.Charts: Number of linked charts.Requests: Number of queries.Avg Time, sec: Average object query time.Errors: Number and percentage of errors.Lvl 1: Link to the top-level object in the hierarchy.
-
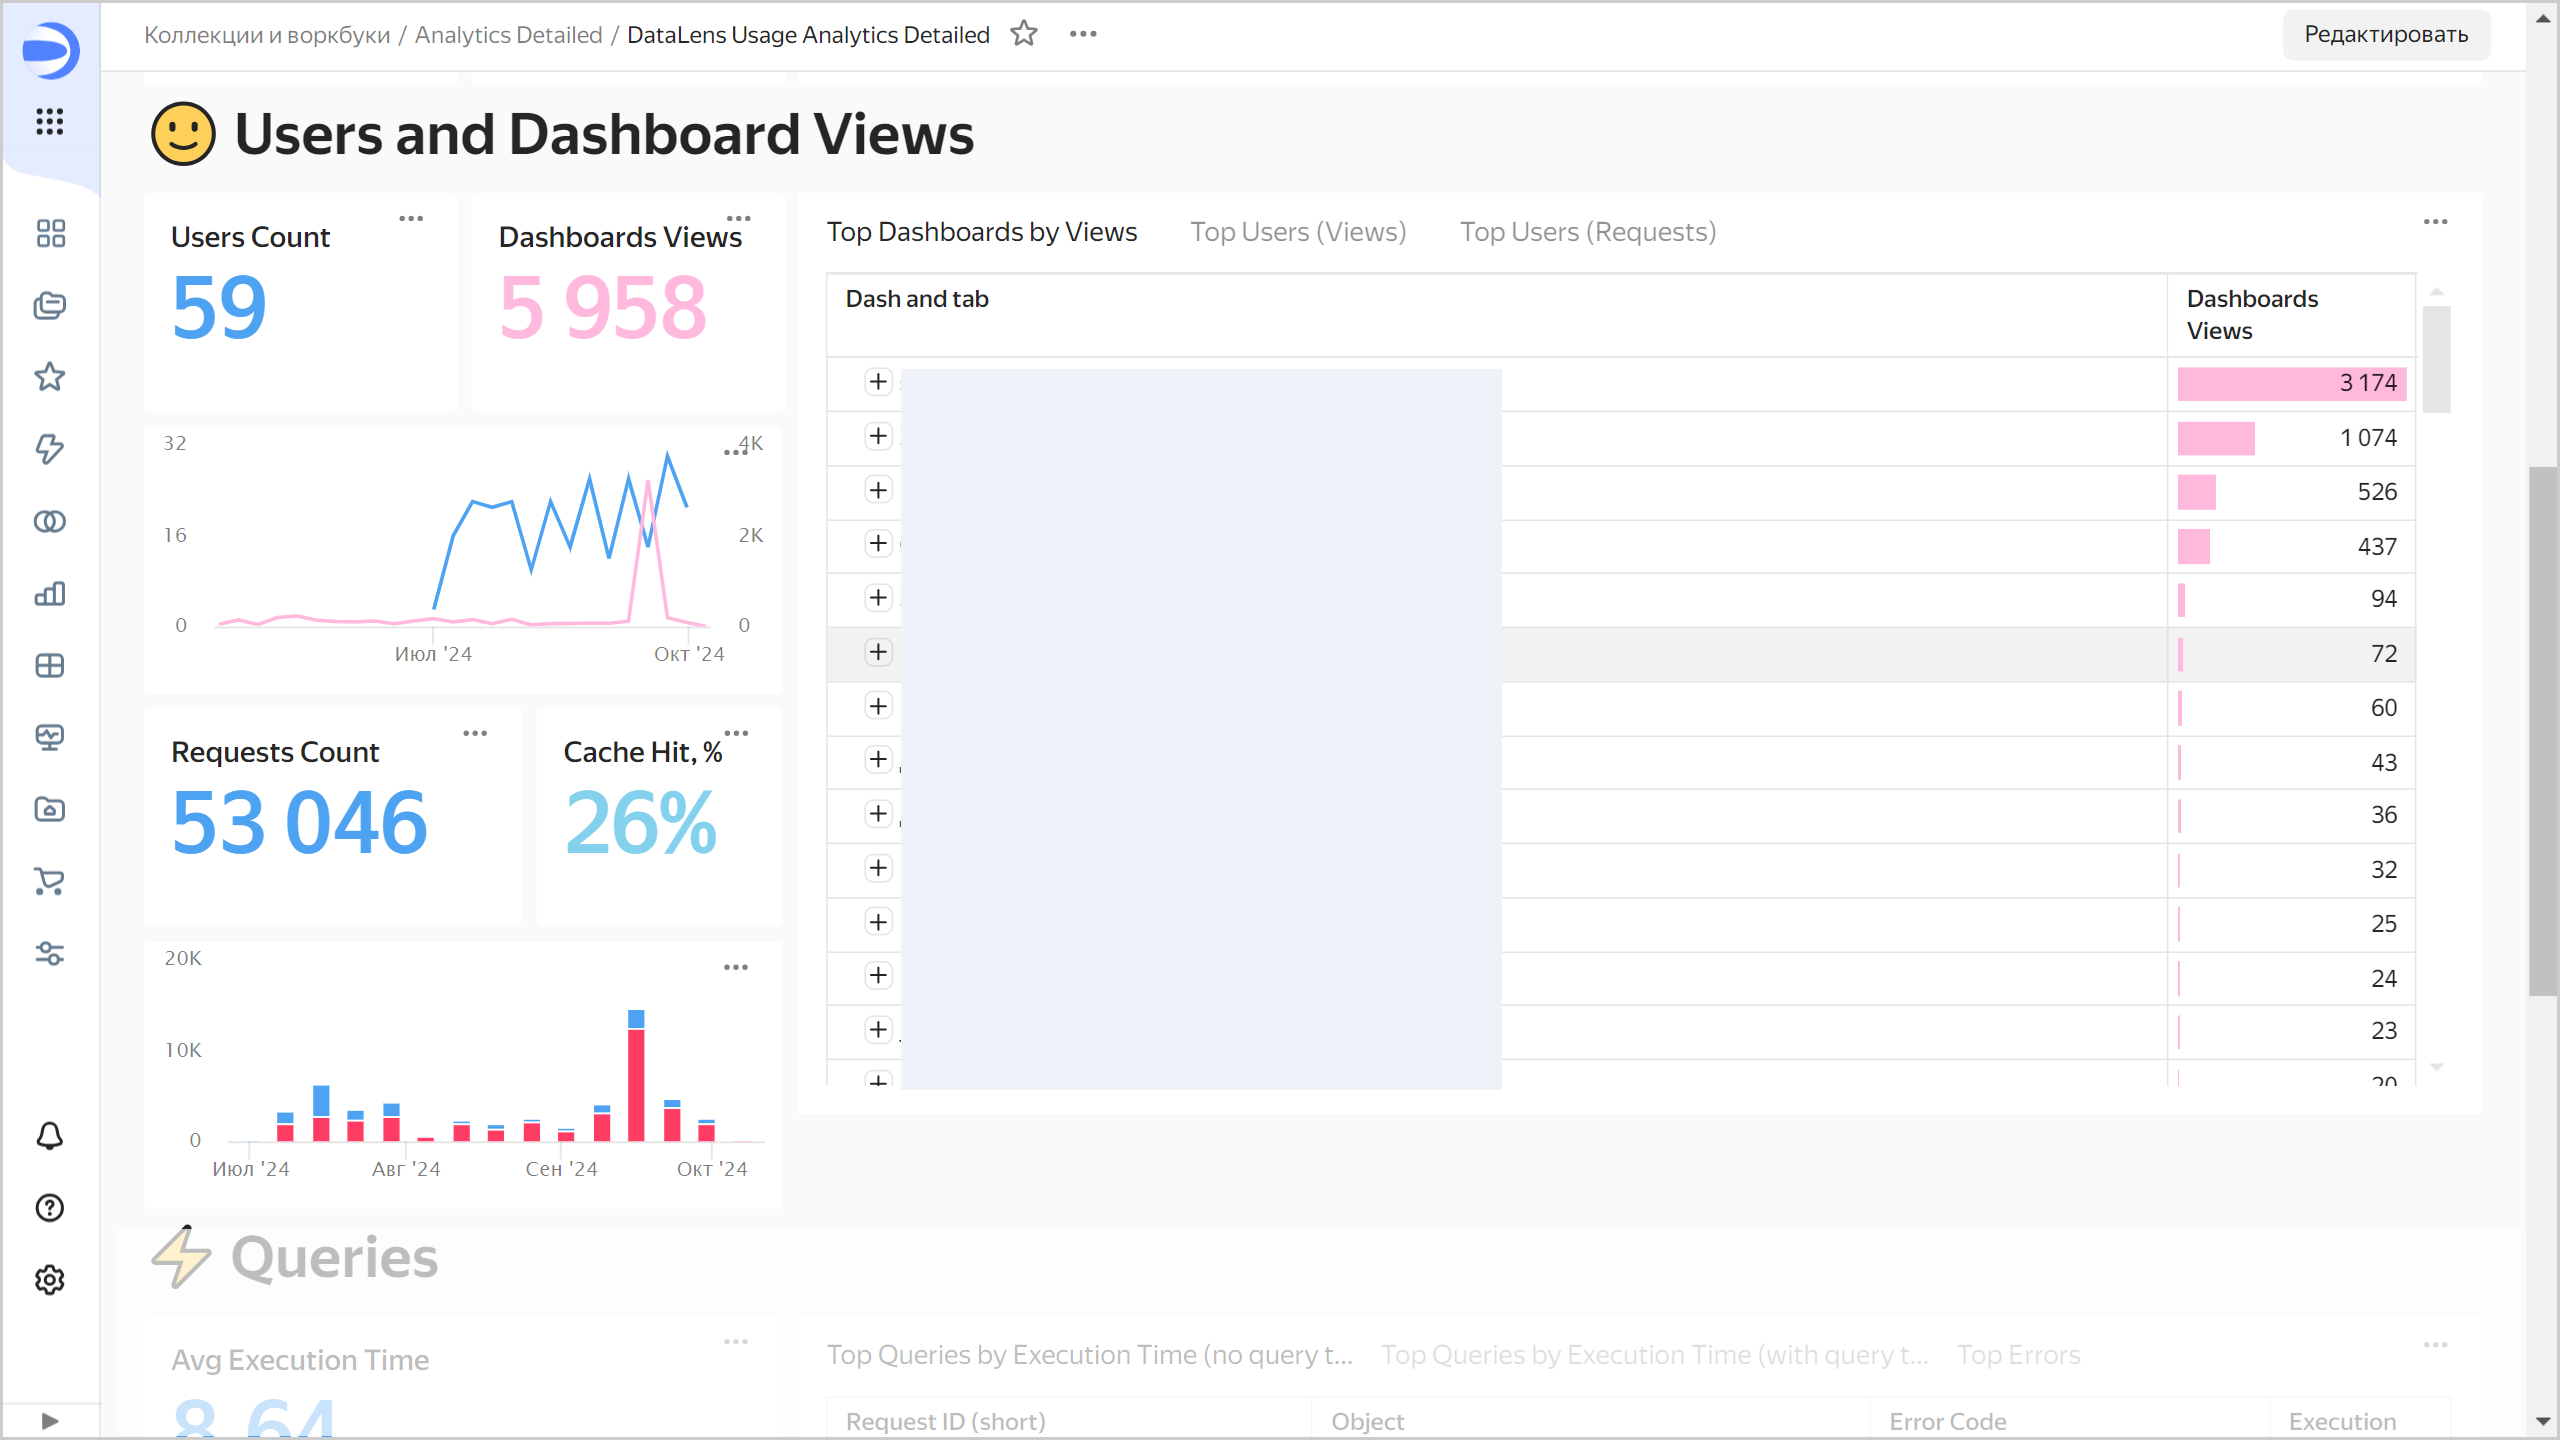
Users and Dashboard Views: This section displays the following information:
- Number of active users:
Users Count. - Number of dashboard views:
Dashboards Views. - Number of queries:
Requests Count. - Percentage of queries utilizing cache data:
Cache Hit. - Dashboards that are viewed.
- Users that access your objects.
The tabs provide information by both views and queries.
Users and Dashboard Views section
- Number of active users:
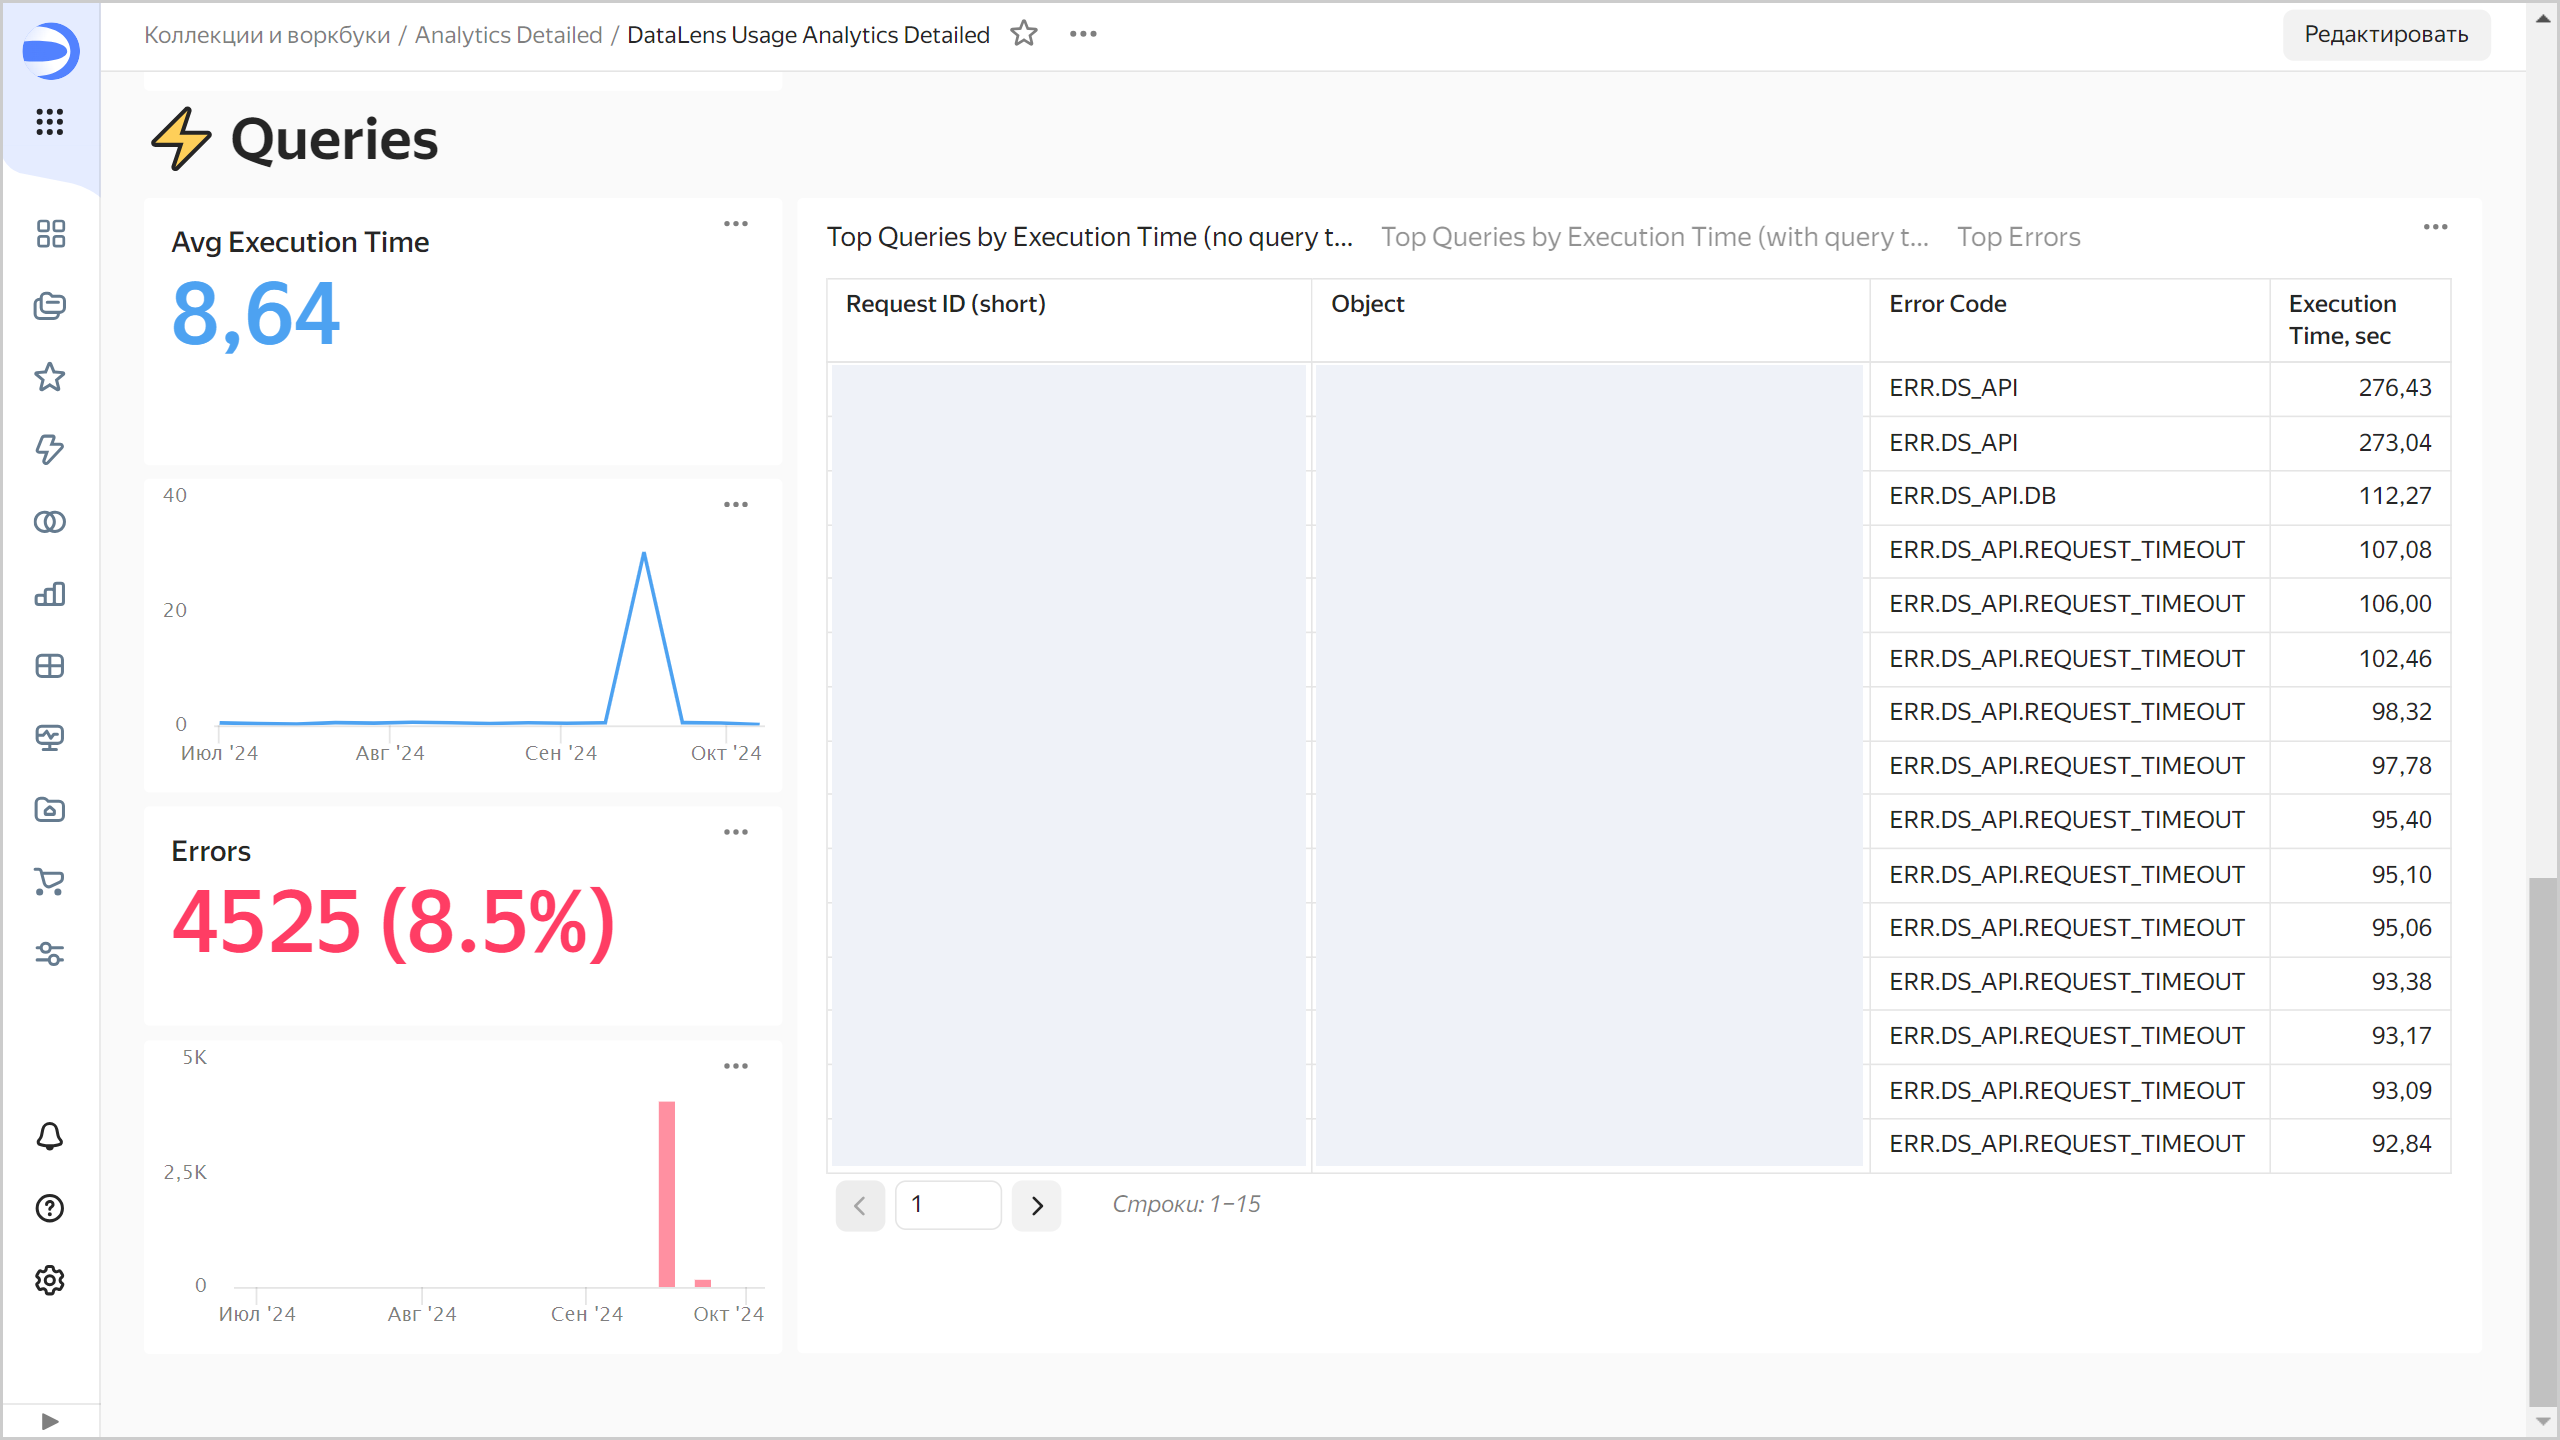
-
Queries: In this section, you can view the average query execution time, number of errors, and detailed info about specific queries:
- Query ID
- Execution time
- Query date and time
- Query text sent to source
- Error code
Queries section