Tracking (un)detectable particles
Tracking (un)detectable particles
How neural networks help track and respond to volcanic ash clouds
Volcanic ash clouds hamper transport accessibility, cause public health problems, and affect the natural ecosystem. We developed a service that helps track the spread of volcanic ash and eliminate the consequences of eruptions. The technology is already in use with volcanoes in Kamchatka.
How volcanic ash clouds affect people’s lives
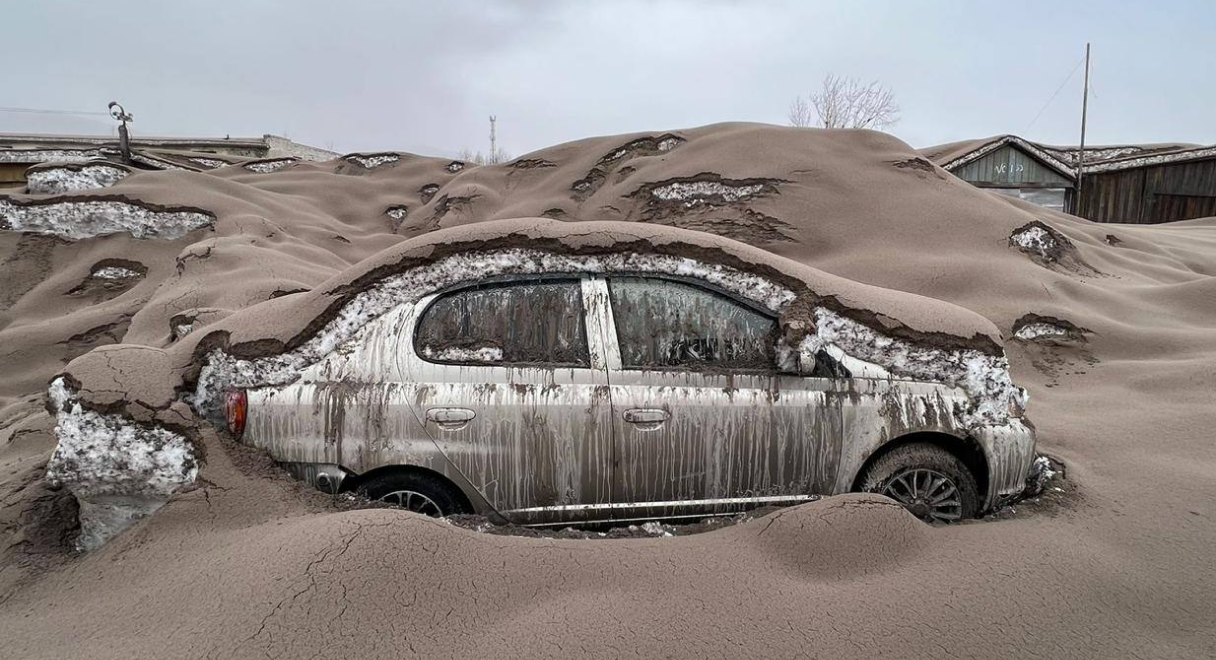
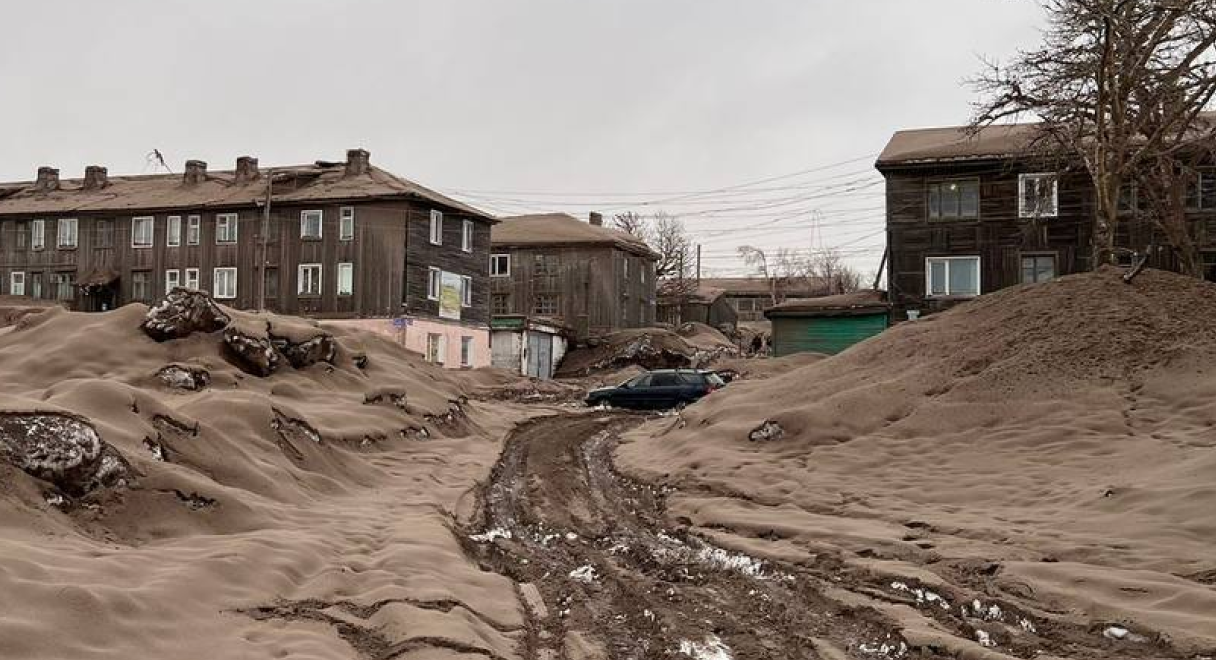
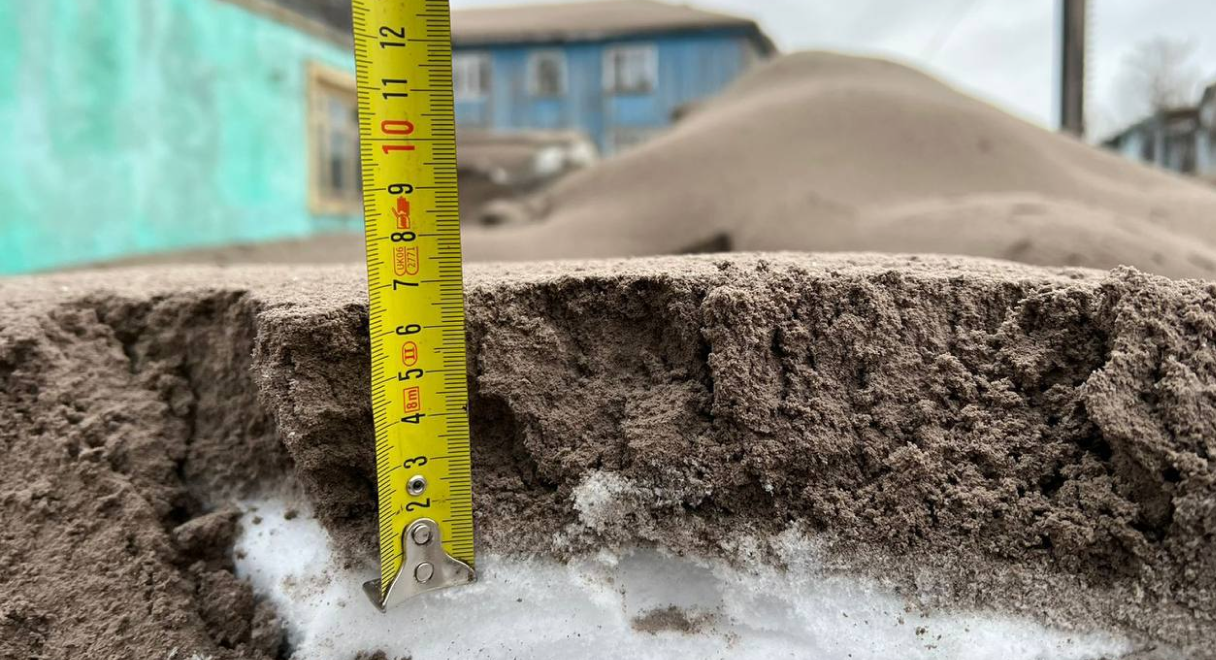
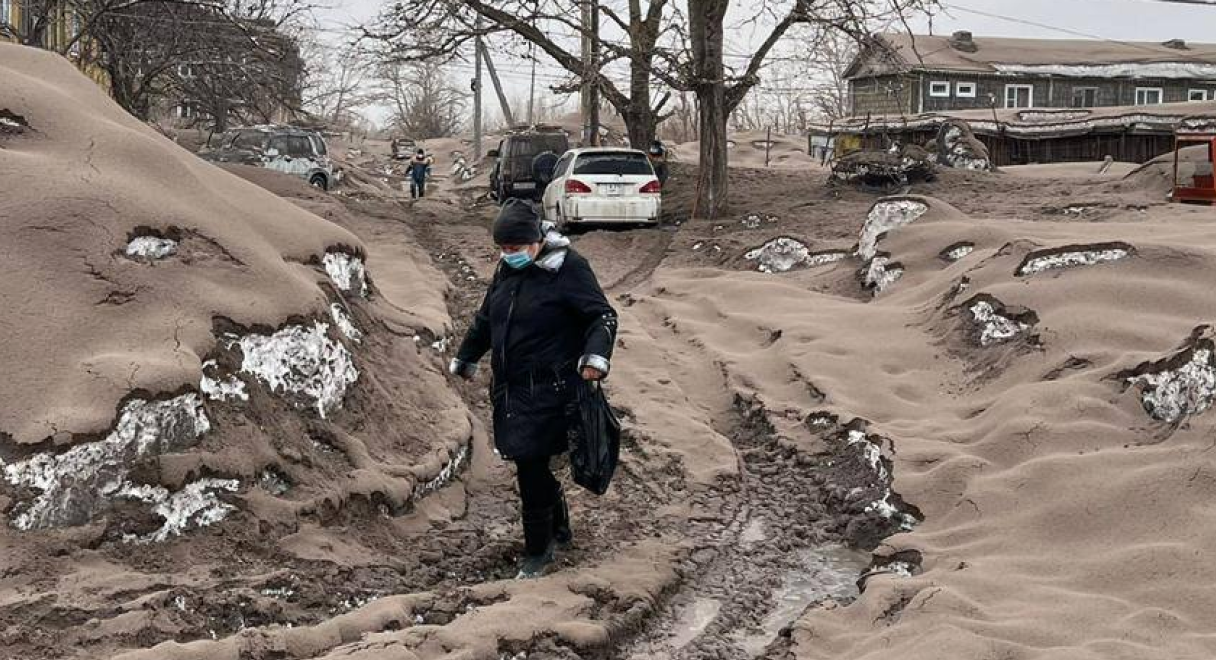
Volcanic ash presents a significant hazard, affecting regions across the globe with far-reaching consequences. Recent eruptions of Indonesia’s Mt. Merapi, Iceland’s Fagradalsfjall, and Russia’s Shiveluch have resulted in extensive ash emissions, causing disruptions to daily life and posing risks to public safety and infrastructure. At the same time, they have highlighted the need for effective mechanisms to monitor volcanic ash emissions, coordinate responses to them, and minimize their effects.
How we help predict the spread of volcanic ash faster
Specialists at the Geophysical Service of the Russian Academy of Sciences study volcanic activity, including ash fall, using information about emissions to conduct scientific research and inform international aviation authorities. In Kamchatka, the Ministry of Emergency Situations and local municipalities monitor ash fall to rapidly carry out rescue operations and keep the population informed.
Today, artificial intelligence and mathematical models have made it possible to fully automate the monitoring of the spread of volcanic ash clouds. A team of specialists at Yandex Cloud, Yandex Weather, and students of the Yandex School of Data Analysis have developed a service for tracking and predicting the spread of volcanic ash clouds for a 24-hour period. Using these technologies, rescue services can react more rapidly to eradicate the effects of ash emissions. The service is flexible and can be adapted to forecast ash emissions for any point on the globe. Here’s how we did it:
Training ML models
The Geophysical Service of the Russian Academy of Sciences gave us access to archives with historical data and video materials they have been gathering since 2000. Along with students of the Yandex School of Data Analysis, we used this date to train an ML model in Yandex DataSphere that would then analyze video materials, recognize the beginning of an eruption, and determine the height and direction of the ash cloud.
Image analysis
We transmit video from several cameras near volcanoes to the ML model in real time. When an explosion occurs, the model assesses the emission class and its height, and transmits this information to the particle scatter model.

The particle scatter model
The Yandex Weather service generates a table with data on the time of the emission, its coordinates, and the height and the concentration of the cloud. Specialists from the company Geontellect then visualize this information in Yandex Maps.
Visualization and additional analytics
The map can show you the spread of ash from seven volcanoes in the Kamchatka region. In addition, we have developed dashboards in the Yandex DataLens service with detailed information about emissions.

Who can the service help?
The service works in the format of an interactive map. It is important to note that while it is impossible to predict the moment an ash cloud will be released, when one happens, you can view the cloud on the map, and track and forecast its movement over the following 24-hour period. This tool can be of use for administrative services and geophysicists to quickly respond to the consequences of volcanic ash.
The service can also be useful for:
- scientific organizations and universities involved in the study of historical ash fall data
- travel companies and individual tourists planning routes, e.g., for hiking or jeeping
- anyone interested in technology and environmental issues.
The service can also be adapted to monitor the spread of industrial gas emissions.
How does the map work?
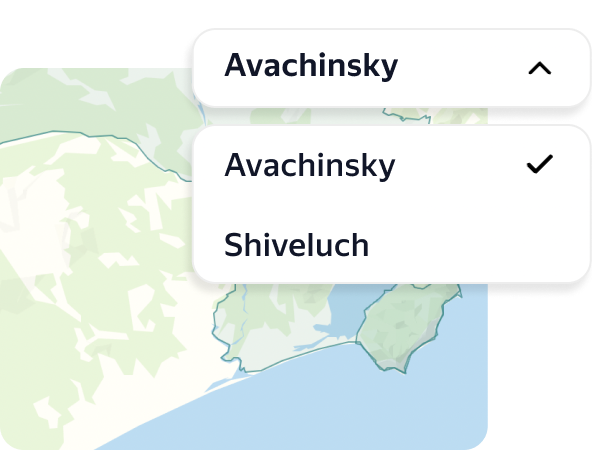
Select a volcano
Select a volcano in Kamchatka to view its data.

Add additional parameters
Use the calendar to mark the dates of the period for which you want to view the ash clouds’ height and spread.
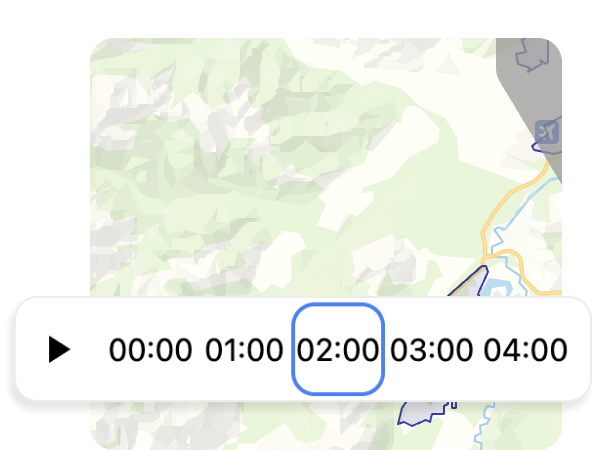
Choose a time
The timeline below helps determine how the ash fall spread each hour over a 24-hour period.
Example
If you select 02:00, you will see information related to the ash cloud two hours after the initial eruption. Information about the moment of the emission can be found, for example, on the site of the Geophysical Service of the Russian Academy of Sciences. If an ash release has just occurred, then we offer a prediction of the cloud’s movement over the next 24 hours.
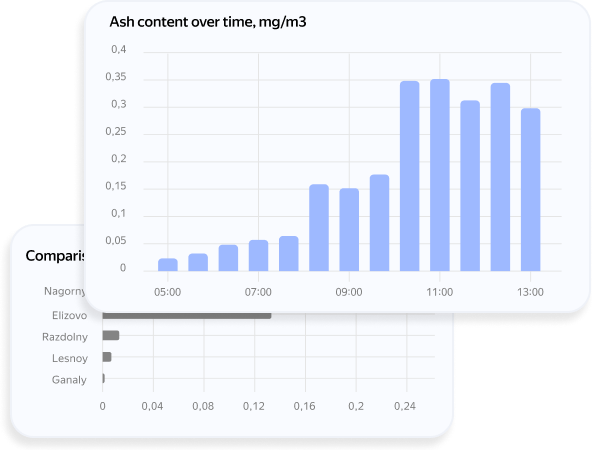
View the details on the DataLens dashboard
The dashboard in Yandex DataLens can help you analyze ash clouds’ content and movement in more detail.
Other projects
Yandex Cloud releases neural network for monitoring Lake Baikal ecosystem in open source

