Processing Yandex Audit Trails events
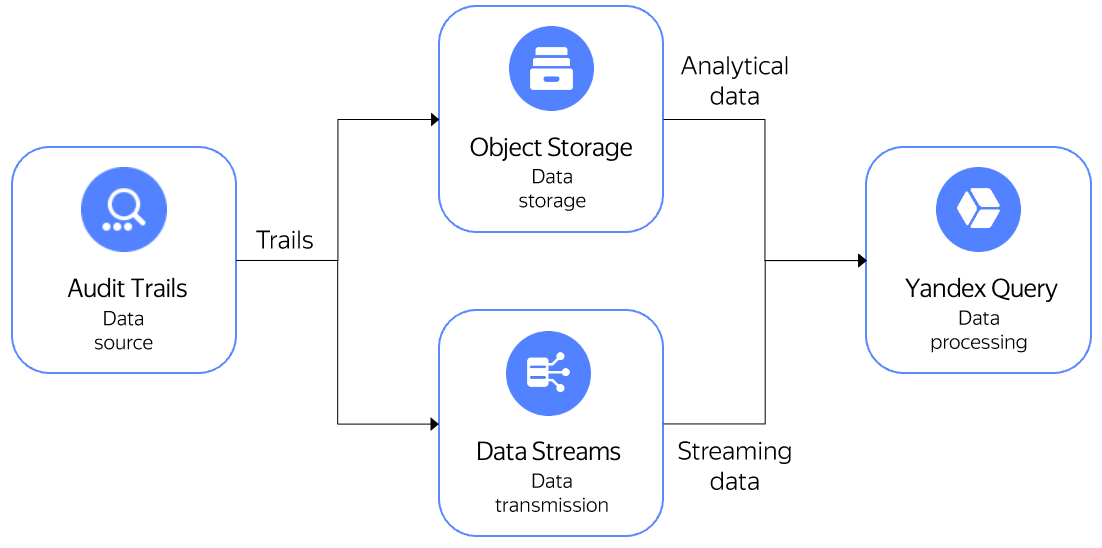
Yandex Audit Trails is a service for collecting and exporting audit logs of Yandex Cloud resources to various target systems, including Yandex Object Storage and Yandex Data Streams. Audit Trails and Yandex Query work together to enable searching through audit logs.
Using Query to process audit logs allows you to get the following information:
- Who deleted a cloud folder.
- Who enabled access to a Yandex Compute Cloud VM serial console.
- Who edited access permissions for an Object Storage bucket.
- Who was granted admin privileges.
You can find the preset queries for these use cases in this GitHub repository. You can also write custom YQL queries.
In this use case, you will create trails that will upload audit logs of all folder resources to the Object Storage bucket and send them to the stream in Data Streams. Next, you will run analytical and streaming queries to the log data using Query.
Getting started
Sign up for Yandex Cloud and create a billing account:
- Navigate to the management console and log in to Yandex Cloud or create a new account.
- On the Yandex Cloud Billing page, make sure you have a billing account linked and it has the
ACTIVEorTRIAL_ACTIVEstatus. If you do not have a billing account, create one and link a cloud to it.
If you have an active billing account, you can create or select a folder for your infrastructure on the cloud page.
Learn more about clouds and folders here.
Configure Audit Trails
- To upload folder audit logs to the Object Storage bucket.
- To send folder audit logs to the stream in Data Streams.
Set up integration between Audit Trails and Query
To set up integration:
- Open the list of trails in the Yandex Cloud console.
- Select the trail you previously created for uploading cloud audit logs to the bucket and click Process in YQ.
- When switching from Audit Trails to Query for the first time, set up integration:
- In the Query interface, select the service account you want to use to read data from Object Storage in the connection creation dialog and click Create.
- In the Query interface, check the preset parameters by clicking Preview in the binding creation dialog. Next, click Create to complete the integration.
This will automatically redirect you to the Audit trails panel of the Query interface.
Perform similar actions for the previously created trail for sending data to the stream in Data Streams.
Analytical queries to Object Storage data
To query Audit Trails analytical data stored in Object Storage:
- Under Audit trails in the Query interface, select Analytical as the data analysis type. In the list of data bindings, select
audit-trails-test-object_storage. - Select the query to Object Storage data from the list and click Run.
You can do the following with analytical query results:
- Download them through the Query user interface by clicking Export.
- Save them to an Object Storage bucket.
- Get and process them via the Query HTTP API.
Streaming queries to Data Streams data
To query Audit Trails streaming data transferred through Data Streams:
- Under Audit trails in the Yandex Query interface, select Streaming as the data analysis type. In the list of data bindings, select the one you need.
- Select the query to Object Storage data from the list and click Run.
You can do the following with streaming query results:
- Send them to Yandex Monitoring as metrics.
- Send them to an output stream in Data Streams as data and then process the data using Yandex Cloud Functions triggers.