Adding a widget to a dashboard
Dashboards are visual panels that allow you to quickly assess the status and performance of your cloud resources. You can use ready-made dashboards offered by various services or create your own one.
A dashboard consists of widgets that allow displaying various types of information: a chart, alert, or escalation. There are also widgets that help you organize information on a dashboard, i.e., a title, text, and section.
Adding a widget to a dashboard involves the following steps:
- Open a dashboard or create a new one.
- At the top right, click and select the widget you want to add.
- Specify the widget settings.
- Click Save at the top right.
You can move widgets around the dashboard and resize them.
Chart
A chart allows you to visualize metric changes over time. You can configure charts on the dashboard or add them from the Metrics section.
- Click Graph.
- Configure the chart by specifying queries and visualization of metrics.
- Optionally, add parameters and configure chart repetition.
- Click Save.
Chart parameters
The steps you take to configure charts on the dashboard or in the Metrics section are the same.
To configure a chart:
-
Click near the chart and select Edit.
-
At the top right of the chart panel, click Settings.
-
Set the chart parameters listed below.
The parameters you enter will apply to the chart immediately so you do not need to save them.
-
Close the side panel after you complete the configuration.
Thresholds
Use this setting to display lines for critical or target values. You can set the thresholds in the chart settings menu or update the JSON file:
- Under Thresholds, click Add threshold.
- Specify a numeric value for the threshold. To specify a fractional value, use the dot as the decimal separator, e.g.,
9.75. - Select the threshold color.
- Enable or disable Show on graph. This option applies to all thresholds.
-
At the top of the dashboard, click Settings.
-
Select JSON.
-
In the widget parameters, update the values in the
thresholdssection."widgets": [ ... "thresholds": { "items": [ { "color": "#d63232", "value": 9.75, "_value": "value" }, ... { "color": "#92db00", // Basic threshold } ], "showMode": "CONSTANT_LINE" }Note
Thresholds must have a basic value, which is set in the
itemselement withoutvalue. All other thresholds must have a numericvalue. -
Click Apply.
Links
You can add a link to an external resource or dashboard.
-
Under Links, click Add a link.
-
Enter the link title to display on the chart.
-
Select External link and enter the link text in
http(s)://<address>format. You can add a link to any website or an external resource. -
Select Dashboard and specify:
- Cloud and folder where the dashboard resides. The list contains all clouds and folders you have access to.
- Dashboard to open via the link.
- Share timeframe. The chart will share the timeframe of the source chart.
-
Enable or disable the Open in new tab option.
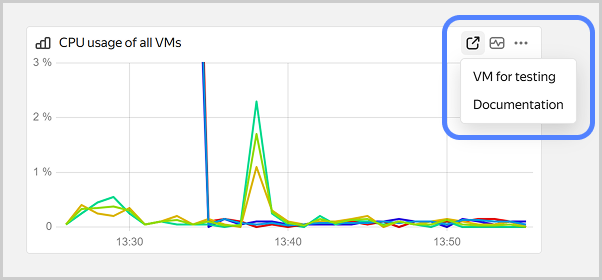
The links you add will appear in the top right chart in the menu.
Alert
Use the alert widget to display the current alert status on a dashboard. To add such widget to a dashboard, create an alert first.
- Click Alert.
- Select an alert from the list and enter a title for it.
- Click Save.
Escalation
Note
Escalations are at the Preview stage and subject to the following limitations:
- Maximum concurrent escalations: 10
- Maximum active calls: 1
- Maximum calls per minute: 5
- Maximum calls per calendar month: 10
To change these limitations, contact support.
This dashboard widget displays running escalation instances from the same escalation policy. To add such widget to a dashboard, create an escalation policy first.
- Click Escalation.
- Enter a title for the escalation.
- Select an escalation policy from the list.
- Optionally, specify whether the dashboard should display all escalations or only those currently running.
- Optionally, enter the maximum number of escalations that can be displayed on the dashboard.
- Click Save.
Text
Use this widget to add a text comment to a dashboard. It supports text formatting, lists, headers, cuts, links, code blocks, images, and other elements.
- Click Text.
- Enter text in the input field. Format the text as needed.
- To add a link, image, code block, or another element, click and select the item you need.
- To enter text in Markdown format, click and select Markdown markup.
To exit the markup mode, click and select Visual editor. - Click Save.
Title
Titles allow you to visually separate widgets on a dashboard.
- Click Heading.
- Enter text in the input field.
- Select the title size. There are four available title levels.
- Click Save.
Section
A section allows you to group widgets on a dashboard and hide widget groups.
- Click Section.
- Drag widgets to the section.
- Click next to the section name and specify:
- Section name: Enter a name.
- Section state: Select whether to collapse or expand the section by default.
- Repeat by: Select a parameter to add sections with charts for each of its values.
- Click Save.
- Click Save.
To share a section, click next to the section name. A link to the section will be copied to the clipboard.