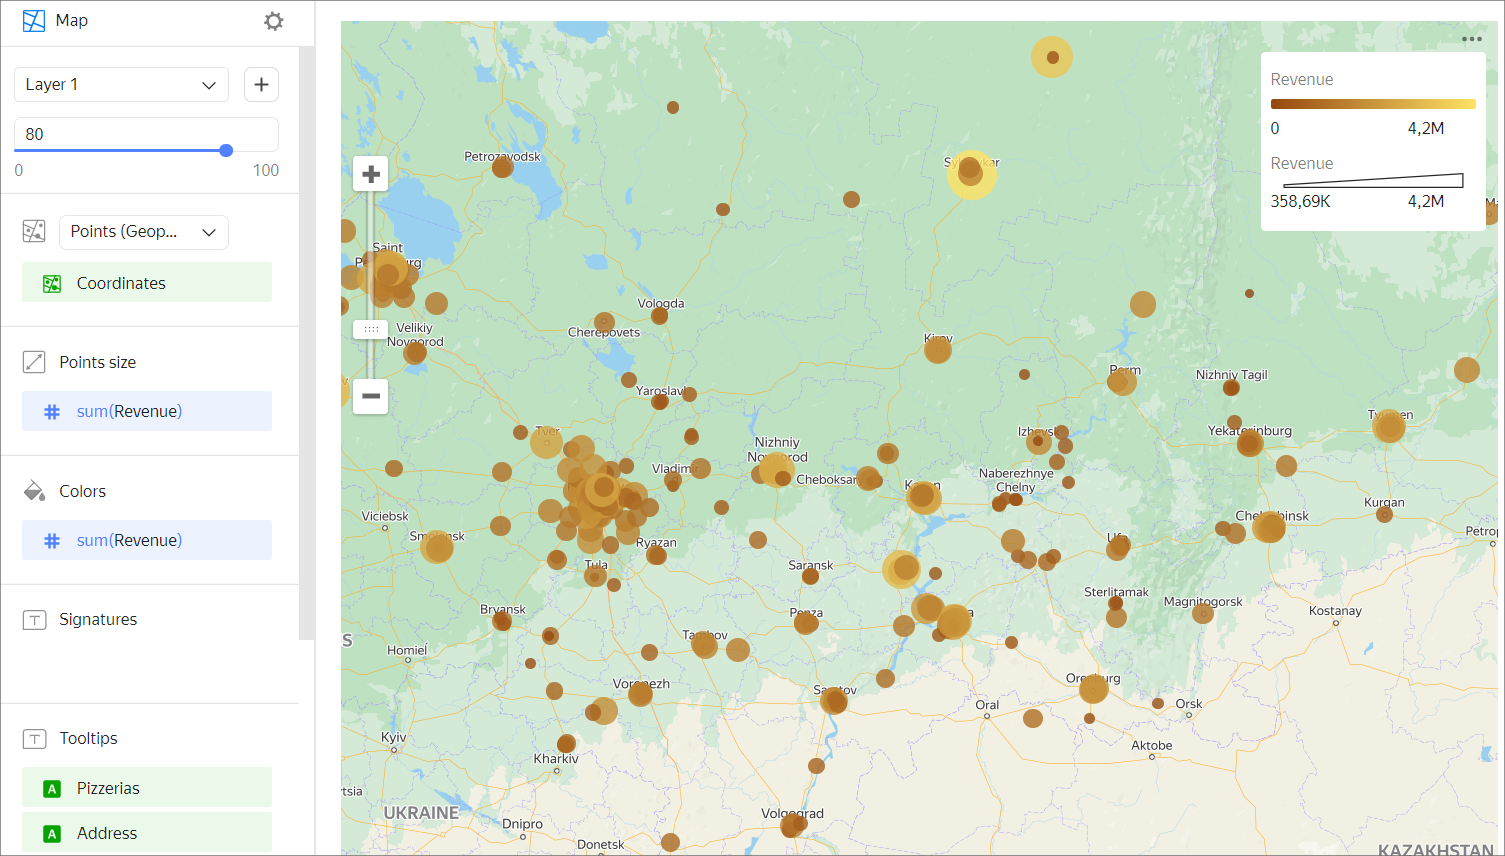
Point map in Yandex DataLens
Each point is plotted by its geographic coordinates.
-
Point size
Point size can represent the value of the measure: the bigger the point, the higher the value. This map type can also called the bubble map.
-
Point color
Different points colors mean that the points belong to different categories. Color intensity represents the value of the measure.
This map type is used to monitor the territorial distribution of points. For example, you can use the point map to plot stores and highlight the group of higher-profit ones.
Wizard sections
| Wizard section |
Description |
|---|---|
| Points (Geopoints) | Measure of the Geopoint type |
| Point size | Measure. Sets point size depending on the measure value. |
| Colors | Dimension or measure. Affects the intensity of point fill. |
| Labels | Measure. Displayed as text on a point. When used, point size control is blocked. |
| Tooltips | Dimension or measure. A tooltip that appears when you hover over a point. For String type fields, you can configure using basic Markdown in Yandex DataLens syntax: click the icon before the field name and enable Markdown. |
| Layer filters | Dimension or measure. Used as a filter for the current layer. |
| Filters | Dimension or measure. Used as a filter for the entire chart. |
Creating a point map
Warning
If you use the new DataLens object model with workbooks and collections:
-
Go to the DataLens home page. In the left-hand panel, select Collections and workbooks.
-
Open the workbook, click Create in the top-right corner, and select the object you need.
Follow the guide from step 4.
-
Go to the DataLens home page.
-
In the left-hand panel, select Charts.
-
Click Create chart → Chart.
-
At the top left, click Select dataset and specify the dataset to visualize. If you do not have a dataset, create one.
-
Select Map for the chart type.
- Select the Points (Geopoints) layer type.
- Drag a dimension of the Geopoint type from the dataset to the layer type selection section.
- Set the size of the points displayed on the point map. Drag a measure to the Point size section or click in the line with the section name.
- Color the points on the map. Move the measure or dimension to the Colors section.
- Add tooltips to show the dimension and measure values when hovering over a point.
Note
You can show a particular area on the map using the Center and Scale settings.
You can also:
- Add, rename, and delete a layer.
- Reorder the layers within a layer type.
- Apply a filter to the entire chart or one layer.
Recommendations
- Use color palettes corresponding to the goals and objectives of visualization.
- If the points are too clustered, lower their opacity. This will help you see where data intersects.
Use cases
- Analyzing sales and locations of pizzerias based on data from a ClickHouse® database and the DataLens Gallery
- Geocoding with the Yandex Maps API for data visualization in DataLens