Reports in DataLens
A report is a multi-page document in a specified format you can use as an interactive presentation or export to PDF and print. You can add charts, text blocks, headers, and images to report pages.
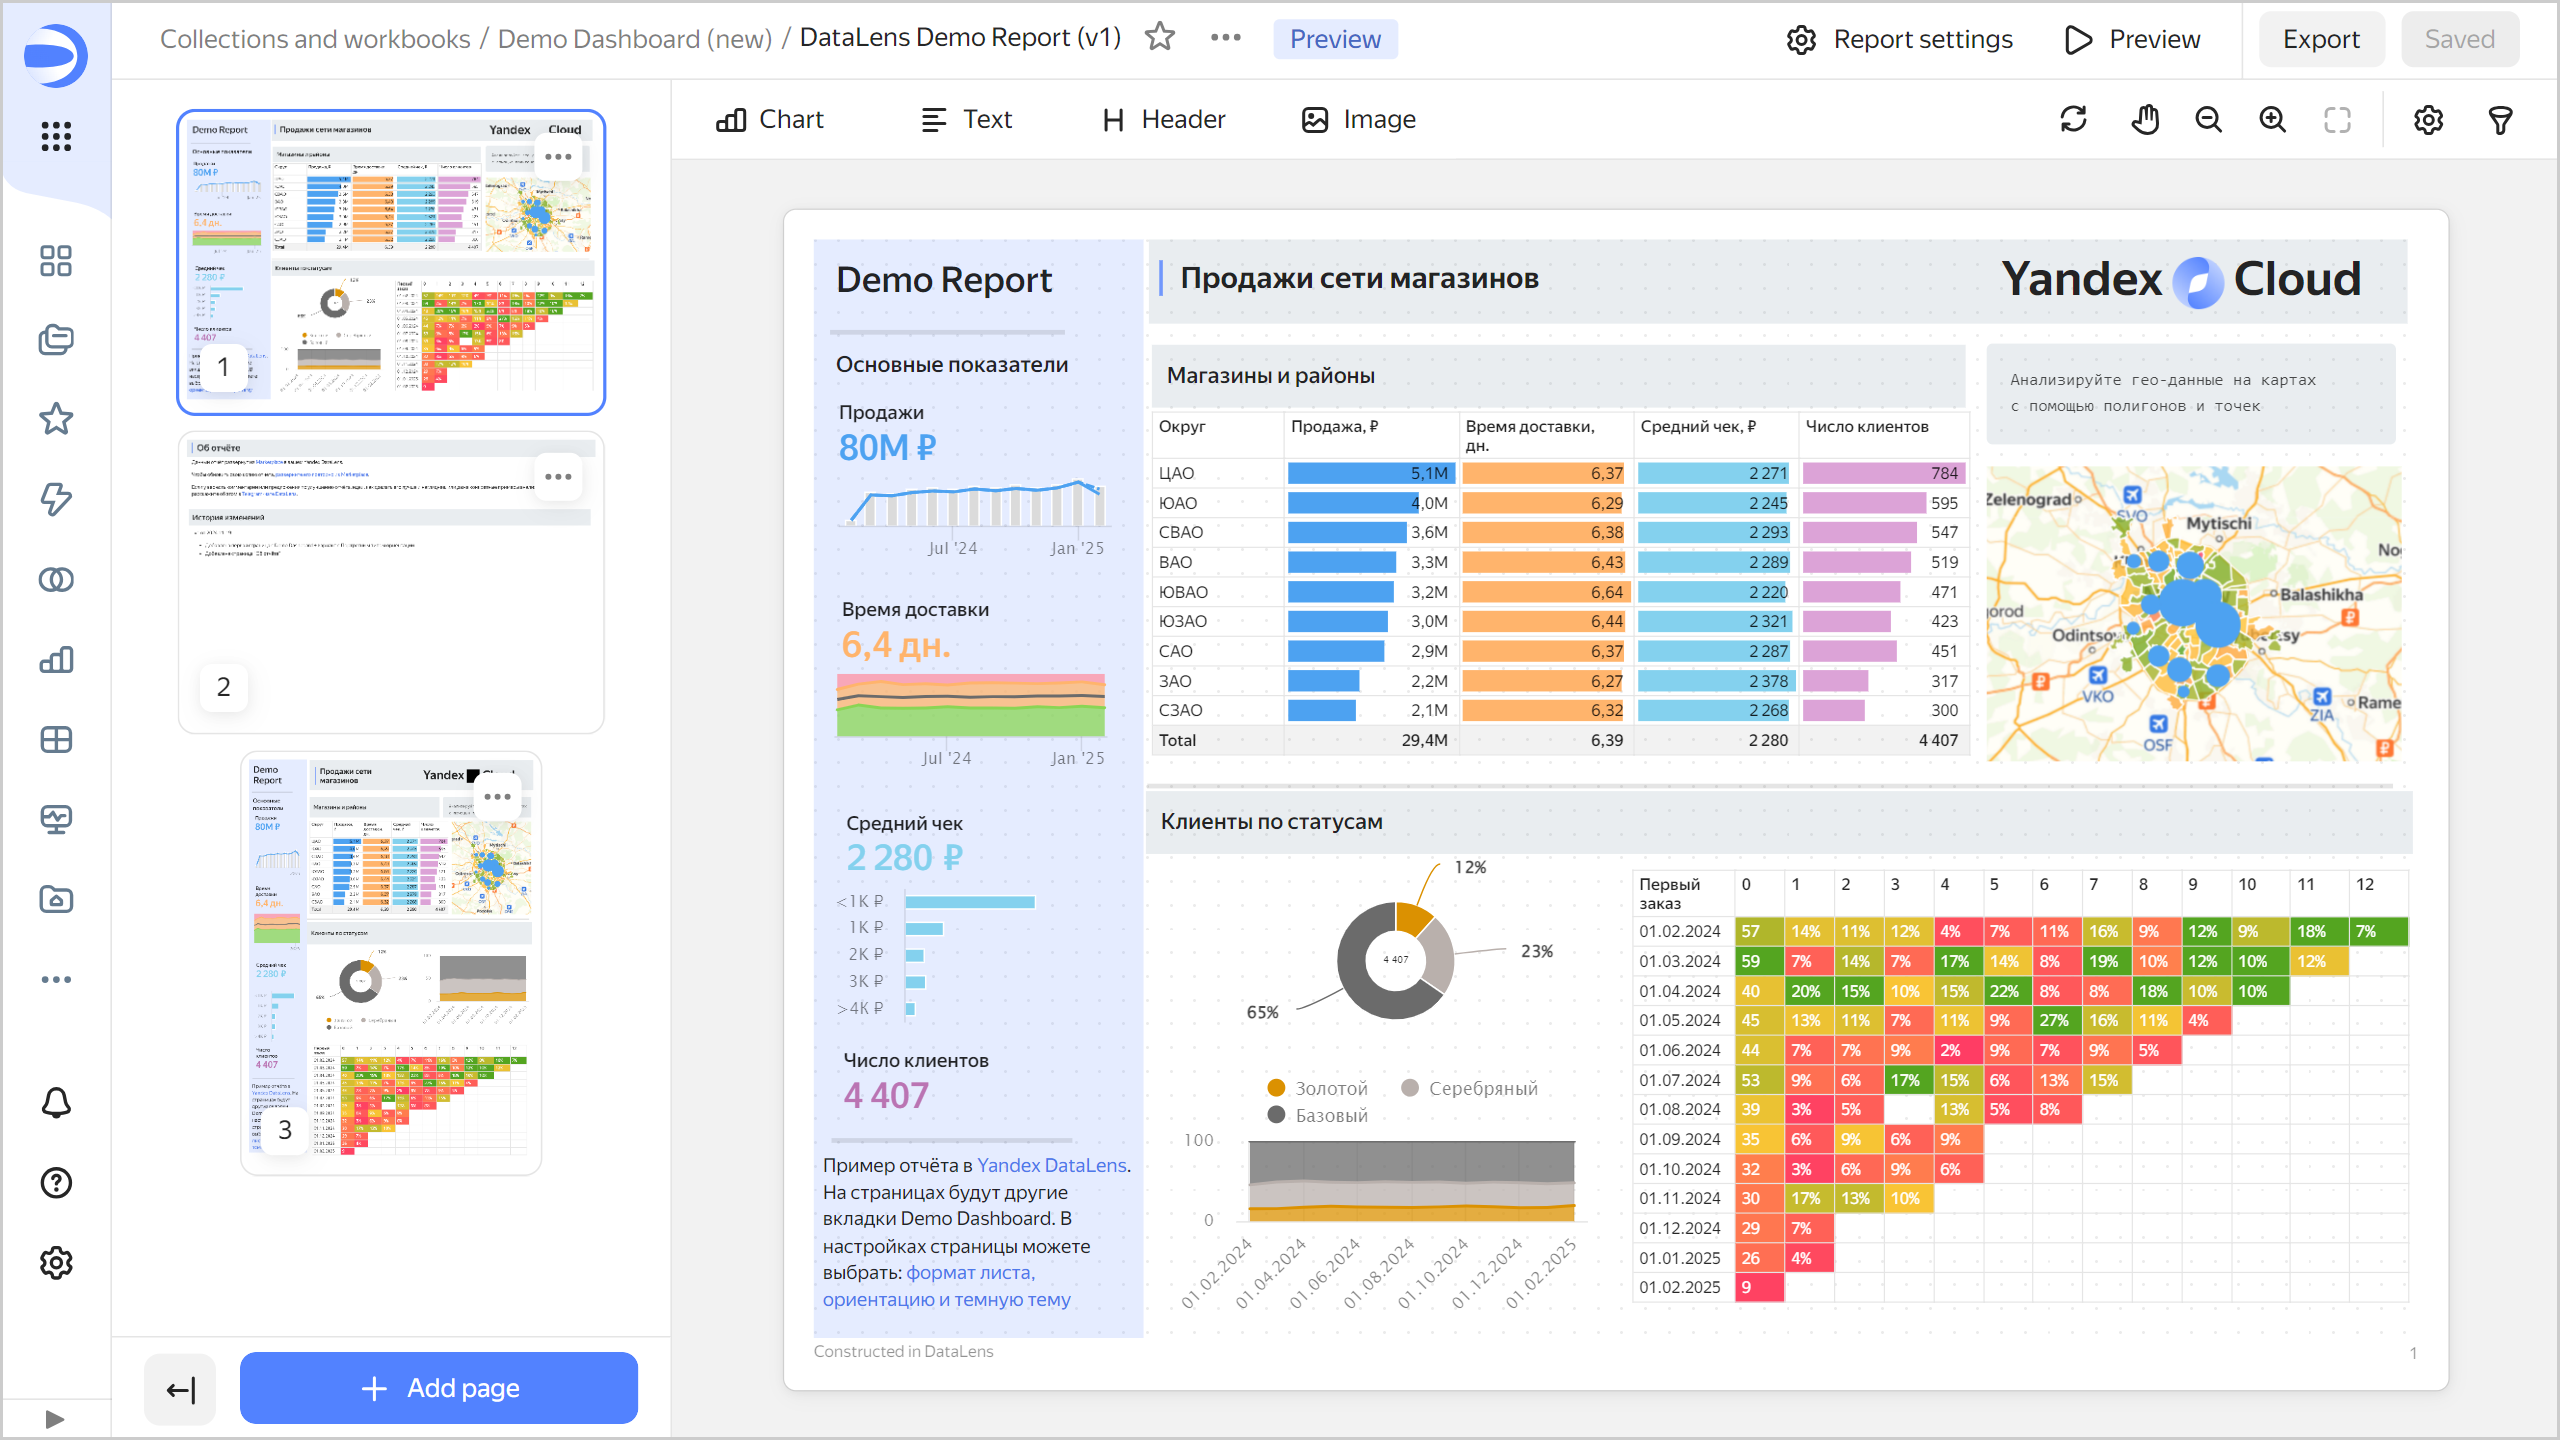
To view a report example, deploy the DataLens demo dashboard from DataLens Gallery:
- Click Use → Deploy.
- Choose where to save the workbook: workbook and collection root, existing collection, or new collection. Navigate to the saving location and click Deploy. The workbook name must be unique, so edit the name if you need to.
- Click Create. You will see the report example in the created workbook.
Join our Telegram community to explore more reports.
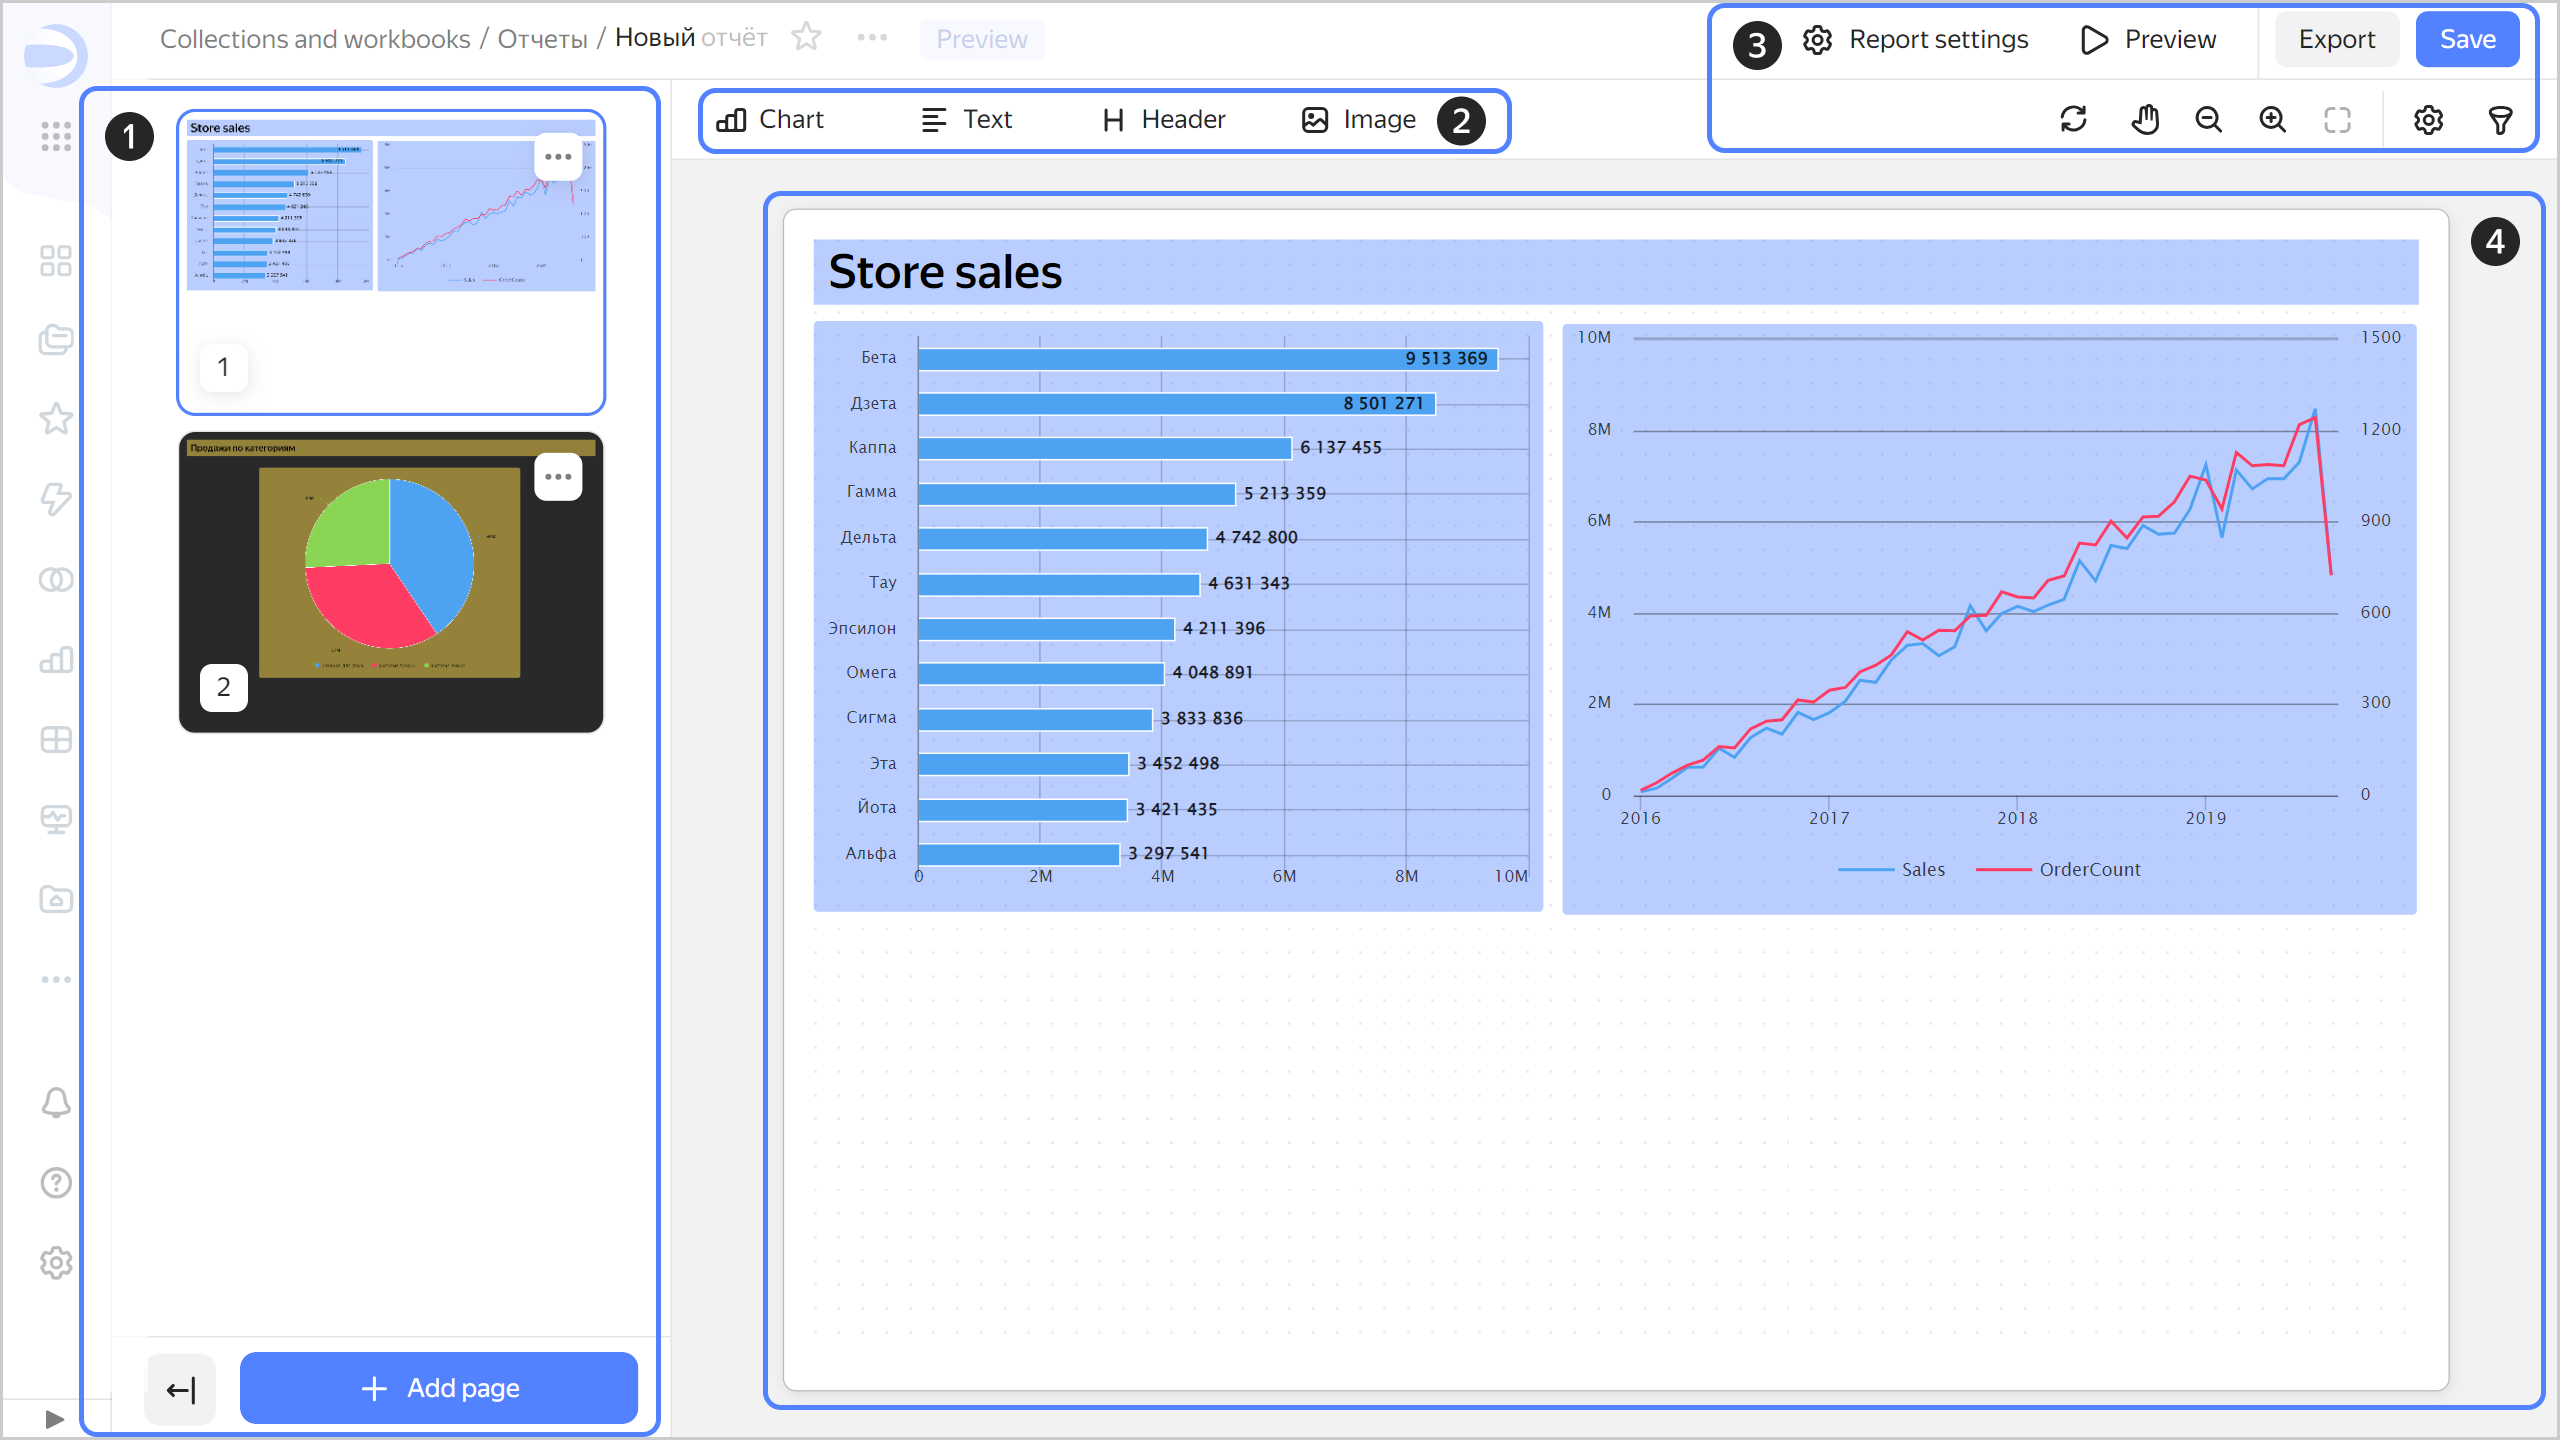
The report builder has these structural elements:
-
Report page preview area. Here you can manage the report pages: add, move, or delete them. To collapse the preview area, click . Instead of pages, their sequence numbers will be displayed. Click to expand the preview area and display the pages.
-
Panel for adding widgets to the report.
-
Basic controls:
- Report settings: Opens the report settings window.
- Preview: Opens a full-screen view of the report as document or presentation.
- Export: Exports the report in
.pdf. - Save: Saves the report.
- : Refreshes the report charts with applied parameters on the current page only.
- : Moves the report page around the screen. When clicked again, returns you to move widget mode.
- : Zooms out on the report.
- : Zooms in on the report.
- : Resets the report display scale and centers it on the screen.
- : Opens the current page settings window.
- : Opens the report selector settings window.
-
Area for working with the contents of the current report page.
Report widget features
The behavior and settings of report widgets are different compared to dashboard widgets:
- Widget height is set in the report editing window. Auto height adjustment is not supported.
- You can overlap widgets, move them to the foreground or background.
- You can set a background for any widget.
- When you paste a widget copied from a dashboard, it gets the default settings.
- Charts do not support tabs and filtering.