Configuring the display of null values in a Yandex DataLens chart
Note
This setting is only available for charts that have at least one X or Y axis:
- Line chart.
- Area chart (stacked and normalized).
- Column chart (including normalized).
- Bar chart (including normalized).
- Scatter chart.
If the source data includes a row where the measure value is null, the chart with default settings connects the neighboring points with values other than null with a line.
You can configure how the chart will display null values in the chart section settings:
-
Click in the top-right corner of the section with the measure you want to configure (the icon appears when you hover over the section).
-
Configure the Null values option:
-
Hide: Do not show points with
nullvalues. On the chart, it will appear as a line gap, skipped column or point. For example, if the source has a row with the date,20.07.2022, but the sales total for it is not specified.Example of a chart with a gap
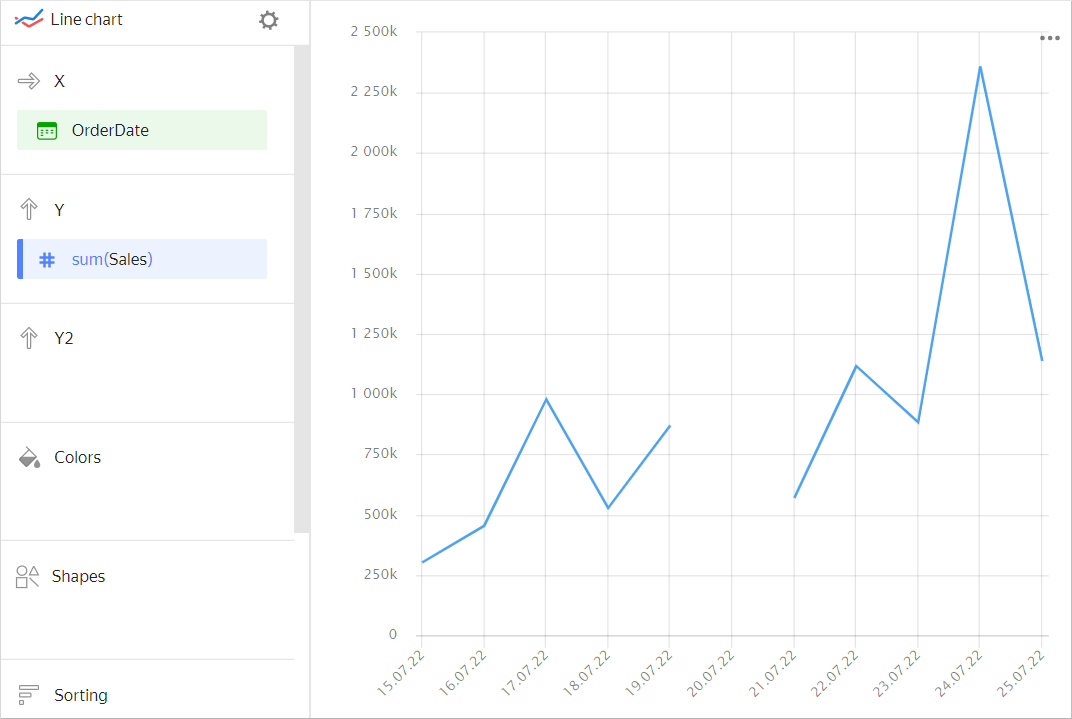
Source table
OrderDate Sales 15.07.2022 301629 16.07.2022 453595 17.07.2022 977583 18.07.2022 527834 19.07.2022 870054 20.07.2022 null 21.07.2022 569650 22.07.2022 1116034 23.07.2022 883208 24.07.2022 2359483 25.07.2022 1137851 -
Connect: Connect neighboring points with values other than
nullwith a line. -
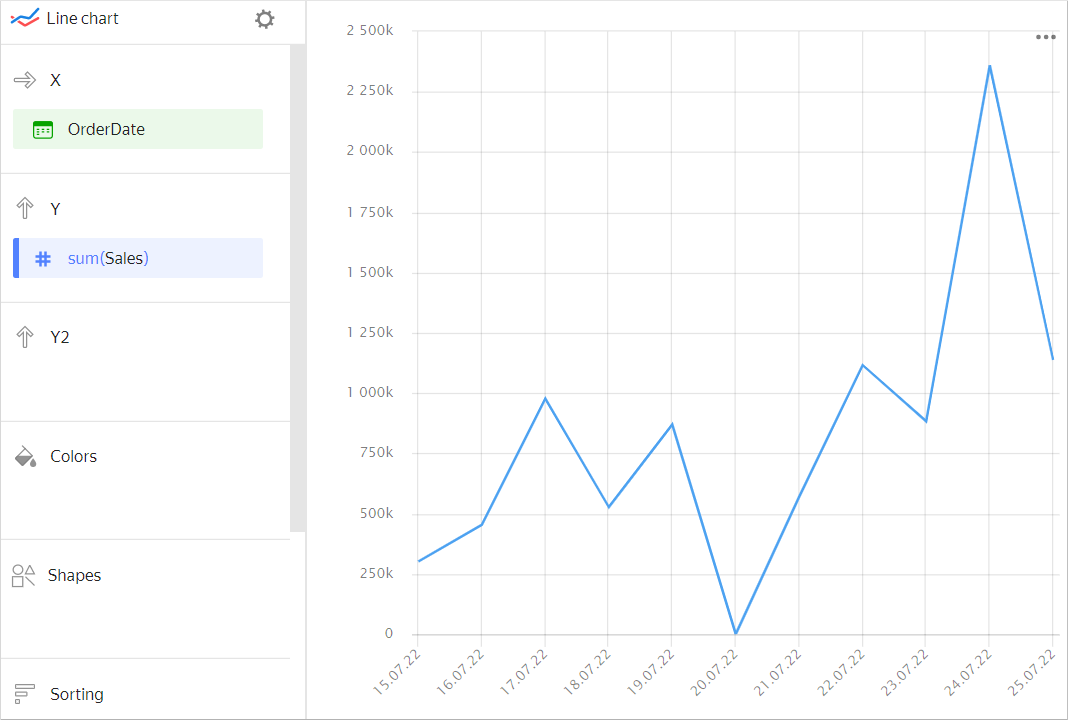
Display as 0: Replace
nullvalues with0.
-
-
Click Apply.
Example of replacing null with 0
If a row is missing from the source data altogether, the Null values option will not change the chart. For example, if the source does not have a row with the particular date, 20.07.2022, nothing will be shown for this date on the chart.
Example of a chart with a missing date
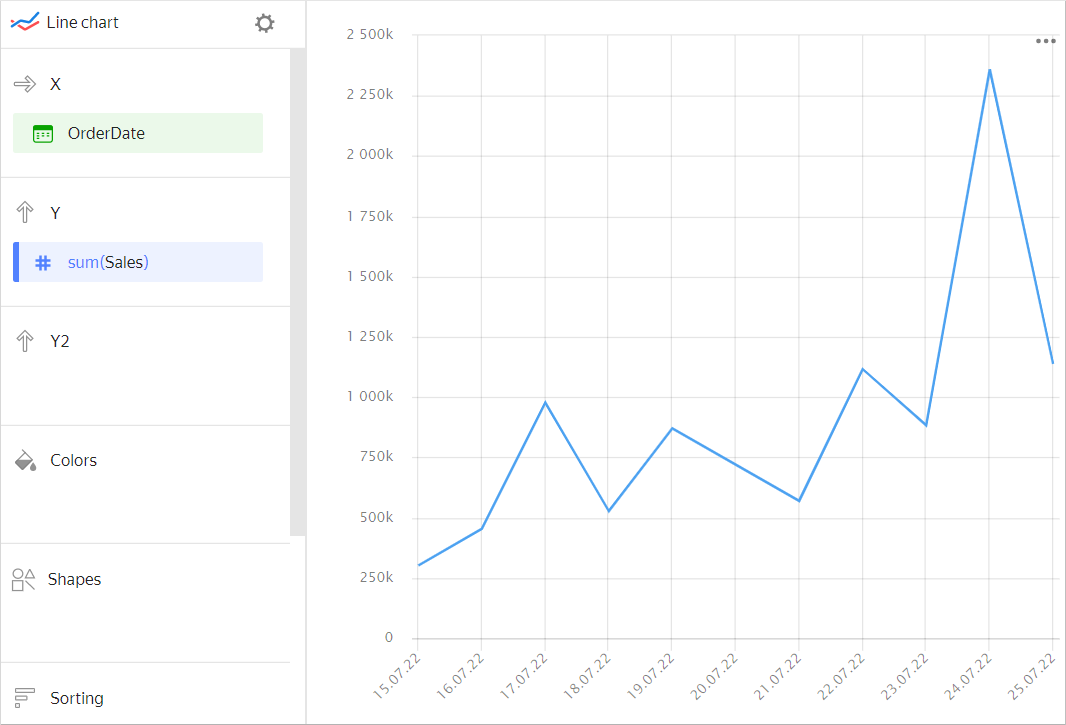
Source table
| OrderDate | Sales |
|---|---|
| 15.07.2022 | 301629 |
| 16.07.2022 | 453595 |
| 17.07.2022 | 977583 |
| 18.07.2022 | 527834 |
| 19.07.2022 | 870054 |
| 21.07.2022 | 569650 |
| 22.07.2022 | 1116034 |
| 23.07.2022 | 883208 |
| 24.07.2022 | 2359483 |
| 25.07.2022 | 1137851 |
Note
To display a null value for a date missing from the table:
- Add a row with this date and
nullfor the value to the source. - In the chart section settings for the relevant measure, select Display as 0 for the Null values option.