Are users able to adequately assess a product or is this dishonest competition?

A dashboard for a table of 150 million rows in 1.5 seconds
Yandex DataLens’s BI‑evangelist Roman Bunin and Yandex Cloud architect Igor Putyatin tell how to use Yandex DataLens and Yandex Managed Service for ClickHouse® to create super-fast dashboards.
As data volumes grow, (which is inevitable for any company), dashboards can begin taking up to a minute to load. The more data, the slower dashboards begin working, especially when you build them into detailed tables. Combining ClickHouse databases with the Yandex DataLens
Why make fast dashboards even faster? The Yandex Go case
Within Yandex, we use dashboards and product-based approaches to create reporting systems, and we regularly ask our colleagues what’s important for them when working with dashboards. A survey by the Yandex Go team showed that speed was the bottleneck of this tool.
In 2022, the Go team switched to Yandex DataLens. They had previous been using Tableau, a tool with its own in-house Hyper database, but its performance did not satisfy users.
DataLens uses an asynchronous method of drawing and loading graphs and natively connects to ClickHouse, which allowed the Go team to accelerate basic reporting.
First, the team transferred data from its internal YT storage (an equivalent of YTsaurus
Next, they needed to understand exactly which request gets from the database to the dashboard. Asynchronous loading of charts in the user’s field of view, a convenient inspector, and fast database performance customizable for specific query types led to a report with 100 M rows loading 6X faster: from 24-27 seconds in Tableau to 4-6 seconds in DataLens. Users both felt and appreciated these results.
Combining Yandex Managed Service for ClickHouse and Yandex DataLens
Inspired by the experience of Yandex Go, we decided to share some tips on how to optimize dashboards.
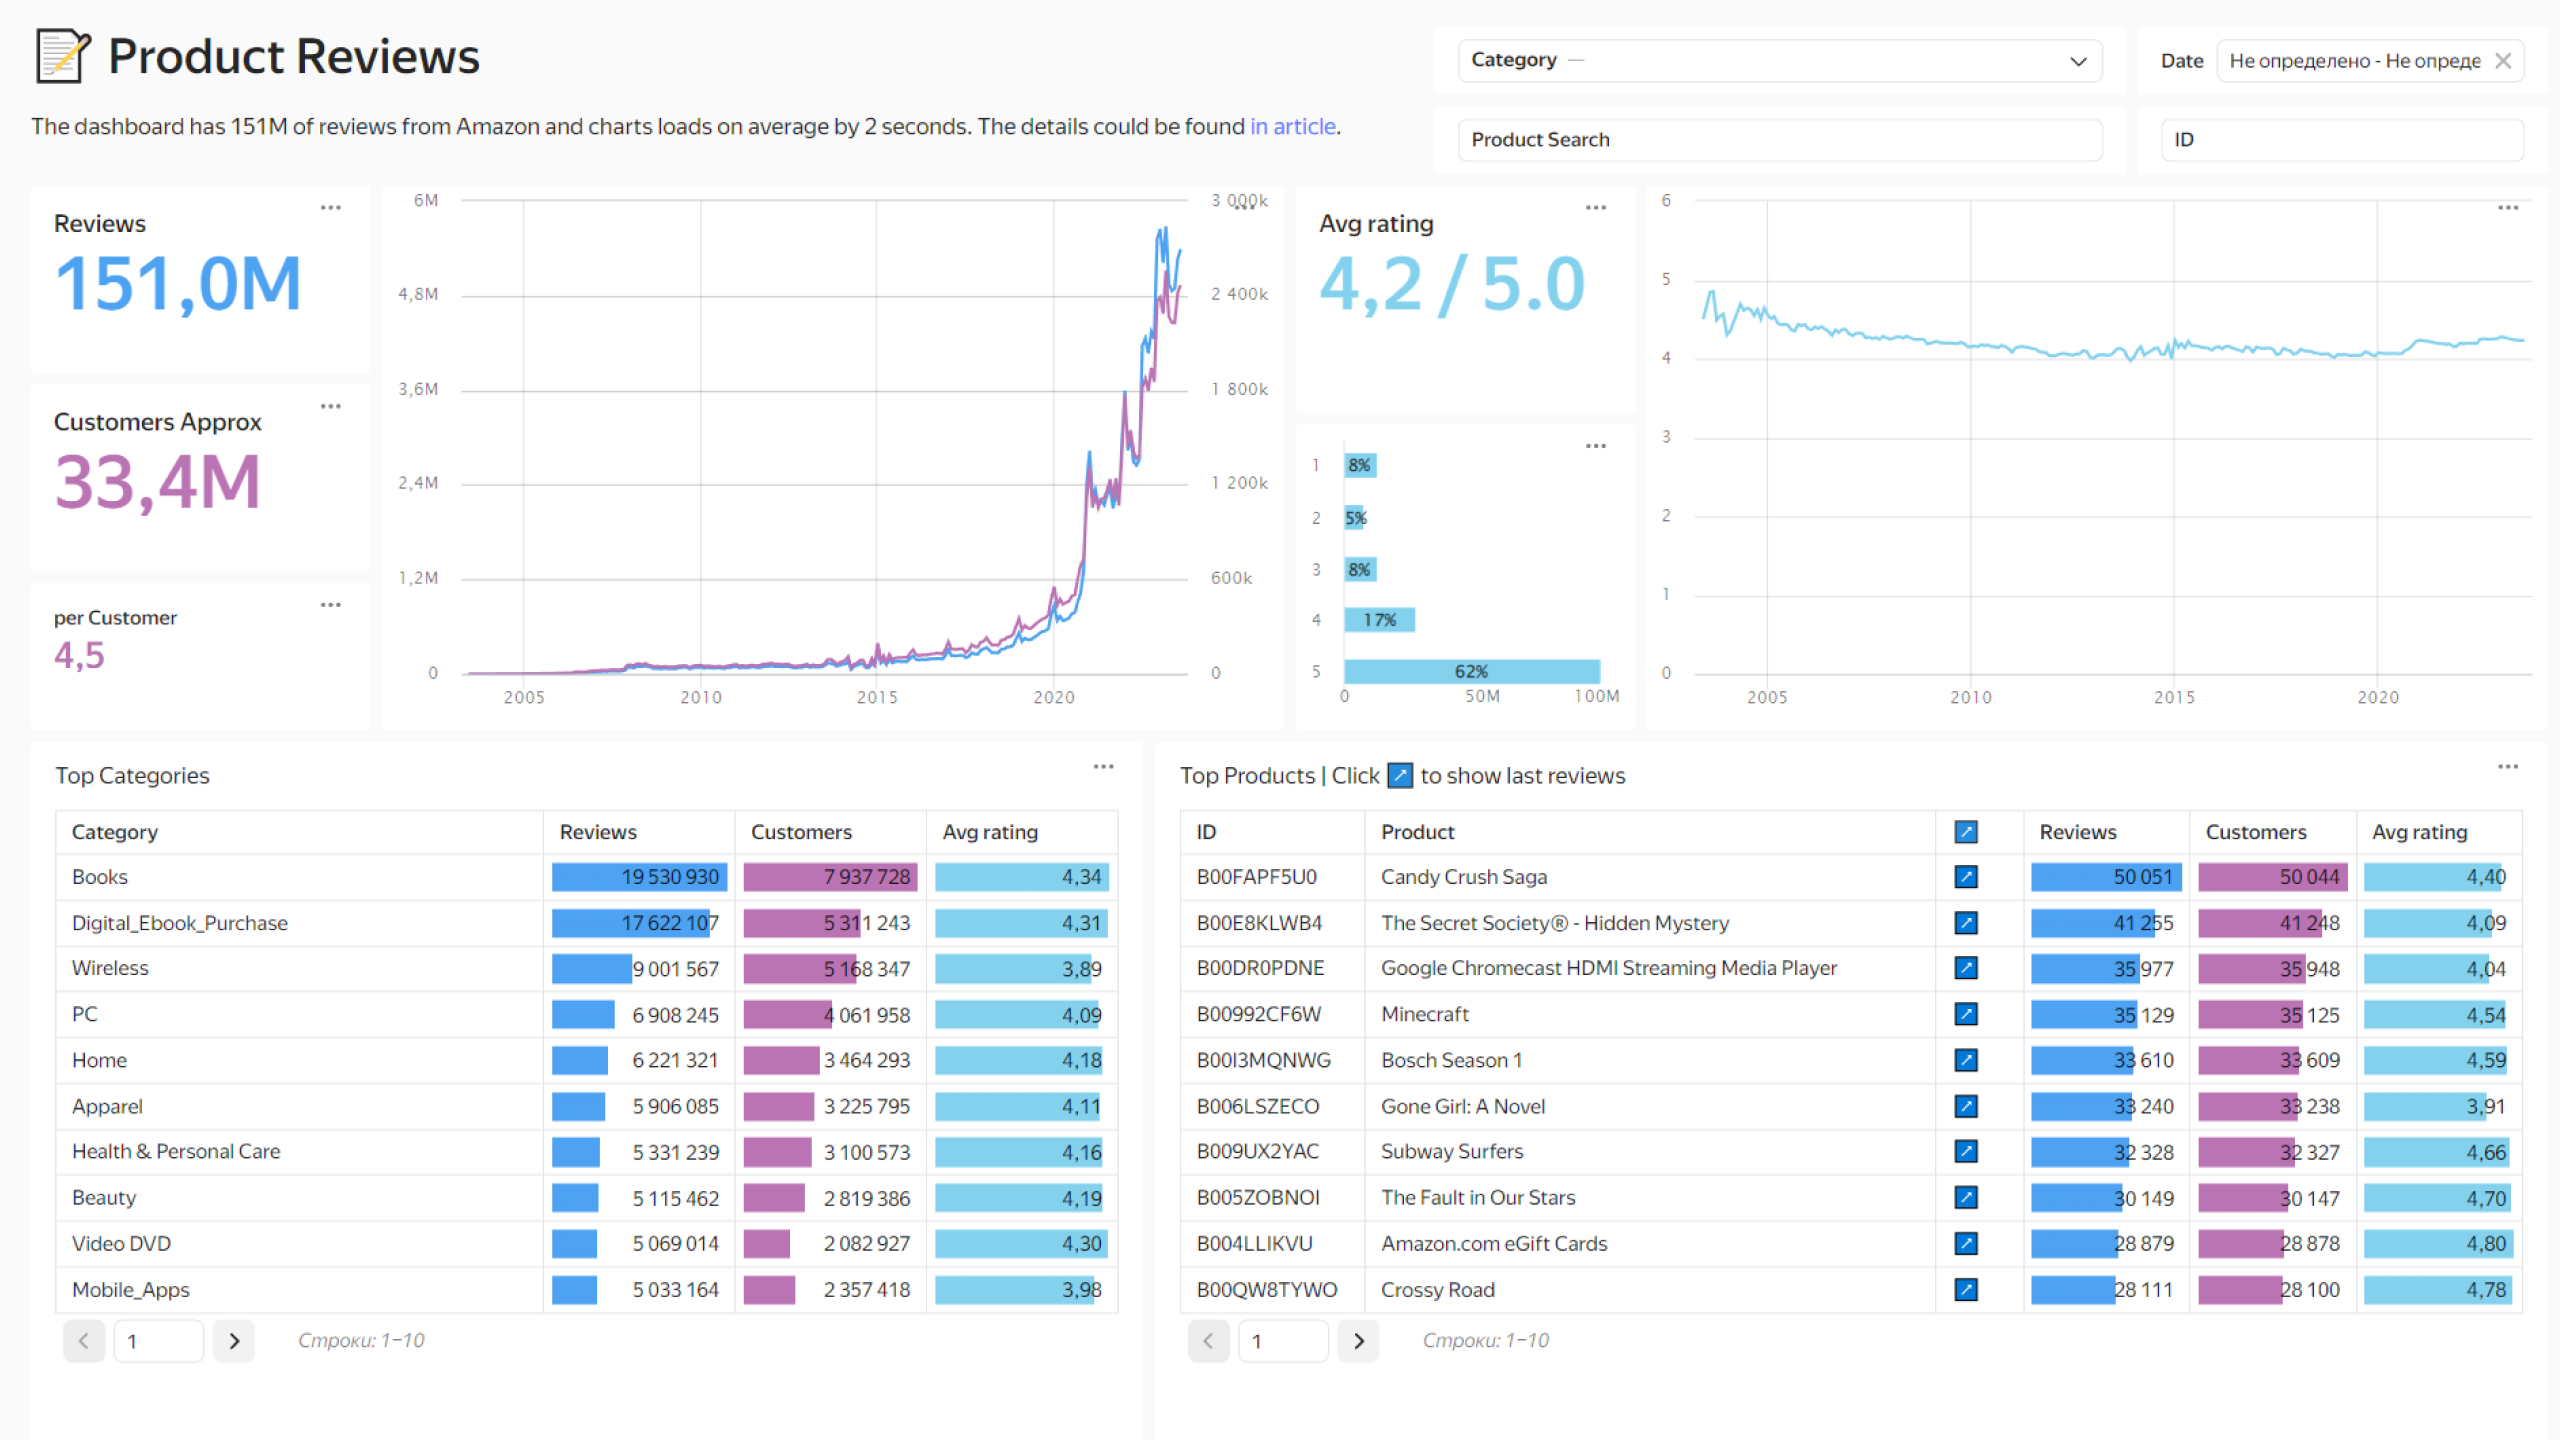
For a test dataset, we used a database of 151 million rows of product reviews which we usually use to test Yandex Managed Service for ClickHouse. We built a dashboard that would solve the tasks of category managers: assessing how often people write product reviews, which products are most popular, or vice versa, i.e., which products should be removed from the assortment.

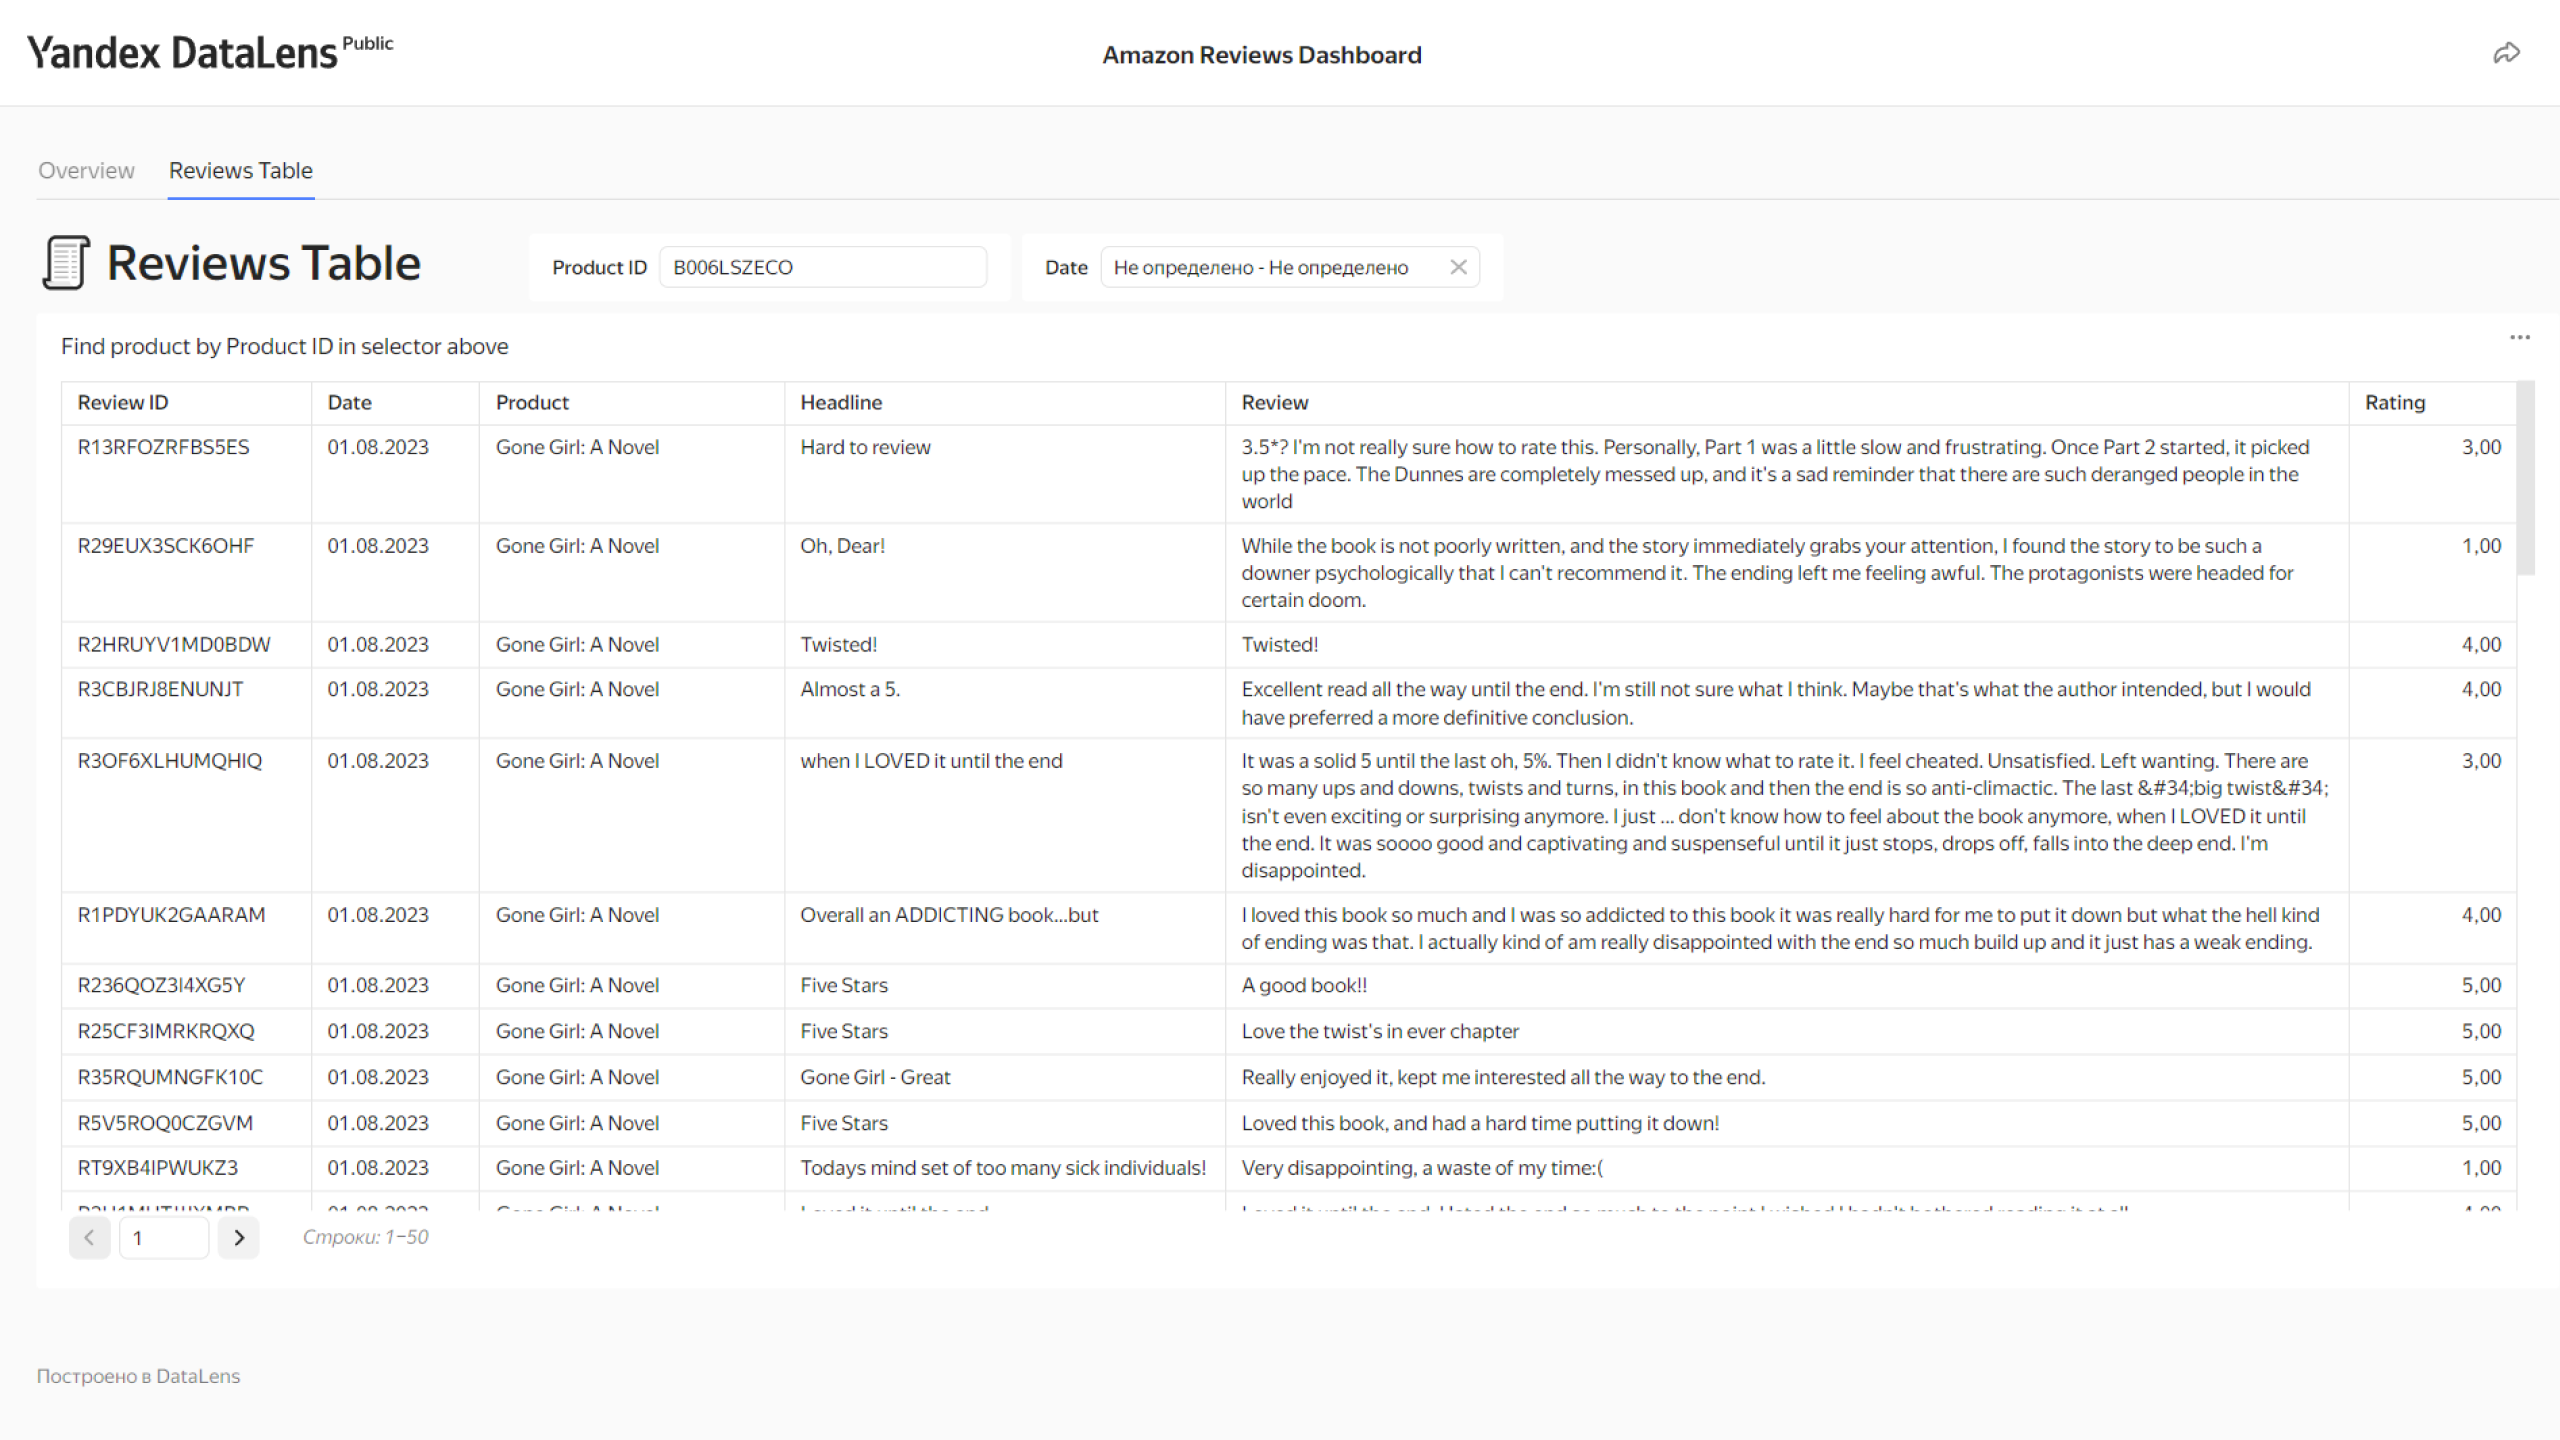
Users value the ability to view product reviews:

Optimizing speed
The dashboard’s data source is one large, wide table with detailed data on product reviews. The dashboard contents represent various aggregations of table elements. And remember that it should be possible to view non-aggregated data as well — separate records with reviews.
For such a scenario, ClickHouse is ideally suited as a DBMS for delivering data to the dashboard. Column storage speeds up the construction of separate graphs and widgets that use a small number of fields in the source: only columns that are needed from the source table get scanned. Thus, we don’t need to create and maintain additional aggregation tables — all charts and dashboard tables are built as you go using one table in ClickHouse.
Our solution was to create a Yandex Managed Service for ClickHouse cluster in Yandex Cloud. Managed database services in Yandex Cloud allow you to deploy various DBMS in a couple of minutes. All you need to do is select the desired resource configuration in the web interface
The dashboard can display data for any period, including for all available dates, and full scan requests will be sent to the table. With this load profile, disk performance is critical, so we chose local ssd type drives that provide maximum performance.
Local ssd drives are not fault-tolerant, however, so Yandex Managed Service for ClickHouse had us create a cluster with at least one replica for reliability.
The final cluster configuration ended up with two hosts, each with 12 vCPUs, 48 GB RAM, and 368 GB local ssd storage.
The source data is stored as a CSV file in a public S3 storage. We uploaded it to Yandex Managed Service for ClickHouse with a single insertion operation, since ClickHouse supports external tables loading data via the S3 protocol.
The feedback table is stored in ClickHouse in the ReplicatedMergeTree format, also called an engine. In tables of this type, data is stored generationally, sorted, and compressed. A primary index is also always created for sorting attributes with the table.
Yandex Managed Service for ClickHouse
Our dashboard uses total aggregations across the entire table (total number of reviews, average rating), as well as aggregations by date, category, and product, plus filtering by these same dimensions. To optimize, we chose to sort the data by category, then by product. The product is the dimension with the highest cardinality used, and the category uniquely depends on the product. By storing data sorted in this way, we achieve quick filtration by category and product.
This sorting ensures that the tab with detailed reviews works quickly, even if you need to open several reviews out of 150 million. When requesting feedback on a specific product, Yandex Managed Service for ClickHouse knows where the product data in the file starts, and only reads that part of the file. At the same time, the data on the relevant product go sequentially and are not scattered across different parts of the file. In other words, to output reviews to the database, one can simply read a small portion of data in the middle of the file.
To display the dashboard faster, we used a projection mechanism which supports Yandex Managed Service for ClickHouse. Projections are additional structures of pre-aggregated data stored in the DBMS and linked to the main table. When executing a query, the optimizer can read data from the projection instead of the table, if the aggregations in the query match those in the projection. Projections are updated asynchronously with the MATERIALIZE command, and which time-wise is comparable to a query from a table without projection. In our example, doing this once is sufficient.
We created three projections for the dashboard: by date (monthly), by product category, and by product. So, when the dashboard is initially opened for two graphs and two tables that took the longest to load, data is read from projections.
To further improve cluster performance, horizontal scaling can be applied, i.e. increasing the number of hosts in the cluster. Yandex Managed Service for ClickHouse supports sharding and parallel request processing, significantly improving database performance.
For each chart, we measured the loading time using the inspector and compiled them into a single table:
| Load time, ms | |
|---|---|
| Chart 1: indicator — number of reviews | 575 |
| Chart 2: indicator — number of users | 953 |
| Chart 3: indicator — number of reviews per user | 628 |
| Chart 4: line chart — number of users and reviews | 2556 |
| Chart 5: indicator — average rating | 673 |
| Chart 6: bar chart — average rating | 681 |
| Chart 7: table — top categories | 1143 |
| Chart 8: line graph — average rating | 766 |
| Chart 9: table — top products | 5451 |
| Average time | 1492 |
Since the charts on the dashboard load asynchronously, we cannot say that it loads in a specific number of seconds. So we measured the load time of each chart individually.
You can see that most charts' loads speeds are less than a second. The detailed product table takes the longest to load, given that it displays the most detailed data.
We also worked on the Yandex DataLens side and the design of the dashboard:
-
Instead of the COUNTD function, the APPROX_COUNTD function was used to count unique users.
-
For top goods and products we used pagination with a restriction on the output of 10 categories or products at the same time.
-
We moved the table with detailed reviews to a separate tab, which can be accessed by clicking on the name of the category or product on the main dashboard. This makes it easy to select the right product without displaying all the reviews for all products in the table.
Conclusions
To demonstrate the capabilities of Yandex Managed Service for ClickHouse with Yandex DataLens, we developed a dashboard that takes data from a ClickHouse table. Now all charts load in an average of 1.5-2 seconds — an excellent result, achieved using basic functionalities of DataLens and Yandex Managed Service for ClickHouse. You can try out the public version
